
|
|||||
|
 | |
| |
| |
| |
| |
| |
|
Gene: TPPP3 |
Gene summary for TPPP3 |
| Gene information | Species | Human | Gene symbol | TPPP3 | Gene ID | 51673 |
| Gene name | tubulin polymerization promoting protein family member 3 | |
| Gene Alias | CGI-38 | |
| Cytomap | 16q22.1 | |
| Gene Type | protein-coding | GO ID | GO:0000003 | UniProtAcc | A0A024R702 |
Top |
Malignant transformation analysis |
| Identification of the aberrant gene expression in precancerous and cancerous lesions by comparing the gene expression of stem-like cells in diseased tissues with normal stem cells |
| Entrez ID | Symbol | Replicates | Species | Organ | Tissue | Adj P-value | Log2FC | Malignancy |
| 51673 | TPPP3 | LZE4T | Human | Esophagus | ESCC | 1.21e-09 | 5.24e-01 | 0.0811 |
| 51673 | TPPP3 | LZE8T | Human | Esophagus | ESCC | 2.75e-07 | 4.37e-01 | 0.067 |
| 51673 | TPPP3 | P8T-E | Human | Esophagus | ESCC | 3.53e-16 | 7.37e-01 | 0.0889 |
| 51673 | TPPP3 | P11T-E | Human | Esophagus | ESCC | 8.31e-06 | 5.60e-01 | 0.1426 |
| 51673 | TPPP3 | P19T-E | Human | Esophagus | ESCC | 2.85e-03 | 9.25e-01 | 0.1662 |
| 51673 | TPPP3 | P21T-E | Human | Esophagus | ESCC | 2.85e-64 | 2.58e+00 | 0.1617 |
| 51673 | TPPP3 | P22T-E | Human | Esophagus | ESCC | 1.06e-04 | -2.01e-02 | 0.1236 |
| 51673 | TPPP3 | P23T-E | Human | Esophagus | ESCC | 1.02e-06 | 3.42e-01 | 0.108 |
| 51673 | TPPP3 | P26T-E | Human | Esophagus | ESCC | 2.00e-09 | 3.73e-01 | 0.1276 |
| 51673 | TPPP3 | P31T-E | Human | Esophagus | ESCC | 5.34e-56 | 1.71e+00 | 0.1251 |
| 51673 | TPPP3 | P48T-E | Human | Esophagus | ESCC | 8.61e-12 | 4.29e-01 | 0.0959 |
| 51673 | TPPP3 | P54T-E | Human | Esophagus | ESCC | 1.43e-05 | 5.18e-01 | 0.0975 |
| 51673 | TPPP3 | P74T-E | Human | Esophagus | ESCC | 1.81e-15 | 5.08e-01 | 0.1479 |
| 51673 | TPPP3 | P82T-E | Human | Esophagus | ESCC | 1.05e-06 | 8.41e-01 | 0.1072 |
| 51673 | TPPP3 | P89T-E | Human | Esophagus | ESCC | 1.93e-08 | 1.32e+00 | 0.1752 |
| 51673 | TPPP3 | P91T-E | Human | Esophagus | ESCC | 5.45e-04 | 1.91e+00 | 0.1828 |
| 51673 | TPPP3 | P104T-E | Human | Esophagus | ESCC | 7.85e-07 | 5.36e-01 | 0.0931 |
| 51673 | TPPP3 | P107T-E | Human | Esophagus | ESCC | 8.60e-47 | 1.91e+00 | 0.171 |
| 51673 | TPPP3 | P128T-E | Human | Esophagus | ESCC | 1.70e-02 | 3.08e-01 | 0.1241 |
| 51673 | TPPP3 | P130T-E | Human | Esophagus | ESCC | 3.14e-22 | 6.49e-01 | 0.1676 |
| Page: 1 2 3 4 |
| Tissue | Expression Dynamics | Abbreviation |
| Esophagus | 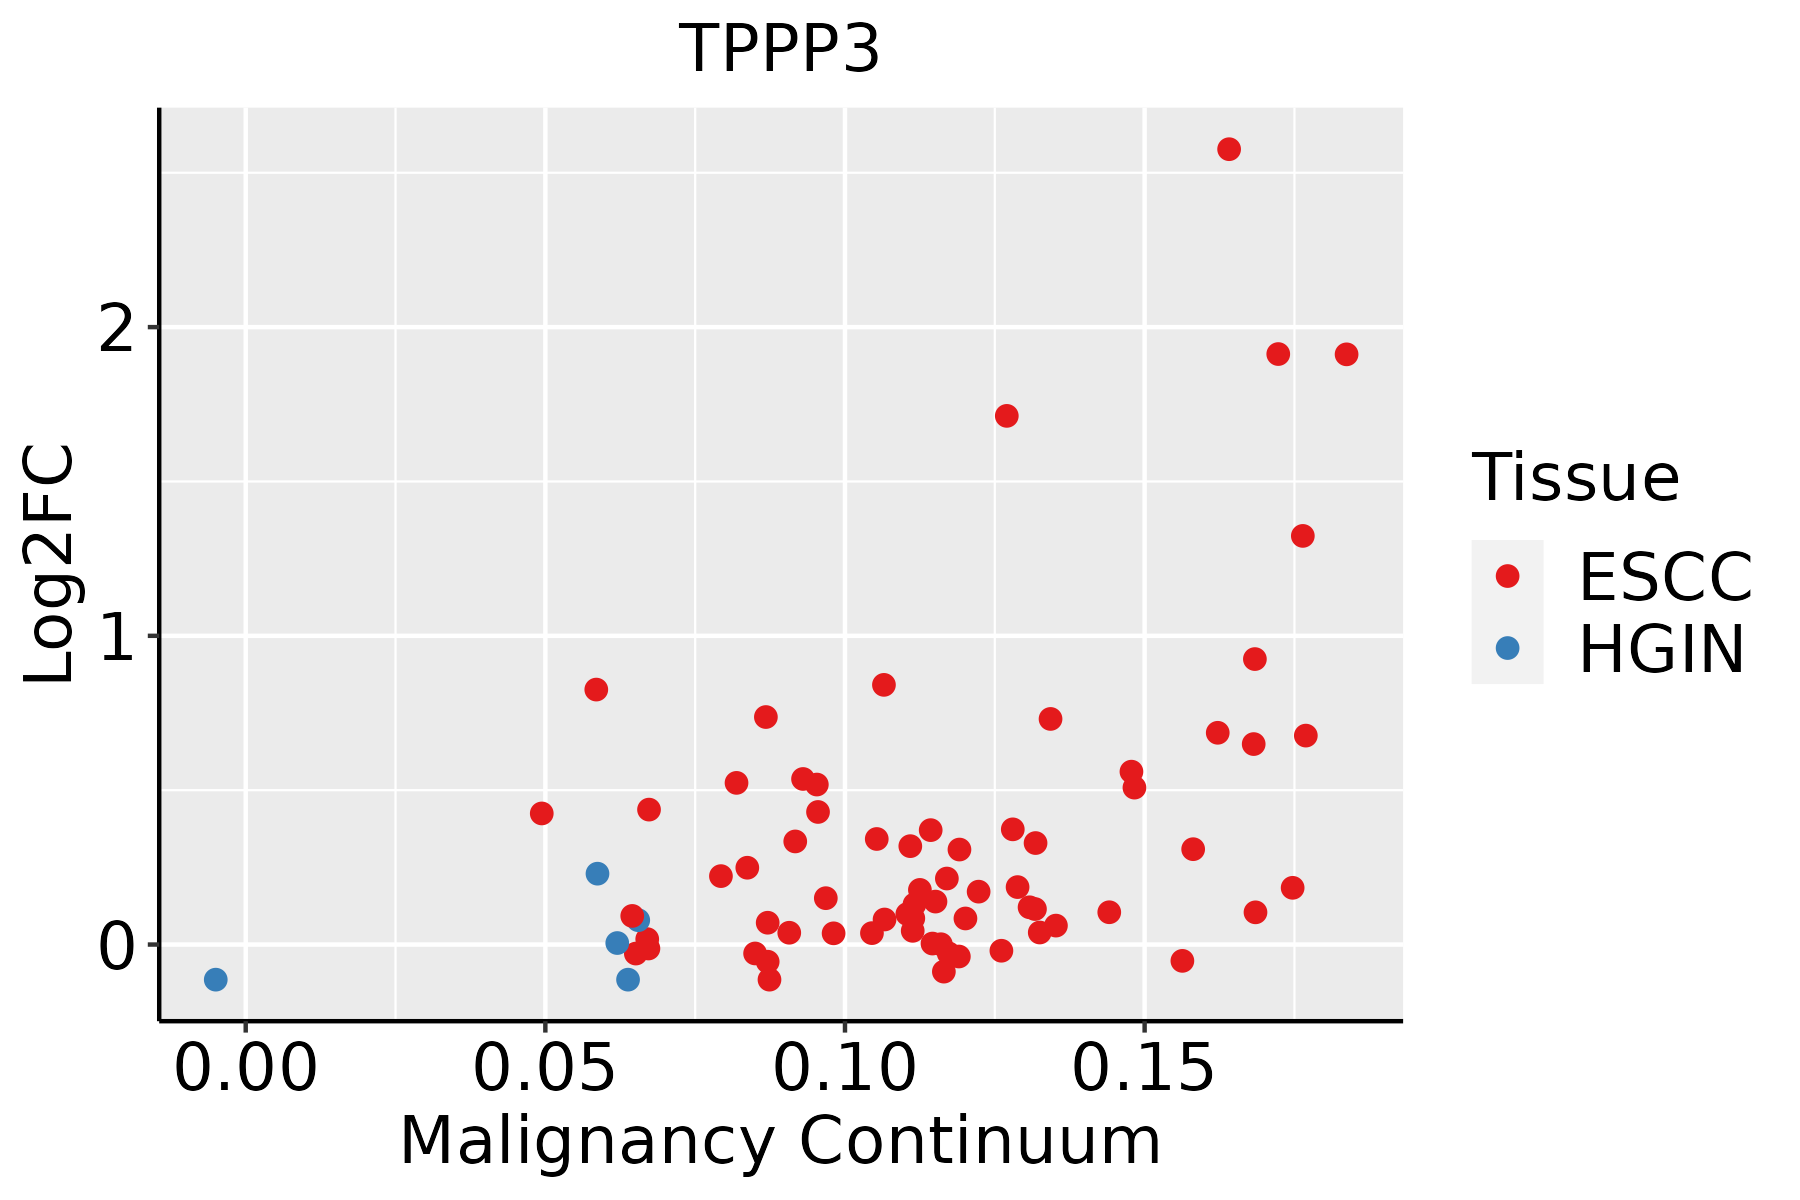 | ESCC: Esophageal squamous cell carcinoma |
| HGIN: High-grade intraepithelial neoplasias | ||
| LGIN: Low-grade intraepithelial neoplasias | ||
| Liver | 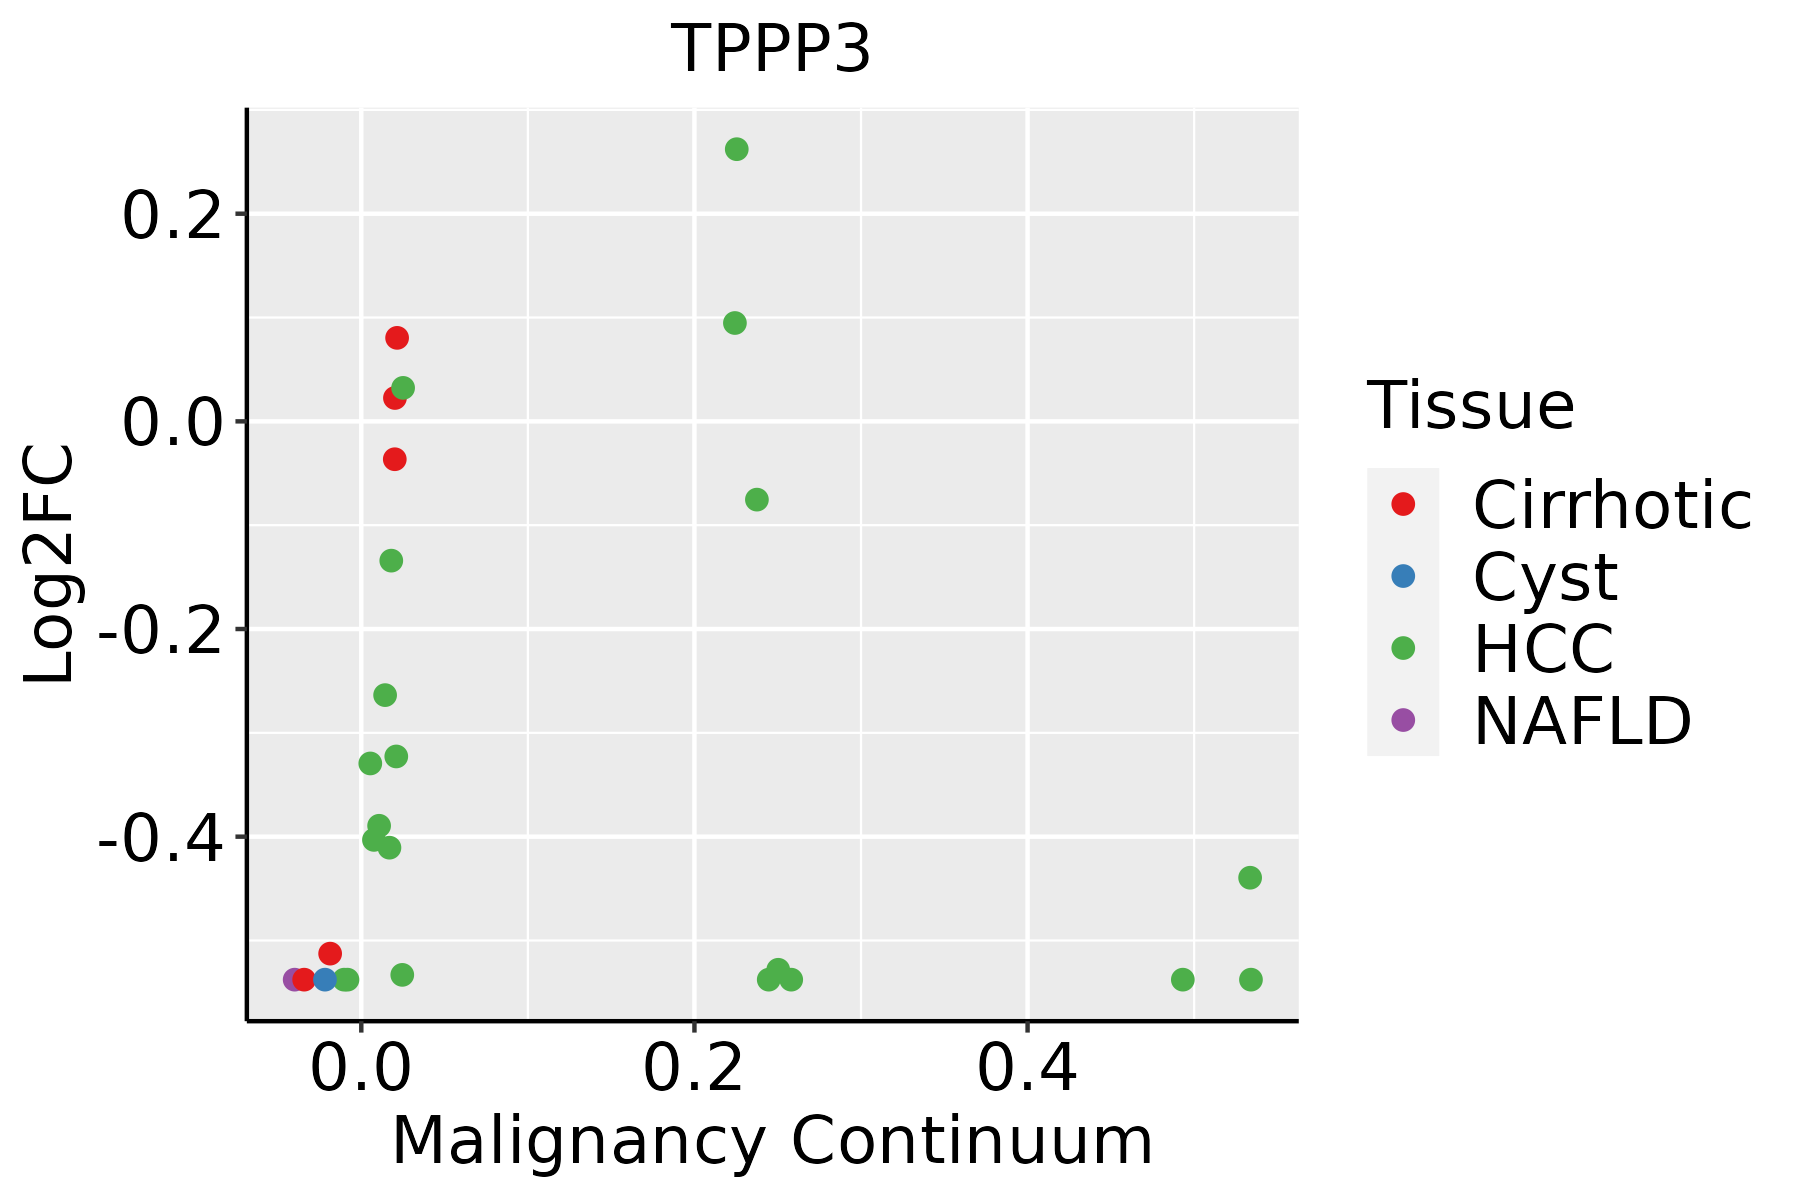 | HCC: Hepatocellular carcinoma |
| NAFLD: Non-alcoholic fatty liver disease | ||
| Oral Cavity | 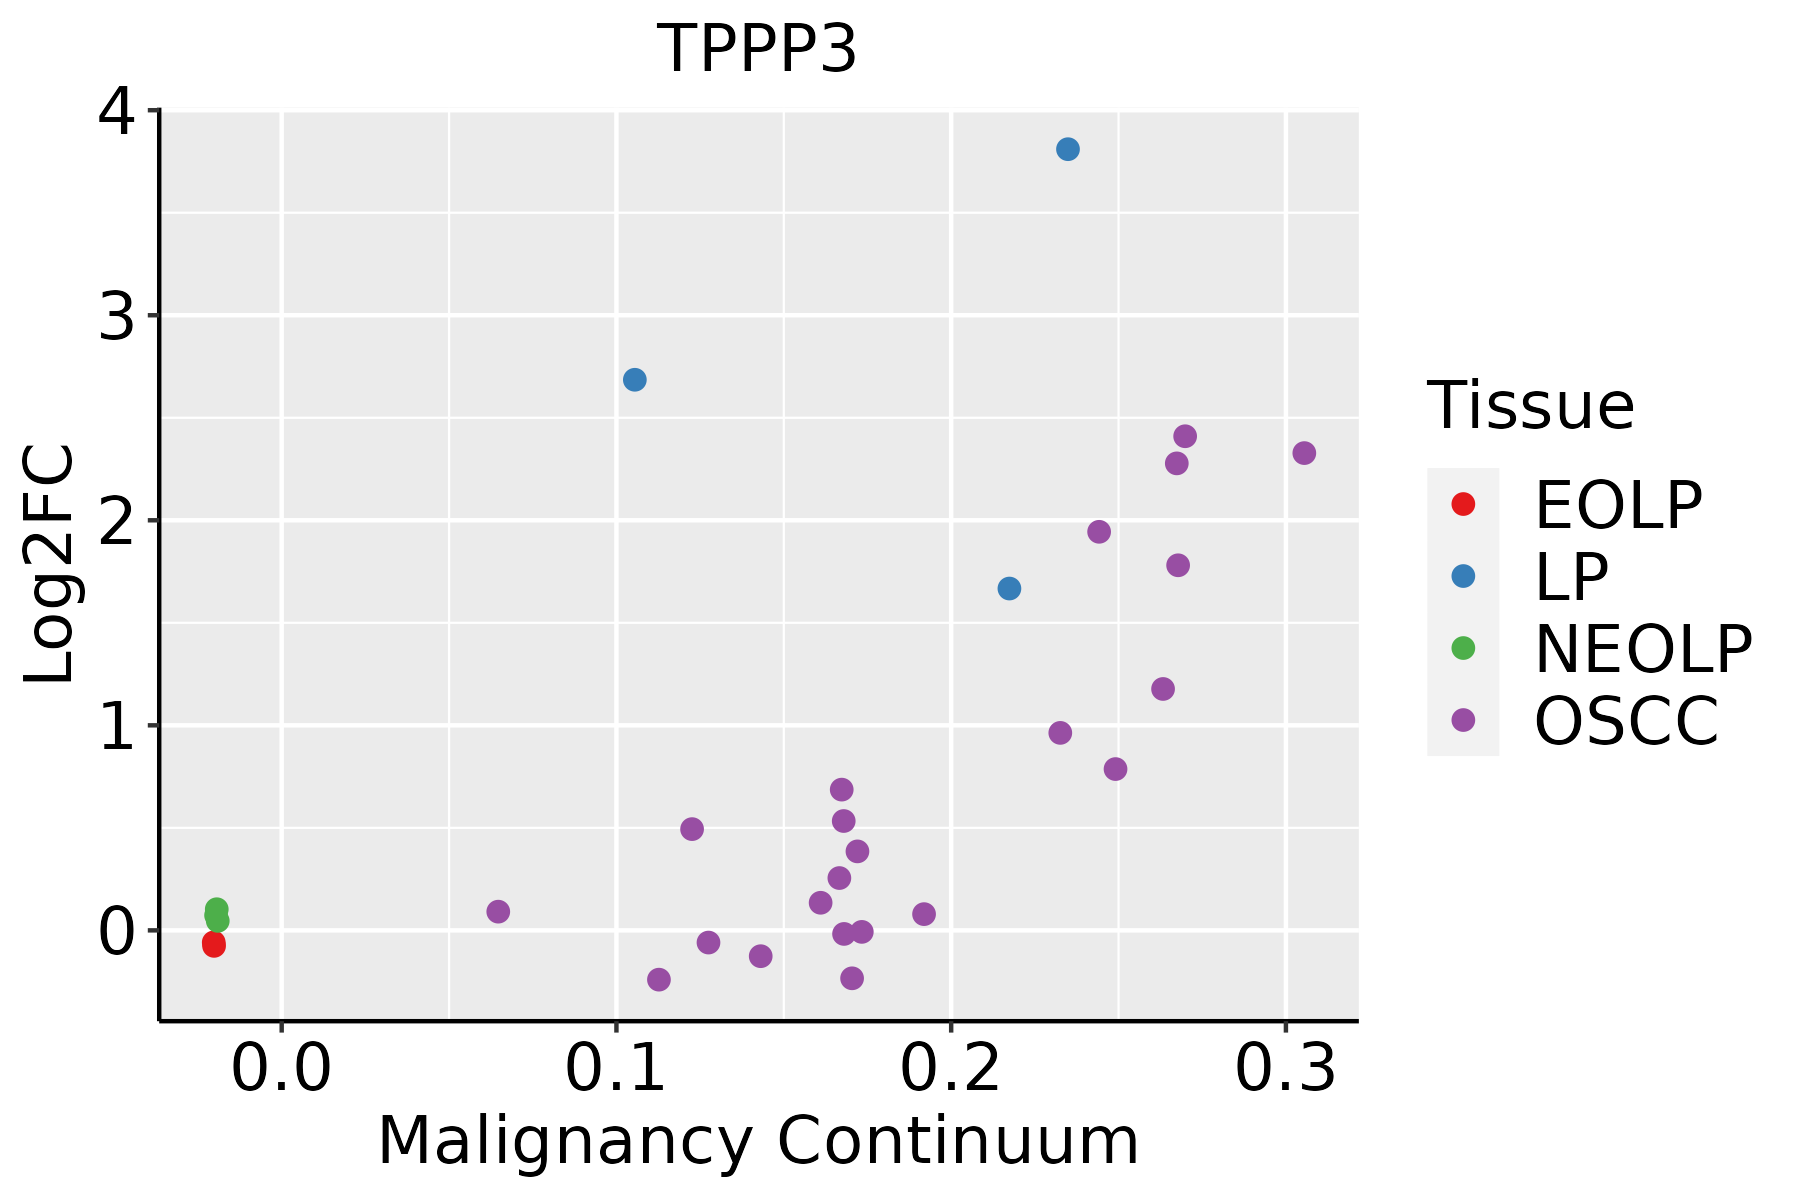 | EOLP: Erosive Oral lichen planus |
| LP: leukoplakia | ||
| NEOLP: Non-erosive oral lichen planus | ||
| OSCC: Oral squamous cell carcinoma | ||
| Skin |  | AK: Actinic keratosis |
| cSCC: Cutaneous squamous cell carcinoma | ||
| SCCIS:squamous cell carcinoma in situ |
| ∗log2FC in expression of this searched gene in stem-like cells from each diseased tissue sample relative to stem-like cells in normal samples in each tissue plotted against the malignancy continuum. Samples are colored based on if they are from different disease stage. |
Top |
Malignant transformation related pathway analysis |
| Find out the enriched GO biological processes and KEGG pathways involved in transition from healthy to precancer to cancer |
| Tissue | Disease Stage | Enriched GO biological Processes |
| Colorectum | AD |  |
| Colorectum | SER |  |
| Colorectum | MSS |  |
| Colorectum | MSI-H |  |
| Colorectum | FAP |  |
| ∗Top 15 enriched GO BP terms are showed in the bar plot of each disease state in each tissue. Each row represents a significant GO biological process which is colored according to the -log10(p.adjust). |
| Page: 1 2 3 4 5 6 7 8 9 |
| GO ID | Tissue | Disease Stage | Description | Gene Ratio | Bg Ratio | pvalue | p.adjust | Count |
| GO:0043254111 | Esophagus | ESCC | regulation of protein-containing complex assembly | 278/8552 | 428/18723 | 3.81e-16 | 2.77e-14 | 278 |
| GO:0031334111 | Esophagus | ESCC | positive regulation of protein-containing complex assembly | 166/8552 | 237/18723 | 2.06e-14 | 1.07e-12 | 166 |
| GO:0051258111 | Esophagus | ESCC | protein polymerization | 183/8552 | 297/18723 | 1.94e-08 | 3.75e-07 | 183 |
| GO:0032273111 | Esophagus | ESCC | positive regulation of protein polymerization | 95/8552 | 138/18723 | 2.97e-08 | 5.57e-07 | 95 |
| GO:0001890110 | Esophagus | ESCC | placenta development | 98/8552 | 144/18723 | 4.46e-08 | 8.11e-07 | 98 |
| GO:0061458110 | Esophagus | ESCC | reproductive system development | 247/8552 | 427/18723 | 2.24e-07 | 3.42e-06 | 247 |
| GO:004860818 | Esophagus | ESCC | reproductive structure development | 245/8552 | 424/18723 | 2.82e-07 | 4.14e-06 | 245 |
| GO:0032271111 | Esophagus | ESCC | regulation of protein polymerization | 143/8552 | 233/18723 | 9.21e-07 | 1.17e-05 | 143 |
| GO:00018937 | Esophagus | ESCC | maternal placenta development | 28/8552 | 35/18723 | 3.40e-05 | 2.78e-04 | 28 |
| GO:00311094 | Esophagus | ESCC | microtubule polymerization or depolymerization | 77/8552 | 122/18723 | 7.60e-05 | 5.68e-04 | 77 |
| GO:00467856 | Esophagus | ESCC | microtubule polymerization | 55/8552 | 83/18723 | 1.21e-04 | 8.31e-04 | 55 |
| GO:00466975 | Esophagus | ESCC | decidualization | 21/8552 | 26/18723 | 2.69e-04 | 1.63e-03 | 21 |
| GO:00601357 | Esophagus | ESCC | maternal process involved in female pregnancy | 40/8552 | 62/18723 | 2.14e-03 | 9.54e-03 | 40 |
| GO:00075668 | Esophagus | ESCC | embryo implantation | 35/8552 | 53/18723 | 2.22e-03 | 9.78e-03 | 35 |
| GO:004325412 | Liver | Cirrhotic | regulation of protein-containing complex assembly | 169/4634 | 428/18723 | 7.40e-12 | 4.99e-10 | 169 |
| GO:005125812 | Liver | Cirrhotic | protein polymerization | 116/4634 | 297/18723 | 2.87e-08 | 9.78e-07 | 116 |
| GO:00313347 | Liver | Cirrhotic | positive regulation of protein-containing complex assembly | 95/4634 | 237/18723 | 1.21e-07 | 3.39e-06 | 95 |
| GO:003227112 | Liver | Cirrhotic | regulation of protein polymerization | 92/4634 | 233/18723 | 4.25e-07 | 9.86e-06 | 92 |
| GO:003227312 | Liver | Cirrhotic | positive regulation of protein polymerization | 58/4634 | 138/18723 | 5.96e-06 | 9.69e-05 | 58 |
| GO:00018905 | Liver | Cirrhotic | placenta development | 57/4634 | 144/18723 | 5.74e-05 | 6.58e-04 | 57 |
| Page: 1 2 3 4 5 6 |
| Pathway ID | Tissue | Disease Stage | Description | Gene Ratio | Bg Ratio | pvalue | p.adjust | qvalue | Count |
| Page: 1 |
Top |
Cell-cell communication analysis |
| Identification of potential cell-cell interactions between two cell types and their ligand-receptor pairs for different disease states |
| Ligand | Receptor | LRpair | Pathway | Tissue | Disease Stage |
| Page: 1 |
Top |
Single-cell gene regulatory network inference analysis |
| Find out the significant the regulons (TFs) and the target genes of each regulon across cell types for different disease states |
| TF | Cell Type | Tissue | Disease Stage | Target Gene | RSS | Regulon Activity |
| ∗The dot plots of a searched regulon are shown for all cell subpopulations in each disease state of each tissue based on the regulon specific score inferred using pySCENIC and by calculating the average expression. |
| Page: 1 |
Top |
Somatic mutation of malignant transformation related genes |
| Annotation of somatic variants for genes involved in malignant transformation |
| Hugo Symbol | Variant Class | Variant Classification | dbSNP RS | HGVSc | HGVSp | HGVSp Short | SWISSPROT | BIOTYPE | SIFT | PolyPhen | Tumor Sample Barcode | Tissue | Histology | Sex | Age | Stage | Therapy Types | Drugs | Outcome |
| TPPP3 | SNV | Missense_Mutation | rs562124643 | c.412N>T | p.Arg138Cys | p.R138C | Q9BW30 | protein_coding | tolerated(0.08) | probably_damaging(0.999) | TCGA-AC-A3QP-01 | Breast | breast invasive carcinoma | Female | >=65 | I/II | Hormone Therapy | femara | SD |
| TPPP3 | SNV | Missense_Mutation | c.487G>T | p.Ala163Ser | p.A163S | Q9BW30 | protein_coding | tolerated(0.12) | benign(0.039) | TCGA-BH-A0BL-01 | Breast | breast invasive carcinoma | Female | <65 | I/II | Chemotherapy | adriamycin | CR | |
| TPPP3 | SNV | Missense_Mutation | novel | c.431A>C | p.Lys144Thr | p.K144T | Q9BW30 | protein_coding | deleterious(0) | possibly_damaging(0.846) | TCGA-2W-A8YY-01 | Cervix | cervical & endocervical cancer | Female | <65 | I/II | Chemotherapy | cisplatin | CR |
| TPPP3 | SNV | Missense_Mutation | c.469G>A | p.Asp157Asn | p.D157N | Q9BW30 | protein_coding | tolerated(1) | benign(0.001) | TCGA-A6-6781-01 | Colorectum | colon adenocarcinoma | Male | <65 | III/IV | Chemotherapy | oxaliplatin | SD | |
| TPPP3 | SNV | Missense_Mutation | novel | c.476N>A | p.Gly159Asp | p.G159D | Q9BW30 | protein_coding | tolerated(0.06) | probably_damaging(0.941) | TCGA-AA-3864-01 | Colorectum | colon adenocarcinoma | Male | >=65 | I/II | Unknown | Unknown | SD |
| TPPP3 | SNV | Missense_Mutation | rs562124643 | c.412C>T | p.Arg138Cys | p.R138C | Q9BW30 | protein_coding | tolerated(0.08) | probably_damaging(0.999) | TCGA-D5-6531-01 | Colorectum | colon adenocarcinoma | Male | >=65 | I/II | Unknown | Unknown | SD |
| TPPP3 | insertion | Frame_Shift_Ins | novel | c.62_63insATGGCTGGGCTGGAGGAGAGCTTCCGCAAGTTTGTCATCCATGG | p.Asp22TrpfsTer24 | p.D22Wfs*24 | Q9BW30 | protein_coding | TCGA-EI-6510-01 | Colorectum | rectum adenocarcinoma | Female | >=65 | I/II | Unknown | Unknown | SD | ||
| TPPP3 | SNV | Missense_Mutation | rs749753194 | c.511G>A | p.Asp171Asn | p.D171N | Q9BW30 | protein_coding | deleterious(0.04) | benign(0.269) | TCGA-AP-A1DV-01 | Endometrium | uterine corpus endometrioid carcinoma | Female | <65 | I/II | Unknown | Unknown | SD |
| TPPP3 | SNV | Missense_Mutation | c.125N>A | p.Cys42Tyr | p.C42Y | Q9BW30 | protein_coding | deleterious(0) | probably_damaging(0.999) | TCGA-D1-A0ZO-01 | Endometrium | uterine corpus endometrioid carcinoma | Female | >=65 | I/II | Unknown | Unknown | SD | |
| TPPP3 | SNV | Missense_Mutation | rs377234620 | c.44G>A | p.Arg15His | p.R15H | Q9BW30 | protein_coding | tolerated(0.24) | benign(0.021) | TCGA-EO-A22R-01 | Endometrium | uterine corpus endometrioid carcinoma | Female | <65 | I/II | Unknown | Unknown | SD |
| Page: 1 2 |
Top |
Related drugs of malignant transformation related genes |
| Identification of chemicals and drugs interact with genes involved in malignant transfromation |
| (DGIdb 4.0) |
| Entrez ID | Symbol | Category | Interaction Types | Drug Claim Name | Drug Name | PMIDs |
| Page: 1 |

Copyright 2023-Present -The University of Texas Health Science Center at Houston |