
|
|||||
|
 | |
| |
| |
| |
| |
| |
|
Gene: TPP2 |
Gene summary for TPP2 |
| Gene information | Species | Human | Gene symbol | TPP2 | Gene ID | 7174 |
| Gene name | tripeptidyl peptidase 2 | |
| Gene Alias | IMD78 | |
| Cytomap | 13q33.1 | |
| Gene Type | protein-coding | GO ID | GO:0000209 | UniProtAcc | P29144 |
Top |
Malignant transformation analysis |
| Identification of the aberrant gene expression in precancerous and cancerous lesions by comparing the gene expression of stem-like cells in diseased tissues with normal stem cells |
| Entrez ID | Symbol | Replicates | Species | Organ | Tissue | Adj P-value | Log2FC | Malignancy |
| 7174 | TPP2 | HTA11_3410_2000001011 | Human | Colorectum | AD | 9.49e-20 | -5.75e-01 | 0.0155 |
| 7174 | TPP2 | HTA11_2487_2000001011 | Human | Colorectum | SER | 6.03e-10 | -5.46e-01 | -0.1808 |
| 7174 | TPP2 | HTA11_2951_2000001011 | Human | Colorectum | AD | 1.34e-03 | -5.63e-01 | 0.0216 |
| 7174 | TPP2 | HTA11_1938_2000001011 | Human | Colorectum | AD | 9.81e-04 | -4.42e-01 | -0.0811 |
| 7174 | TPP2 | HTA11_78_2000001011 | Human | Colorectum | AD | 1.82e-04 | -3.99e-01 | -0.1088 |
| 7174 | TPP2 | HTA11_3361_2000001011 | Human | Colorectum | AD | 2.97e-07 | -5.40e-01 | -0.1207 |
| 7174 | TPP2 | HTA11_83_2000001011 | Human | Colorectum | SER | 1.43e-04 | -5.13e-01 | -0.1526 |
| 7174 | TPP2 | HTA11_696_2000001011 | Human | Colorectum | AD | 3.90e-18 | -4.96e-01 | -0.1464 |
| 7174 | TPP2 | HTA11_866_2000001011 | Human | Colorectum | AD | 8.14e-11 | -4.42e-01 | -0.1001 |
| 7174 | TPP2 | HTA11_1391_2000001011 | Human | Colorectum | AD | 6.56e-07 | -4.31e-01 | -0.059 |
| 7174 | TPP2 | HTA11_5212_2000001011 | Human | Colorectum | AD | 7.97e-03 | -5.63e-01 | -0.2061 |
| 7174 | TPP2 | HTA11_546_2000001011 | Human | Colorectum | AD | 1.01e-02 | -4.78e-01 | -0.0842 |
| 7174 | TPP2 | HTA11_866_3004761011 | Human | Colorectum | AD | 3.92e-12 | -5.08e-01 | 0.096 |
| 7174 | TPP2 | HTA11_8622_2000001021 | Human | Colorectum | SER | 1.06e-02 | -5.45e-01 | 0.0528 |
| 7174 | TPP2 | HTA11_7663_2000001011 | Human | Colorectum | SER | 3.48e-02 | -5.71e-01 | 0.0131 |
| 7174 | TPP2 | HTA11_10711_2000001011 | Human | Colorectum | AD | 7.73e-10 | -5.58e-01 | 0.0338 |
| 7174 | TPP2 | HTA11_7696_3000711011 | Human | Colorectum | AD | 2.91e-18 | -5.33e-01 | 0.0674 |
| 7174 | TPP2 | HTA11_6818_2000001011 | Human | Colorectum | AD | 1.82e-04 | -5.79e-01 | 0.0112 |
| 7174 | TPP2 | HTA11_6818_2000001021 | Human | Colorectum | AD | 3.21e-09 | -5.94e-01 | 0.0588 |
| 7174 | TPP2 | HTA11_99999970781_79442 | Human | Colorectum | MSS | 2.84e-04 | -2.53e-01 | 0.294 |
| Page: 1 2 3 4 5 6 7 8 |
| Tissue | Expression Dynamics | Abbreviation |
| Colorectum (GSE201348) |  | FAP: Familial adenomatous polyposis |
| CRC: Colorectal cancer | ||
| Colorectum (HTA11) |  | AD: Adenomas |
| SER: Sessile serrated lesions | ||
| MSI-H: Microsatellite-high colorectal cancer | ||
| MSS: Microsatellite stable colorectal cancer | ||
| Esophagus | 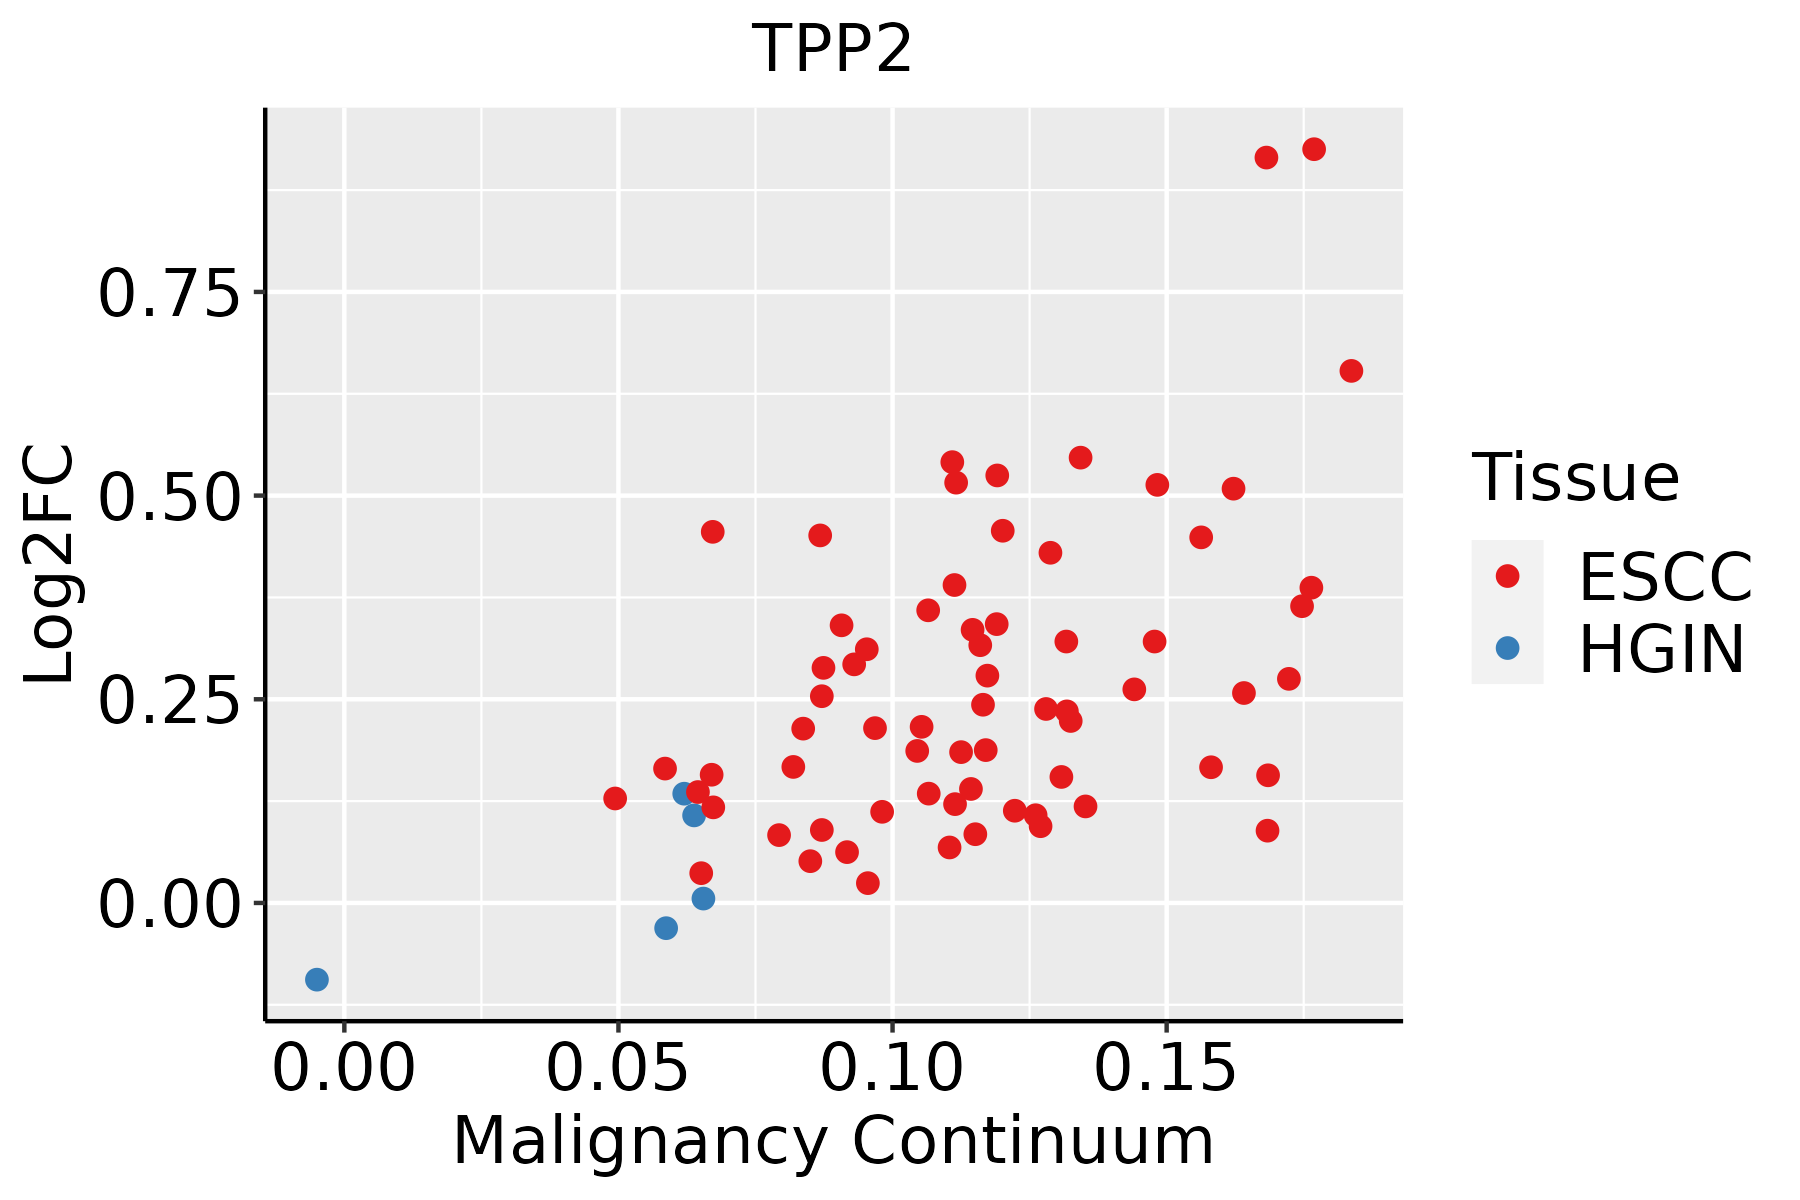 | ESCC: Esophageal squamous cell carcinoma |
| HGIN: High-grade intraepithelial neoplasias | ||
| LGIN: Low-grade intraepithelial neoplasias | ||
| Liver | 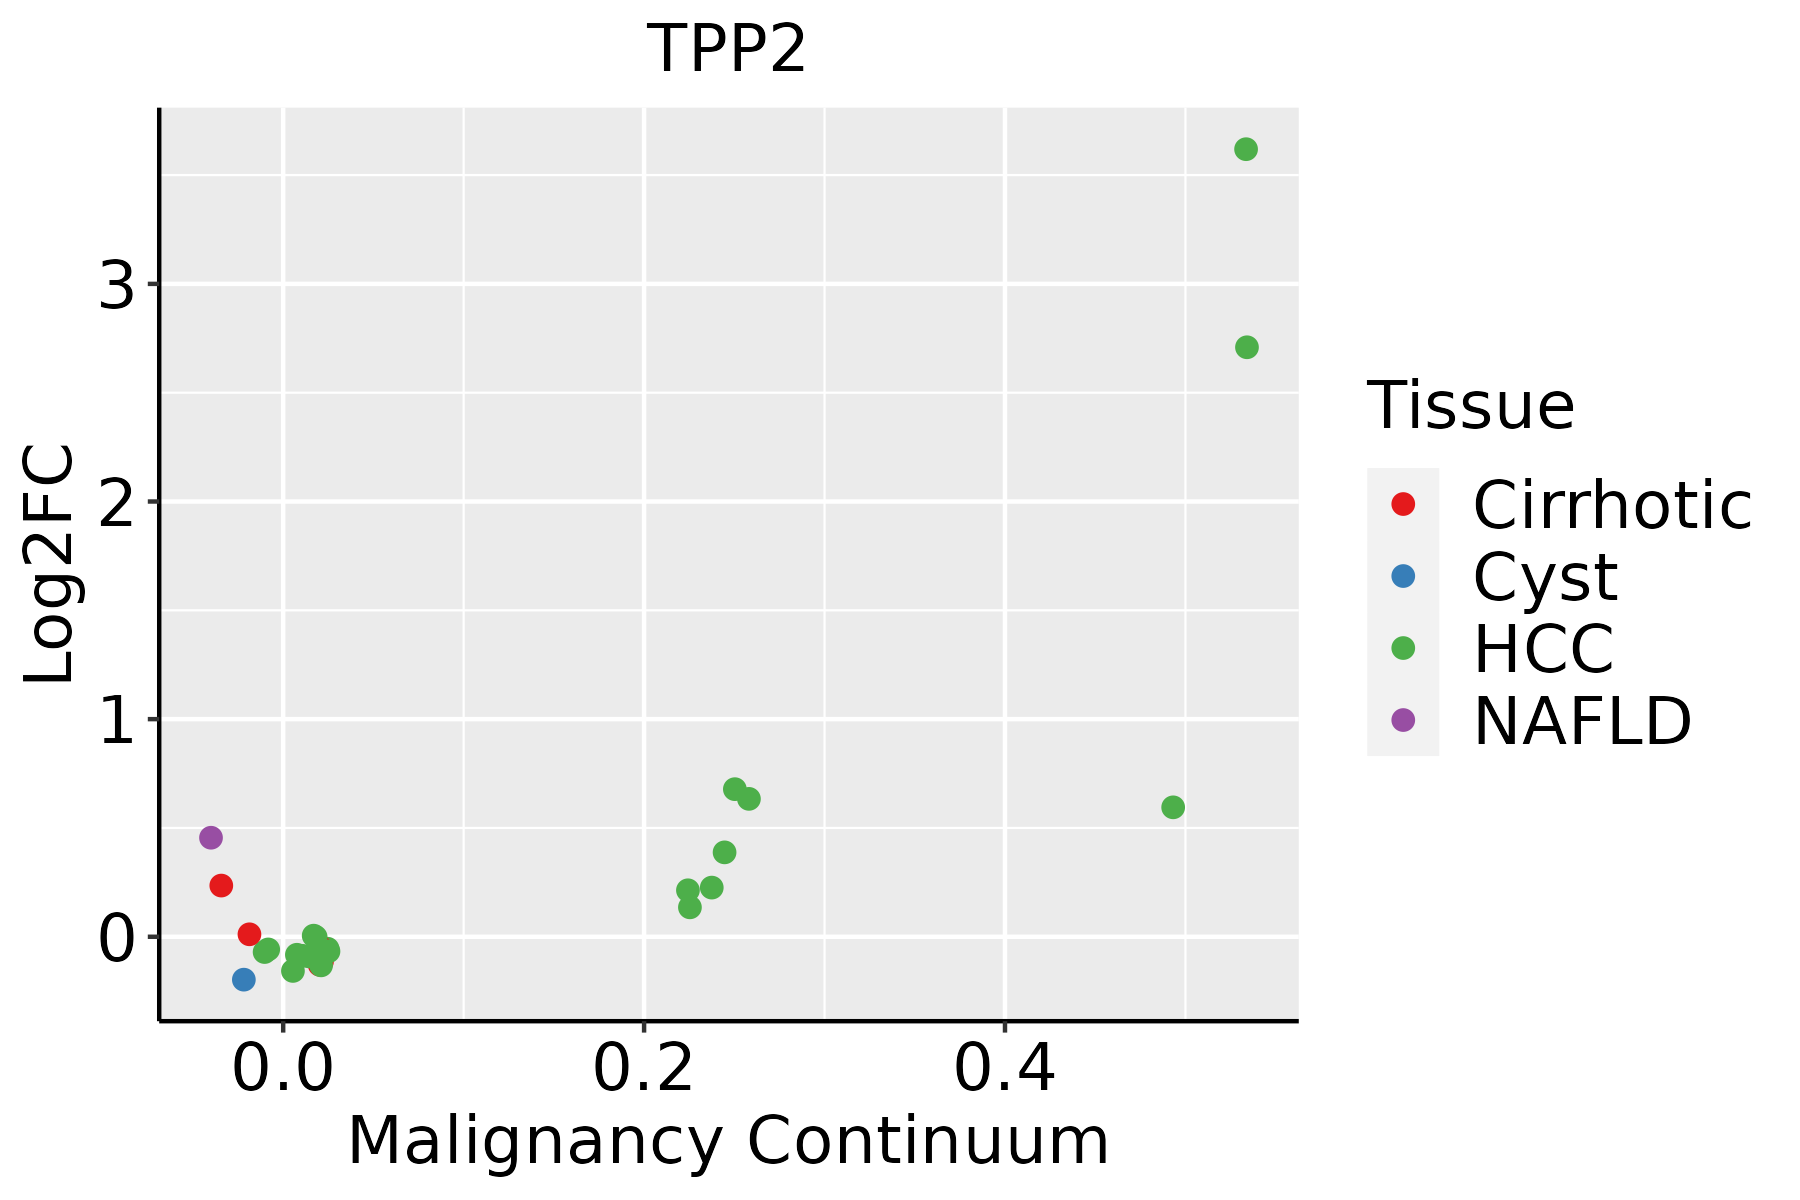 | HCC: Hepatocellular carcinoma |
| NAFLD: Non-alcoholic fatty liver disease | ||
| Lung |  | AAH: Atypical adenomatous hyperplasia |
| AIS: Adenocarcinoma in situ | ||
| IAC: Invasive lung adenocarcinoma | ||
| MIA: Minimally invasive adenocarcinoma | ||
| Oral Cavity |  | EOLP: Erosive Oral lichen planus |
| LP: leukoplakia | ||
| NEOLP: Non-erosive oral lichen planus | ||
| OSCC: Oral squamous cell carcinoma | ||
| Prostate |  | BPH: Benign Prostatic Hyperplasia |
| Thyroid |  | ATC: Anaplastic thyroid cancer |
| HT: Hashimoto's thyroiditis | ||
| PTC: Papillary thyroid cancer |
| ∗log2FC in expression of this searched gene in stem-like cells from each diseased tissue sample relative to stem-like cells in normal samples in each tissue plotted against the malignancy continuum. Samples are colored based on if they are from different disease stage. |
Top |
Malignant transformation related pathway analysis |
| Find out the enriched GO biological processes and KEGG pathways involved in transition from healthy to precancer to cancer |
| Tissue | Disease Stage | Enriched GO biological Processes |
| Colorectum | AD |  |
| Colorectum | SER |  |
| Colorectum | MSS |  |
| Colorectum | MSI-H |  |
| Colorectum | FAP |  |
| ∗Top 15 enriched GO BP terms are showed in the bar plot of each disease state in each tissue. Each row represents a significant GO biological process which is colored according to the -log10(p.adjust). |
| Page: 1 2 3 4 5 6 7 8 9 |
| GO ID | Tissue | Disease Stage | Description | Gene Ratio | Bg Ratio | pvalue | p.adjust | Count |
| GO:0000209 | Colorectum | AD | protein polyubiquitination | 78/3918 | 236/18723 | 8.71e-06 | 2.06e-04 | 78 |
| GO:00002091 | Colorectum | SER | protein polyubiquitination | 58/2897 | 236/18723 | 1.69e-04 | 3.18e-03 | 58 |
| GO:00002092 | Colorectum | MSS | protein polyubiquitination | 72/3467 | 236/18723 | 5.19e-06 | 1.42e-04 | 72 |
| GO:00002093 | Colorectum | FAP | protein polyubiquitination | 59/2622 | 236/18723 | 4.53e-06 | 1.52e-04 | 59 |
| GO:00002094 | Colorectum | CRC | protein polyubiquitination | 46/2078 | 236/18723 | 9.91e-05 | 1.98e-03 | 46 |
| GO:000020917 | Esophagus | ESCC | protein polyubiquitination | 170/8552 | 236/18723 | 1.40e-16 | 1.09e-14 | 170 |
| GO:00002095 | Liver | NAFLD | protein polyubiquitination | 51/1882 | 236/18723 | 1.04e-07 | 8.10e-06 | 51 |
| GO:000020921 | Liver | HCC | protein polyubiquitination | 151/7958 | 236/18723 | 1.90e-11 | 7.59e-10 | 151 |
| GO:00002096 | Lung | IAC | protein polyubiquitination | 49/2061 | 236/18723 | 8.51e-06 | 2.89e-04 | 49 |
| GO:000020912 | Lung | AIS | protein polyubiquitination | 49/1849 | 236/18723 | 3.85e-07 | 3.16e-05 | 49 |
| GO:000020910 | Oral cavity | OSCC | protein polyubiquitination | 150/7305 | 236/18723 | 1.59e-14 | 9.27e-13 | 150 |
| GO:000020923 | Oral cavity | EOLP | protein polyubiquitination | 62/2218 | 236/18723 | 7.88e-10 | 5.90e-08 | 62 |
| GO:00002099 | Prostate | BPH | protein polyubiquitination | 64/3107 | 236/18723 | 2.83e-05 | 3.31e-04 | 64 |
| GO:000020914 | Prostate | Tumor | protein polyubiquitination | 64/3246 | 236/18723 | 1.08e-04 | 1.03e-03 | 64 |
| GO:000020920 | Thyroid | PTC | protein polyubiquitination | 128/5968 | 236/18723 | 7.81e-13 | 3.65e-11 | 128 |
| GO:0000209110 | Thyroid | ATC | protein polyubiquitination | 134/6293 | 236/18723 | 1.86e-13 | 9.20e-12 | 134 |
| Page: 1 |
| Pathway ID | Tissue | Disease Stage | Description | Gene Ratio | Bg Ratio | pvalue | p.adjust | qvalue | Count |
| Page: 1 |
Top |
Cell-cell communication analysis |
| Identification of potential cell-cell interactions between two cell types and their ligand-receptor pairs for different disease states |
| Ligand | Receptor | LRpair | Pathway | Tissue | Disease Stage |
| Page: 1 |
Top |
Single-cell gene regulatory network inference analysis |
| Find out the significant the regulons (TFs) and the target genes of each regulon across cell types for different disease states |
| TF | Cell Type | Tissue | Disease Stage | Target Gene | RSS | Regulon Activity |
| ∗The dot plots of a searched regulon are shown for all cell subpopulations in each disease state of each tissue based on the regulon specific score inferred using pySCENIC and by calculating the average expression. |
| Page: 1 |
Top |
Somatic mutation of malignant transformation related genes |
| Annotation of somatic variants for genes involved in malignant transformation |
| Hugo Symbol | Variant Class | Variant Classification | dbSNP RS | HGVSc | HGVSp | HGVSp Short | SWISSPROT | BIOTYPE | SIFT | PolyPhen | Tumor Sample Barcode | Tissue | Histology | Sex | Age | Stage | Therapy Types | Drugs | Outcome |
| TPP2 | SNV | Missense_Mutation | c.3138N>A | p.Met1046Ile | p.M1046I | protein_coding | tolerated(0.87) | benign(0.027) | TCGA-AN-A03Y-01 | Breast | breast invasive carcinoma | Female | >=65 | I/II | Unknown | Unknown | SD | ||
| TPP2 | SNV | Missense_Mutation | novel | c.2252N>A | p.Ser751Tyr | p.S751Y | protein_coding | tolerated(0.06) | possibly_damaging(0.556) | TCGA-AN-A046-01 | Breast | breast invasive carcinoma | Female | >=65 | I/II | Unknown | Unknown | SD | |
| TPP2 | SNV | Missense_Mutation | novel | c.806N>T | p.Ala269Val | p.A269V | protein_coding | deleterious(0) | possibly_damaging(0.831) | TCGA-AR-A5QQ-01 | Breast | breast invasive carcinoma | Female | >=65 | III/IV | Chemotherapy | carboplatin | PD | |
| TPP2 | SNV | Missense_Mutation | c.1423G>T | p.Val475Phe | p.V475F | protein_coding | deleterious(0.04) | possibly_damaging(0.77) | TCGA-C8-A12T-01 | Breast | breast invasive carcinoma | Female | <65 | I/II | Unknown | Unknown | SD | ||
| TPP2 | SNV | Missense_Mutation | c.1076G>A | p.Ser359Asn | p.S359N | protein_coding | deleterious(0) | possibly_damaging(0.875) | TCGA-EW-A1PB-01 | Breast | breast invasive carcinoma | Female | >=65 | III/IV | Unknown | Unknown | SD | ||
| TPP2 | SNV | Missense_Mutation | novel | c.1039G>A | p.Glu347Lys | p.E347K | protein_coding | deleterious(0) | possibly_damaging(0.492) | TCGA-EW-A6SD-01 | Breast | breast invasive carcinoma | Female | <65 | I/II | Chemotherapy | tch | SD | |
| TPP2 | SNV | Missense_Mutation | c.2581N>A | p.Asp861Asn | p.D861N | protein_coding | tolerated(0.11) | possibly_damaging(0.571) | TCGA-GM-A2D9-01 | Breast | breast invasive carcinoma | Female | >=65 | I/II | Hormone Therapy | arimidex | SD | ||
| TPP2 | insertion | Nonsense_Mutation | novel | c.1289_1290insAAATTAATAAAGAG | p.Ile431AsnfsTer2 | p.I431Nfs*2 | protein_coding | TCGA-A8-A06P-01 | Breast | breast invasive carcinoma | Female | <65 | III/IV | Unspecific | SD | ||||
| TPP2 | insertion | Nonsense_Mutation | novel | c.1291_1292insATAAGTAGTCAGAATTCATGACTCT | p.Ile431AsnfsTer3 | p.I431Nfs*3 | protein_coding | TCGA-A8-A06P-01 | Breast | breast invasive carcinoma | Female | <65 | III/IV | Unspecific | SD | ||||
| TPP2 | insertion | Nonsense_Mutation | novel | c.3498_3499insTGTTGTCCCATGATGAAACCCTAGCCTGAACAATTCCCTC | p.Glu1167CysfsTer8 | p.E1167Cfs*8 | protein_coding | TCGA-A8-A0A2-01 | Breast | breast invasive carcinoma | Female | >=65 | I/II | Hormone Therapy | tamoxiphen | SD |
| Page: 1 2 3 4 5 6 7 8 9 10 11 12 |
Top |
Related drugs of malignant transformation related genes |
| Identification of chemicals and drugs interact with genes involved in malignant transfromation |
| (DGIdb 4.0) |
| Entrez ID | Symbol | Category | Interaction Types | Drug Claim Name | Drug Name | PMIDs |
| 7174 | TPP2 | ENZYME, PROTEASE | inhibitor | 252166782 | ||
| 7174 | TPP2 | ENZYME, PROTEASE | inhibitor | 252166783 |
| Page: 1 |

Copyright 2023-Present -The University of Texas Health Science Center at Houston |