
|
|||||
|
 | |
| |
| |
| |
| |
| |
|
Gene: TPMT |
Gene summary for TPMT |
| Gene information | Species | Human | Gene symbol | TPMT | Gene ID | 7172 |
| Gene name | thiopurine S-methyltransferase | |
| Gene Alias | TPMTD | |
| Cytomap | 6p22.3 | |
| Gene Type | protein-coding | GO ID | GO:0006139 | UniProtAcc | A0A024QZW0 |
Top |
Malignant transformation analysis |
| Identification of the aberrant gene expression in precancerous and cancerous lesions by comparing the gene expression of stem-like cells in diseased tissues with normal stem cells |
| Entrez ID | Symbol | Replicates | Species | Organ | Tissue | Adj P-value | Log2FC | Malignancy |
| 7172 | TPMT | HTA11_2487_2000001011 | Human | Colorectum | SER | 9.59e-04 | 3.98e-01 | -0.1808 |
| 7172 | TPMT | HTA11_1938_2000001011 | Human | Colorectum | AD | 1.53e-06 | 4.59e-01 | -0.0811 |
| 7172 | TPMT | HTA11_347_2000001011 | Human | Colorectum | AD | 1.68e-14 | 4.96e-01 | -0.1954 |
| 7172 | TPMT | HTA11_411_2000001011 | Human | Colorectum | SER | 8.33e-03 | 7.86e-01 | -0.2602 |
| 7172 | TPMT | HTA11_83_2000001011 | Human | Colorectum | SER | 2.82e-02 | 3.63e-01 | -0.1526 |
| 7172 | TPMT | HTA11_696_2000001011 | Human | Colorectum | AD | 1.19e-10 | 4.19e-01 | -0.1464 |
| 7172 | TPMT | HTA11_1391_2000001011 | Human | Colorectum | AD | 1.13e-06 | 4.44e-01 | -0.059 |
| 7172 | TPMT | HTA11_7696_3000711011 | Human | Colorectum | AD | 5.01e-03 | 1.28e-01 | 0.0674 |
| 7172 | TPMT | A015-C-006 | Human | Colorectum | FAP | 2.92e-02 | -1.91e-01 | -0.0994 |
| 7172 | TPMT | A015-C-104 | Human | Colorectum | FAP | 3.60e-02 | -1.57e-01 | -0.1899 |
| 7172 | TPMT | F034 | Human | Colorectum | FAP | 4.58e-02 | -1.26e-01 | -0.0665 |
| 7172 | TPMT | LZE4T | Human | Esophagus | ESCC | 6.40e-08 | 2.20e-01 | 0.0811 |
| 7172 | TPMT | LZE7T | Human | Esophagus | ESCC | 1.60e-05 | 3.14e-01 | 0.0667 |
| 7172 | TPMT | LZE8T | Human | Esophagus | ESCC | 5.85e-03 | 9.81e-02 | 0.067 |
| 7172 | TPMT | LZE20T | Human | Esophagus | ESCC | 1.12e-05 | 1.06e-01 | 0.0662 |
| 7172 | TPMT | LZE24D1 | Human | Esophagus | HGIN | 2.83e-03 | 5.16e-01 | 0.054 |
| 7172 | TPMT | LZE24T | Human | Esophagus | ESCC | 9.58e-10 | 2.73e-01 | 0.0596 |
| 7172 | TPMT | LZE6T | Human | Esophagus | ESCC | 2.46e-06 | 2.57e-01 | 0.0845 |
| 7172 | TPMT | P1T-E | Human | Esophagus | ESCC | 4.15e-02 | 1.72e-01 | 0.0875 |
| 7172 | TPMT | P2T-E | Human | Esophagus | ESCC | 1.49e-18 | 3.28e-01 | 0.1177 |
| Page: 1 2 3 4 5 6 7 |
| Tissue | Expression Dynamics | Abbreviation |
| Colorectum (GSE201348) |  | FAP: Familial adenomatous polyposis |
| CRC: Colorectal cancer | ||
| Colorectum (HTA11) |  | AD: Adenomas |
| SER: Sessile serrated lesions | ||
| MSI-H: Microsatellite-high colorectal cancer | ||
| MSS: Microsatellite stable colorectal cancer | ||
| Esophagus | 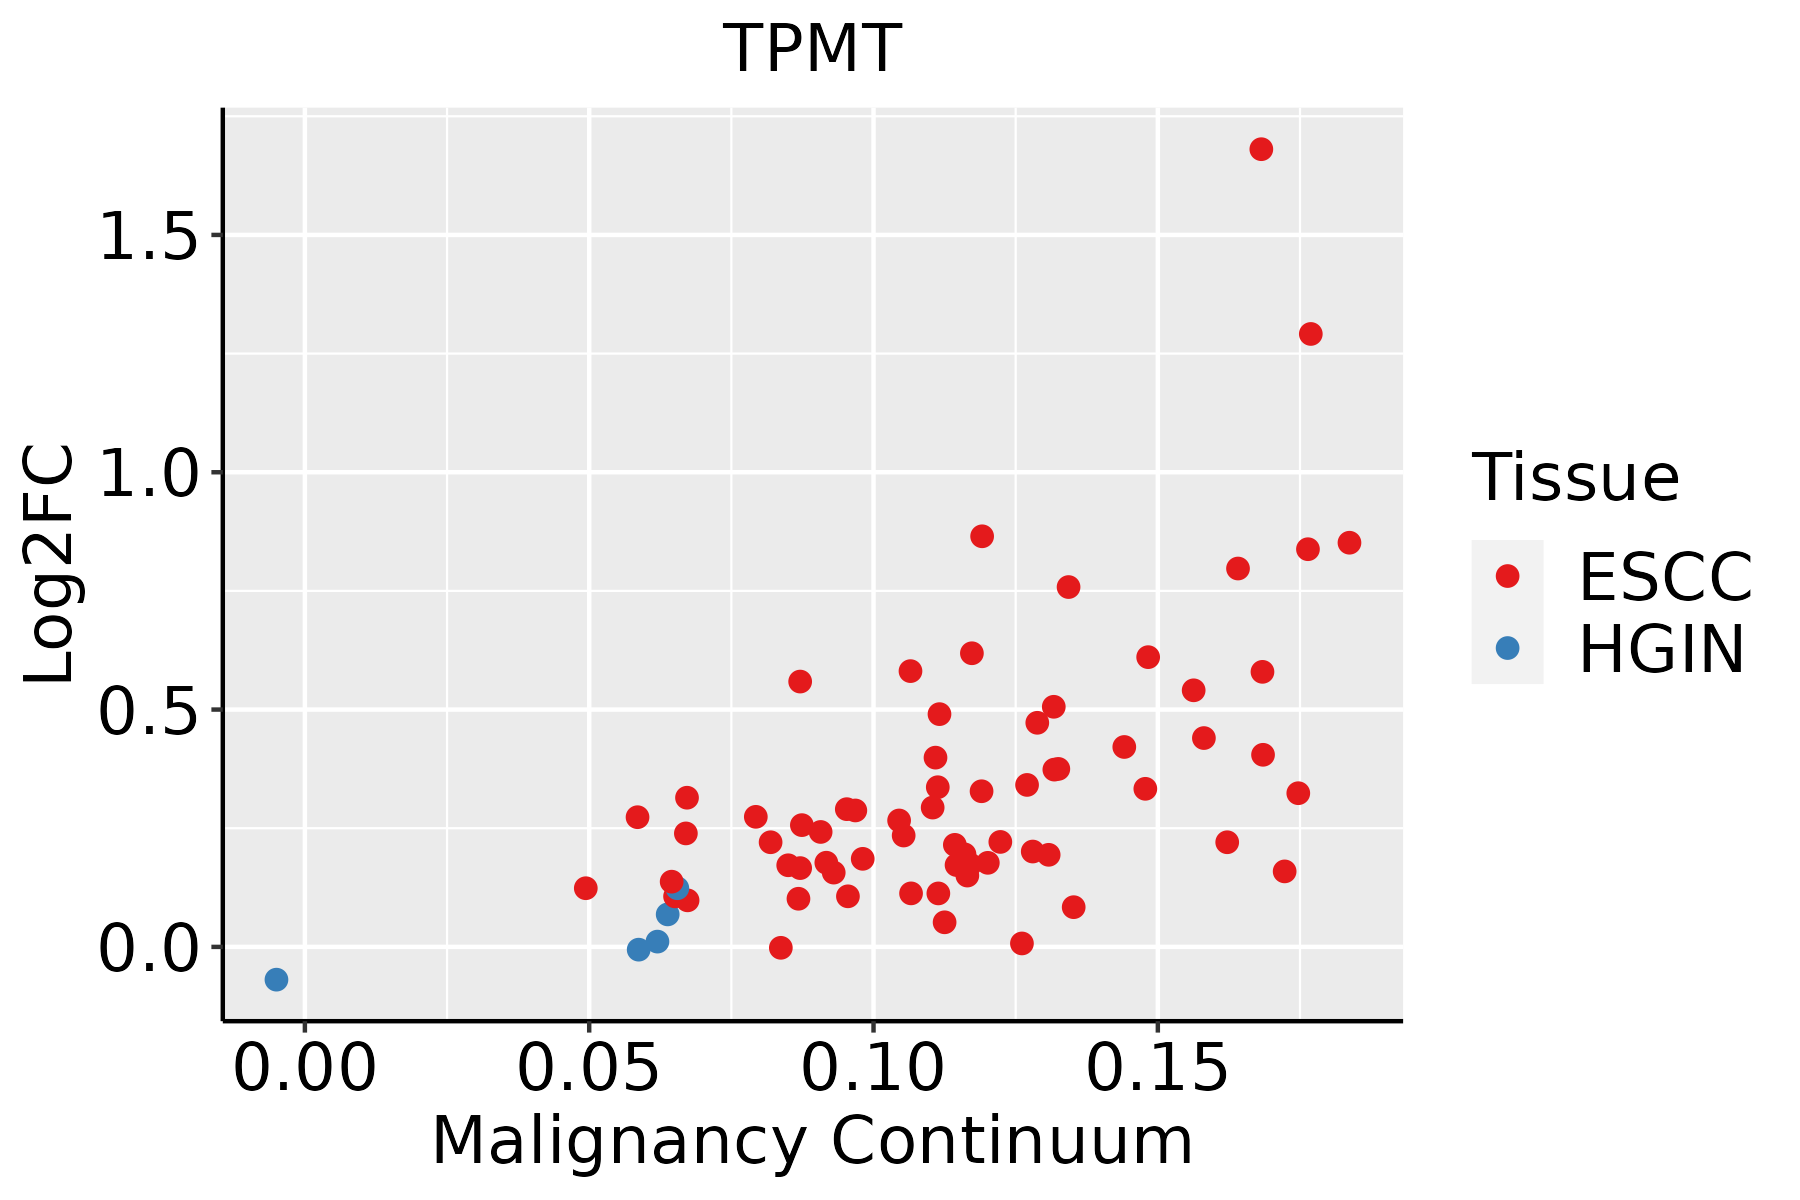 | ESCC: Esophageal squamous cell carcinoma |
| HGIN: High-grade intraepithelial neoplasias | ||
| LGIN: Low-grade intraepithelial neoplasias | ||
| Liver | 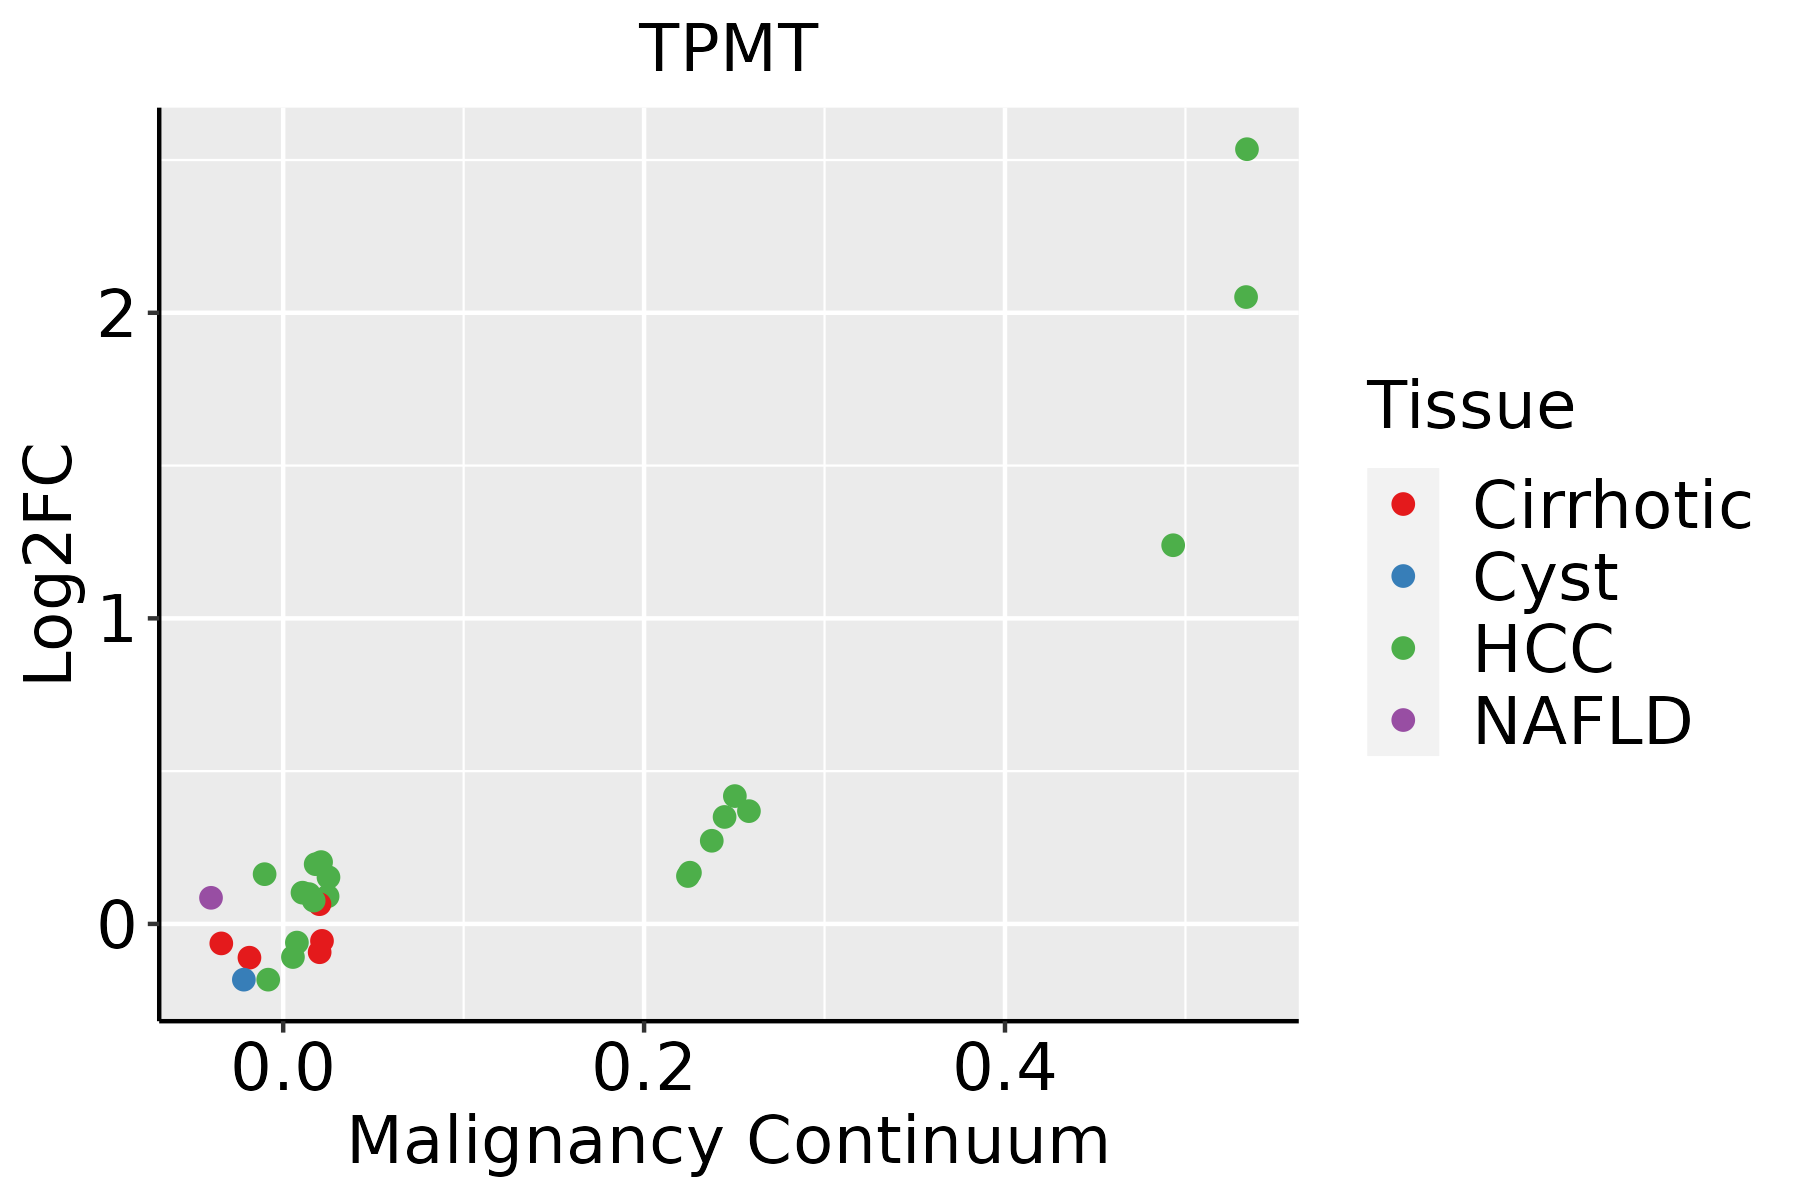 | HCC: Hepatocellular carcinoma |
| NAFLD: Non-alcoholic fatty liver disease | ||
| Oral Cavity | 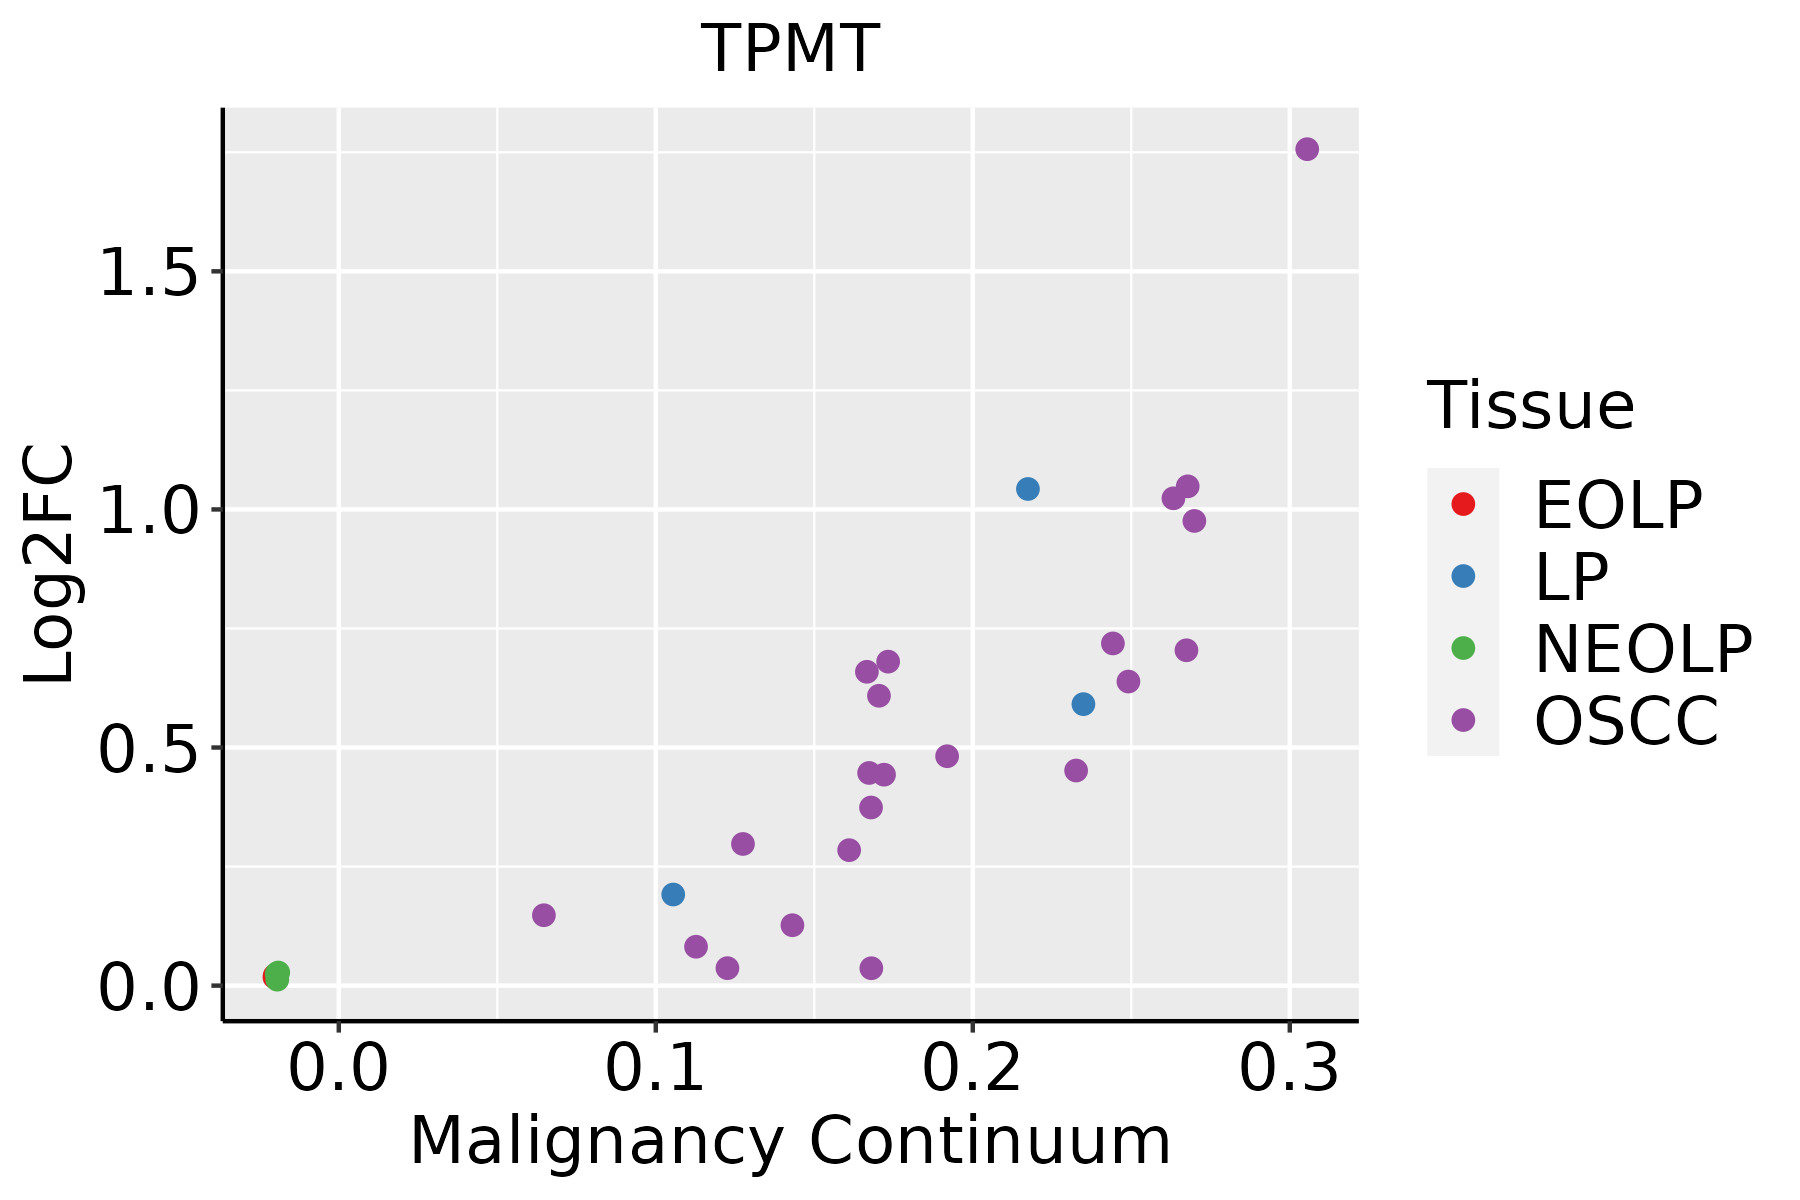 | EOLP: Erosive Oral lichen planus |
| LP: leukoplakia | ||
| NEOLP: Non-erosive oral lichen planus | ||
| OSCC: Oral squamous cell carcinoma | ||
| Skin | 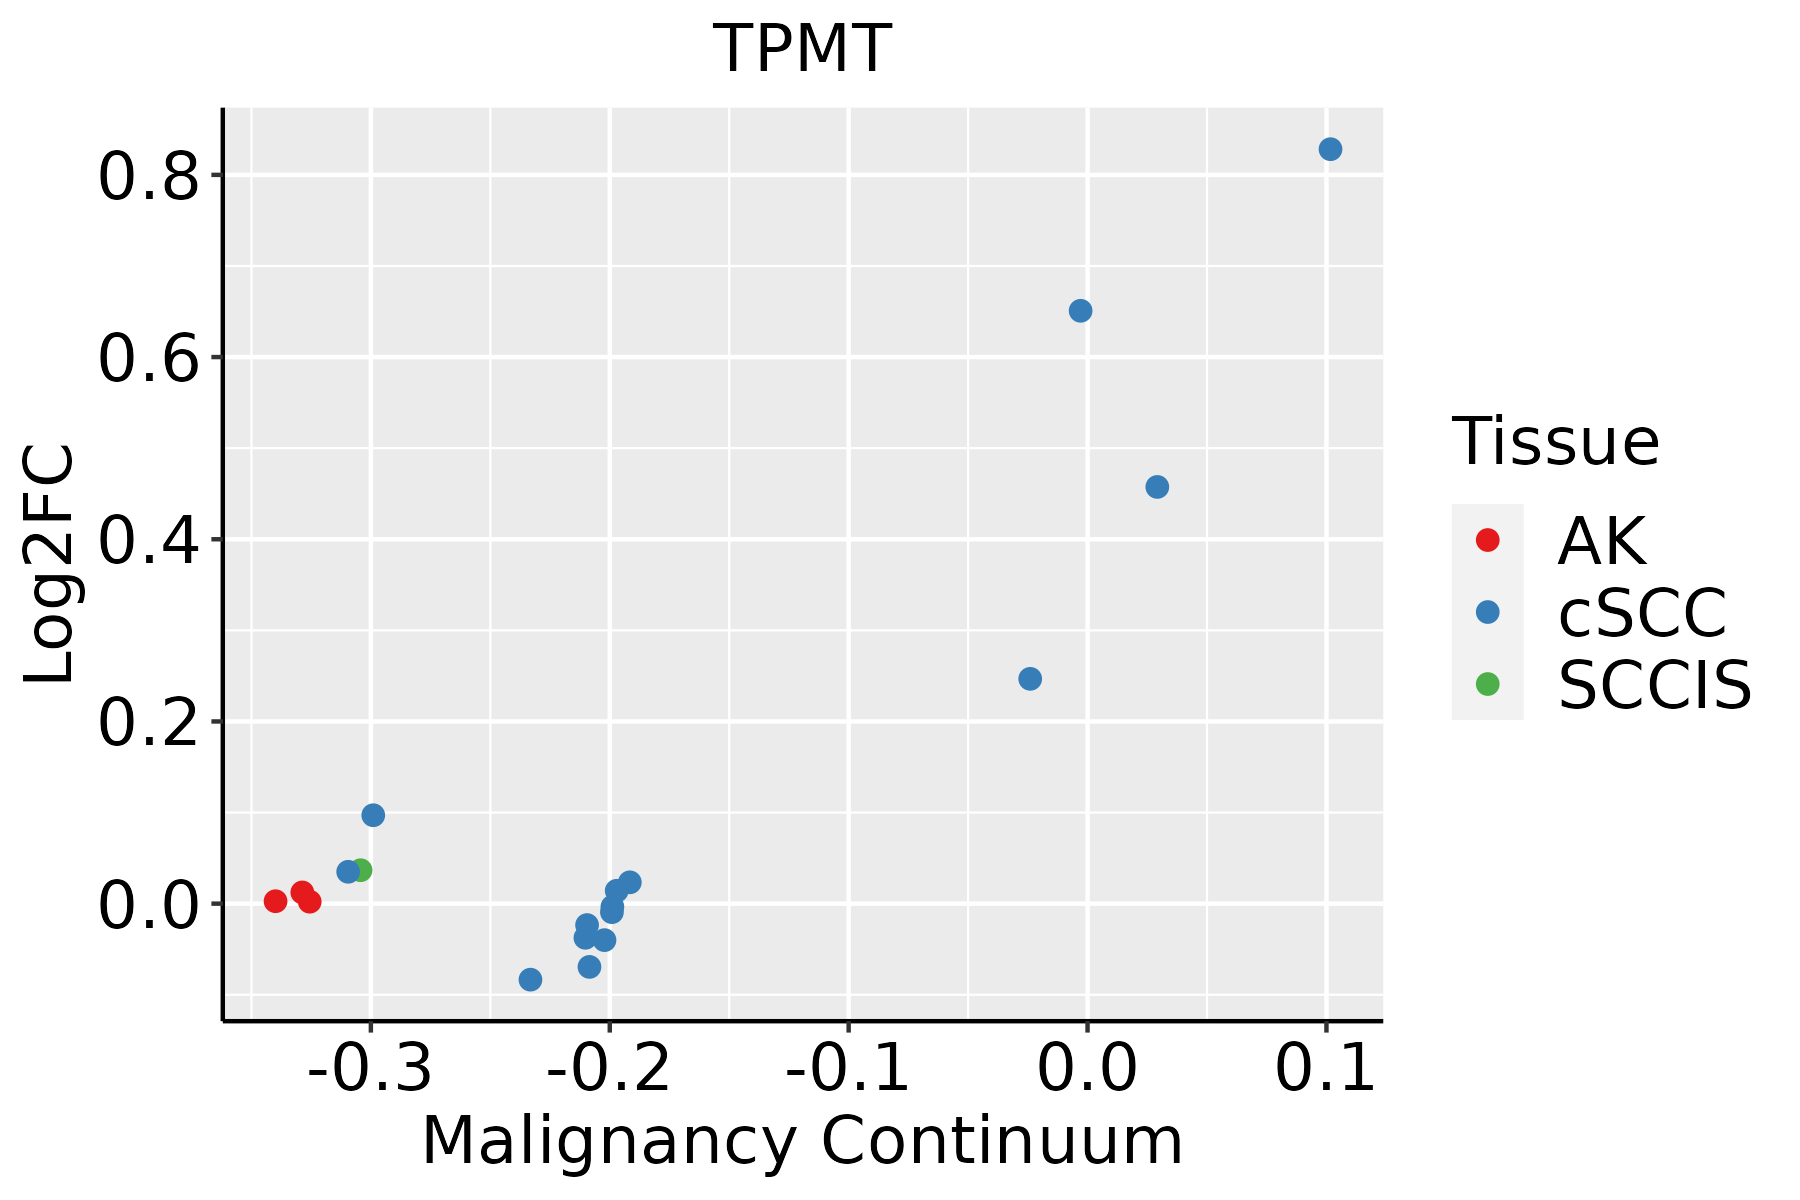 | AK: Actinic keratosis |
| cSCC: Cutaneous squamous cell carcinoma | ||
| SCCIS:squamous cell carcinoma in situ | ||
| Thyroid |  | ATC: Anaplastic thyroid cancer |
| HT: Hashimoto's thyroiditis | ||
| PTC: Papillary thyroid cancer |
| ∗log2FC in expression of this searched gene in stem-like cells from each diseased tissue sample relative to stem-like cells in normal samples in each tissue plotted against the malignancy continuum. Samples are colored based on if they are from different disease stage. |
Top |
Malignant transformation related pathway analysis |
| Find out the enriched GO biological processes and KEGG pathways involved in transition from healthy to precancer to cancer |
| Tissue | Disease Stage | Enriched GO biological Processes |
| Colorectum | AD |  |
| Colorectum | SER |  |
| Colorectum | MSS |  |
| Colorectum | MSI-H |  |
| Colorectum | FAP |  |
| ∗Top 15 enriched GO BP terms are showed in the bar plot of each disease state in each tissue. Each row represents a significant GO biological process which is colored according to the -log10(p.adjust). |
| Page: 1 2 3 4 5 6 7 8 9 |
| GO ID | Tissue | Disease Stage | Description | Gene Ratio | Bg Ratio | pvalue | p.adjust | Count |
| GO:0009410 | Colorectum | AD | response to xenobiotic stimulus | 128/3918 | 462/18723 | 2.69e-04 | 3.31e-03 | 128 |
| GO:00094102 | Colorectum | FAP | response to xenobiotic stimulus | 87/2622 | 462/18723 | 2.15e-03 | 1.77e-02 | 87 |
| GO:0097193111 | Esophagus | ESCC | intrinsic apoptotic signaling pathway | 222/8552 | 288/18723 | 5.87e-28 | 2.02e-25 | 222 |
| GO:2001233111 | Esophagus | ESCC | regulation of apoptotic signaling pathway | 256/8552 | 356/18723 | 4.11e-24 | 1.04e-21 | 256 |
| GO:2001242111 | Esophagus | ESCC | regulation of intrinsic apoptotic signaling pathway | 128/8552 | 164/18723 | 1.75e-17 | 1.50e-15 | 128 |
| GO:001631110 | Esophagus | ESCC | dephosphorylation | 251/8552 | 417/18723 | 1.26e-09 | 2.99e-08 | 251 |
| GO:00322592 | Esophagus | ESCC | methylation | 222/8552 | 364/18723 | 2.26e-09 | 5.09e-08 | 222 |
| GO:00086544 | Esophagus | ESCC | phospholipid biosynthetic process | 162/8552 | 253/18723 | 2.59e-09 | 5.73e-08 | 162 |
| GO:000647018 | Esophagus | ESCC | protein dephosphorylation | 177/8552 | 281/18723 | 3.13e-09 | 6.72e-08 | 177 |
| GO:00464744 | Esophagus | ESCC | glycerophospholipid biosynthetic process | 135/8552 | 211/18723 | 5.75e-08 | 1.02e-06 | 135 |
| GO:00450175 | Esophagus | ESCC | glycerolipid biosynthetic process | 154/8552 | 252/18723 | 5.20e-07 | 6.96e-06 | 154 |
| GO:00066446 | Esophagus | ESCC | phospholipid metabolic process | 218/8552 | 383/18723 | 5.37e-06 | 5.59e-05 | 218 |
| GO:000941020 | Esophagus | ESCC | response to xenobiotic stimulus | 253/8552 | 462/18723 | 4.55e-05 | 3.58e-04 | 253 |
| GO:00066505 | Esophagus | ESCC | glycerophospholipid metabolic process | 174/8552 | 306/18723 | 4.92e-05 | 3.85e-04 | 174 |
| GO:00464864 | Esophagus | ESCC | glycerolipid metabolic process | 211/8552 | 392/18723 | 6.51e-04 | 3.46e-03 | 211 |
| GO:200123312 | Liver | Cirrhotic | regulation of apoptotic signaling pathway | 163/4634 | 356/18723 | 2.62e-18 | 4.43e-16 | 163 |
| GO:009719312 | Liver | Cirrhotic | intrinsic apoptotic signaling pathway | 130/4634 | 288/18723 | 2.69e-14 | 2.45e-12 | 130 |
| GO:20012427 | Liver | Cirrhotic | regulation of intrinsic apoptotic signaling pathway | 82/4634 | 164/18723 | 2.35e-12 | 1.71e-10 | 82 |
| GO:000941012 | Liver | Cirrhotic | response to xenobiotic stimulus | 165/4634 | 462/18723 | 6.82e-08 | 2.09e-06 | 165 |
| GO:00714661 | Liver | Cirrhotic | cellular response to xenobiotic stimulus | 66/4634 | 177/18723 | 1.34e-04 | 1.31e-03 | 66 |
| Page: 1 2 3 4 5 |
| Pathway ID | Tissue | Disease Stage | Description | Gene Ratio | Bg Ratio | pvalue | p.adjust | qvalue | Count |
| hsa00983 | Liver | Cirrhotic | Drug metabolism - other enzymes | 34/2530 | 80/8465 | 1.08e-02 | 3.57e-02 | 2.20e-02 | 34 |
| hsa009831 | Liver | Cirrhotic | Drug metabolism - other enzymes | 34/2530 | 80/8465 | 1.08e-02 | 3.57e-02 | 2.20e-02 | 34 |
| hsa009832 | Liver | HCC | Drug metabolism - other enzymes | 54/4020 | 80/8465 | 2.25e-04 | 1.09e-03 | 6.08e-04 | 54 |
| hsa009833 | Liver | HCC | Drug metabolism - other enzymes | 54/4020 | 80/8465 | 2.25e-04 | 1.09e-03 | 6.08e-04 | 54 |
| Page: 1 |
Top |
Cell-cell communication analysis |
| Identification of potential cell-cell interactions between two cell types and their ligand-receptor pairs for different disease states |
| Ligand | Receptor | LRpair | Pathway | Tissue | Disease Stage |
| Page: 1 |
Top |
Single-cell gene regulatory network inference analysis |
| Find out the significant the regulons (TFs) and the target genes of each regulon across cell types for different disease states |
| TF | Cell Type | Tissue | Disease Stage | Target Gene | RSS | Regulon Activity |
| ∗The dot plots of a searched regulon are shown for all cell subpopulations in each disease state of each tissue based on the regulon specific score inferred using pySCENIC and by calculating the average expression. |
| Page: 1 |
Top |
Somatic mutation of malignant transformation related genes |
| Annotation of somatic variants for genes involved in malignant transformation |
| Hugo Symbol | Variant Class | Variant Classification | dbSNP RS | HGVSc | HGVSp | HGVSp Short | SWISSPROT | BIOTYPE | SIFT | PolyPhen | Tumor Sample Barcode | Tissue | Histology | Sex | Age | Stage | Therapy Types | Drugs | Outcome |
| TPMT | SNV | Missense_Mutation | rs777686348 | c.211N>A | p.Gly71Arg | p.G71R | P51580 | protein_coding | deleterious(0.01) | probably_damaging(0.956) | TCGA-C8-A3M8-01 | Breast | breast invasive carcinoma | Female | >=65 | I/II | Hormone Therapy | tamoxiphen | CR |
| TPMT | SNV | Missense_Mutation | c.415N>T | p.Pro139Ser | p.P139S | P51580 | protein_coding | tolerated(1) | benign(0.007) | TCGA-GM-A2DL-01 | Breast | breast invasive carcinoma | Female | <65 | I/II | Hormone Therapy | tamoxiphen | CR | |
| TPMT | insertion | Nonsense_Mutation | novel | c.645_646insGACCTCAGGTGATCTACCCACCTCGGCCTCCCAAAGTGC | p.Arg215_Cys216insAspLeuArgTerSerThrHisLeuGlyLeuProLysCys | p.R215_C216insDLR*STHLGLPKC | P51580 | protein_coding | TCGA-A7-A0CJ-01 | Breast | breast invasive carcinoma | Female | <65 | I/II | Chemotherapy | cytoxan | SD | ||
| TPMT | SNV | Missense_Mutation | rs763689814 | c.643N>T | p.Arg215Cys | p.R215C | P51580 | protein_coding | deleterious(0.01) | possibly_damaging(0.581) | TCGA-A6-5661-01 | Colorectum | colon adenocarcinoma | Female | >=65 | I/II | Unknown | Unknown | SD |
| TPMT | SNV | Missense_Mutation | c.371N>A | p.Ser124Tyr | p.S124Y | P51580 | protein_coding | deleterious(0) | probably_damaging(0.983) | TCGA-CA-6718-01 | Colorectum | colon adenocarcinoma | Male | <65 | I/II | Unknown | Unknown | PD | |
| TPMT | SNV | Missense_Mutation | c.245G>T | p.Arg82Leu | p.R82L | P51580 | protein_coding | tolerated(0.69) | benign(0.003) | TCGA-DM-A1HB-01 | Colorectum | colon adenocarcinoma | Male | >=65 | III/IV | Unknown | Unknown | SD | |
| TPMT | SNV | Missense_Mutation | rs139392616 | c.677G>A | p.Arg226Gln | p.R226Q | P51580 | protein_coding | deleterious(0.05) | benign(0.072) | TCGA-G4-6628-01 | Colorectum | colon adenocarcinoma | Male | >=65 | I/II | Unknown | Unknown | SD |
| TPMT | SNV | Missense_Mutation | novel | c.412N>A | p.Leu138Ile | p.L138I | P51580 | protein_coding | tolerated(0.06) | benign(0.158) | TCGA-AG-A002-01 | Colorectum | rectum adenocarcinoma | Male | <65 | I/II | Unknown | Unknown | SD |
| TPMT | SNV | Missense_Mutation | c.89N>G | p.Gln30Arg | p.Q30R | P51580 | protein_coding | tolerated(0.41) | benign(0.006) | TCGA-F5-6813-01 | Colorectum | rectum adenocarcinoma | Male | >=65 | III/IV | Unknown | Unknown | PD | |
| TPMT | SNV | Missense_Mutation | rs79901429 | c.611T>C | p.Ile204Thr | p.I204T | P51580 | protein_coding | deleterious(0) | possibly_damaging(0.49) | TCGA-F5-6814-01 | Colorectum | rectum adenocarcinoma | Male | <65 | I/II | Unknown | Unknown | SD |
| Page: 1 2 3 |
Top |
Related drugs of malignant transformation related genes |
| Identification of chemicals and drugs interact with genes involved in malignant transfromation |
| (DGIdb 4.0) |
| Entrez ID | Symbol | Category | Interaction Types | Drug Claim Name | Drug Name | PMIDs |
| 7172 | TPMT | CLINICALLY ACTIONABLE, ENZYME, DRUGGABLE GENOME | prednisone | PREDNISONE | 16044099 | |
| 7172 | TPMT | CLINICALLY ACTIONABLE, ENZYME, DRUGGABLE GENOME | Cisplatin | CISPLATIN | ||
| 7172 | TPMT | CLINICALLY ACTIONABLE, ENZYME, DRUGGABLE GENOME | Azathioprine | AZATHIOPRINE | ||
| 7172 | TPMT | CLINICALLY ACTIONABLE, ENZYME, DRUGGABLE GENOME | olanzapine | OLANZAPINE | 23559402 | |
| 7172 | TPMT | CLINICALLY ACTIONABLE, ENZYME, DRUGGABLE GENOME | Mercaptopurine | MERCAPTOPURINE | ||
| 7172 | TPMT | CLINICALLY ACTIONABLE, ENZYME, DRUGGABLE GENOME | cyclophosphamide | CYCLOPHOSPHAMIDE | 24533712 | |
| 7172 | TPMT | CLINICALLY ACTIONABLE, ENZYME, DRUGGABLE GENOME | Thioguanine | THIOGUANINE | ||
| 7172 | TPMT | CLINICALLY ACTIONABLE, ENZYME, DRUGGABLE GENOME | thioguanosine triphosphate | 26332308 | ||
| 7172 | TPMT | CLINICALLY ACTIONABLE, ENZYME, DRUGGABLE GENOME | s-adenosylmethionine | ADEMETIONINE | 25303295 | |
| 7172 | TPMT | CLINICALLY ACTIONABLE, ENZYME, DRUGGABLE GENOME | thioguanosine monophosphate | 26332308 |
| Page: 1 2 |

Copyright 2023-Present -The University of Texas Health Science Center at Houston |