
|
|||||
|
 | |
| |
| |
| |
| |
| |
|
Gene: TPM4 |
Gene summary for TPM4 |
| Gene information | Species | Human | Gene symbol | TPM4 | Gene ID | 7171 |
| Gene name | tropomyosin 4 | |
| Gene Alias | HEL-S-108 | |
| Cytomap | 19p13.12-p13.11 | |
| Gene Type | protein-coding | GO ID | GO:0001503 | UniProtAcc | P67936 |
Top |
Malignant transformation analysis |
| Identification of the aberrant gene expression in precancerous and cancerous lesions by comparing the gene expression of stem-like cells in diseased tissues with normal stem cells |
| Entrez ID | Symbol | Replicates | Species | Organ | Tissue | Adj P-value | Log2FC | Malignancy |
| 7171 | TPM4 | GSM4909285 | Human | Breast | IDC | 1.09e-05 | 2.52e-01 | 0.21 |
| 7171 | TPM4 | GSM4909286 | Human | Breast | IDC | 1.27e-13 | -4.07e-01 | 0.1081 |
| 7171 | TPM4 | GSM4909287 | Human | Breast | IDC | 1.54e-14 | 4.43e-01 | 0.2057 |
| 7171 | TPM4 | GSM4909293 | Human | Breast | IDC | 9.97e-04 | -2.89e-01 | 0.1581 |
| 7171 | TPM4 | GSM4909294 | Human | Breast | IDC | 3.09e-06 | -4.12e-01 | 0.2022 |
| 7171 | TPM4 | GSM4909296 | Human | Breast | IDC | 8.78e-27 | -6.19e-01 | 0.1524 |
| 7171 | TPM4 | GSM4909297 | Human | Breast | IDC | 1.39e-21 | -5.48e-01 | 0.1517 |
| 7171 | TPM4 | GSM4909298 | Human | Breast | IDC | 1.27e-09 | -4.75e-01 | 0.1551 |
| 7171 | TPM4 | GSM4909301 | Human | Breast | IDC | 2.90e-02 | -2.55e-01 | 0.1577 |
| 7171 | TPM4 | GSM4909302 | Human | Breast | IDC | 2.06e-05 | -3.96e-01 | 0.1545 |
| 7171 | TPM4 | GSM4909304 | Human | Breast | IDC | 2.84e-11 | -4.52e-01 | 0.1636 |
| 7171 | TPM4 | GSM4909306 | Human | Breast | IDC | 1.87e-05 | -3.71e-01 | 0.1564 |
| 7171 | TPM4 | GSM4909307 | Human | Breast | IDC | 4.70e-24 | -6.59e-01 | 0.1569 |
| 7171 | TPM4 | GSM4909308 | Human | Breast | IDC | 2.35e-32 | -7.70e-01 | 0.158 |
| 7171 | TPM4 | GSM4909309 | Human | Breast | IDC | 1.06e-02 | -3.34e-01 | 0.0483 |
| 7171 | TPM4 | GSM4909311 | Human | Breast | IDC | 2.04e-39 | -5.95e-01 | 0.1534 |
| 7171 | TPM4 | GSM4909312 | Human | Breast | IDC | 8.53e-15 | -4.69e-01 | 0.1552 |
| 7171 | TPM4 | GSM4909319 | Human | Breast | IDC | 6.71e-50 | -8.07e-01 | 0.1563 |
| 7171 | TPM4 | GSM4909320 | Human | Breast | IDC | 2.15e-09 | -6.01e-01 | 0.1575 |
| 7171 | TPM4 | GSM4909321 | Human | Breast | IDC | 1.90e-20 | -4.99e-01 | 0.1559 |
| Page: 1 2 3 4 5 6 7 8 9 10 11 12 13 14 15 |
| Tissue | Expression Dynamics | Abbreviation |
| Breast | 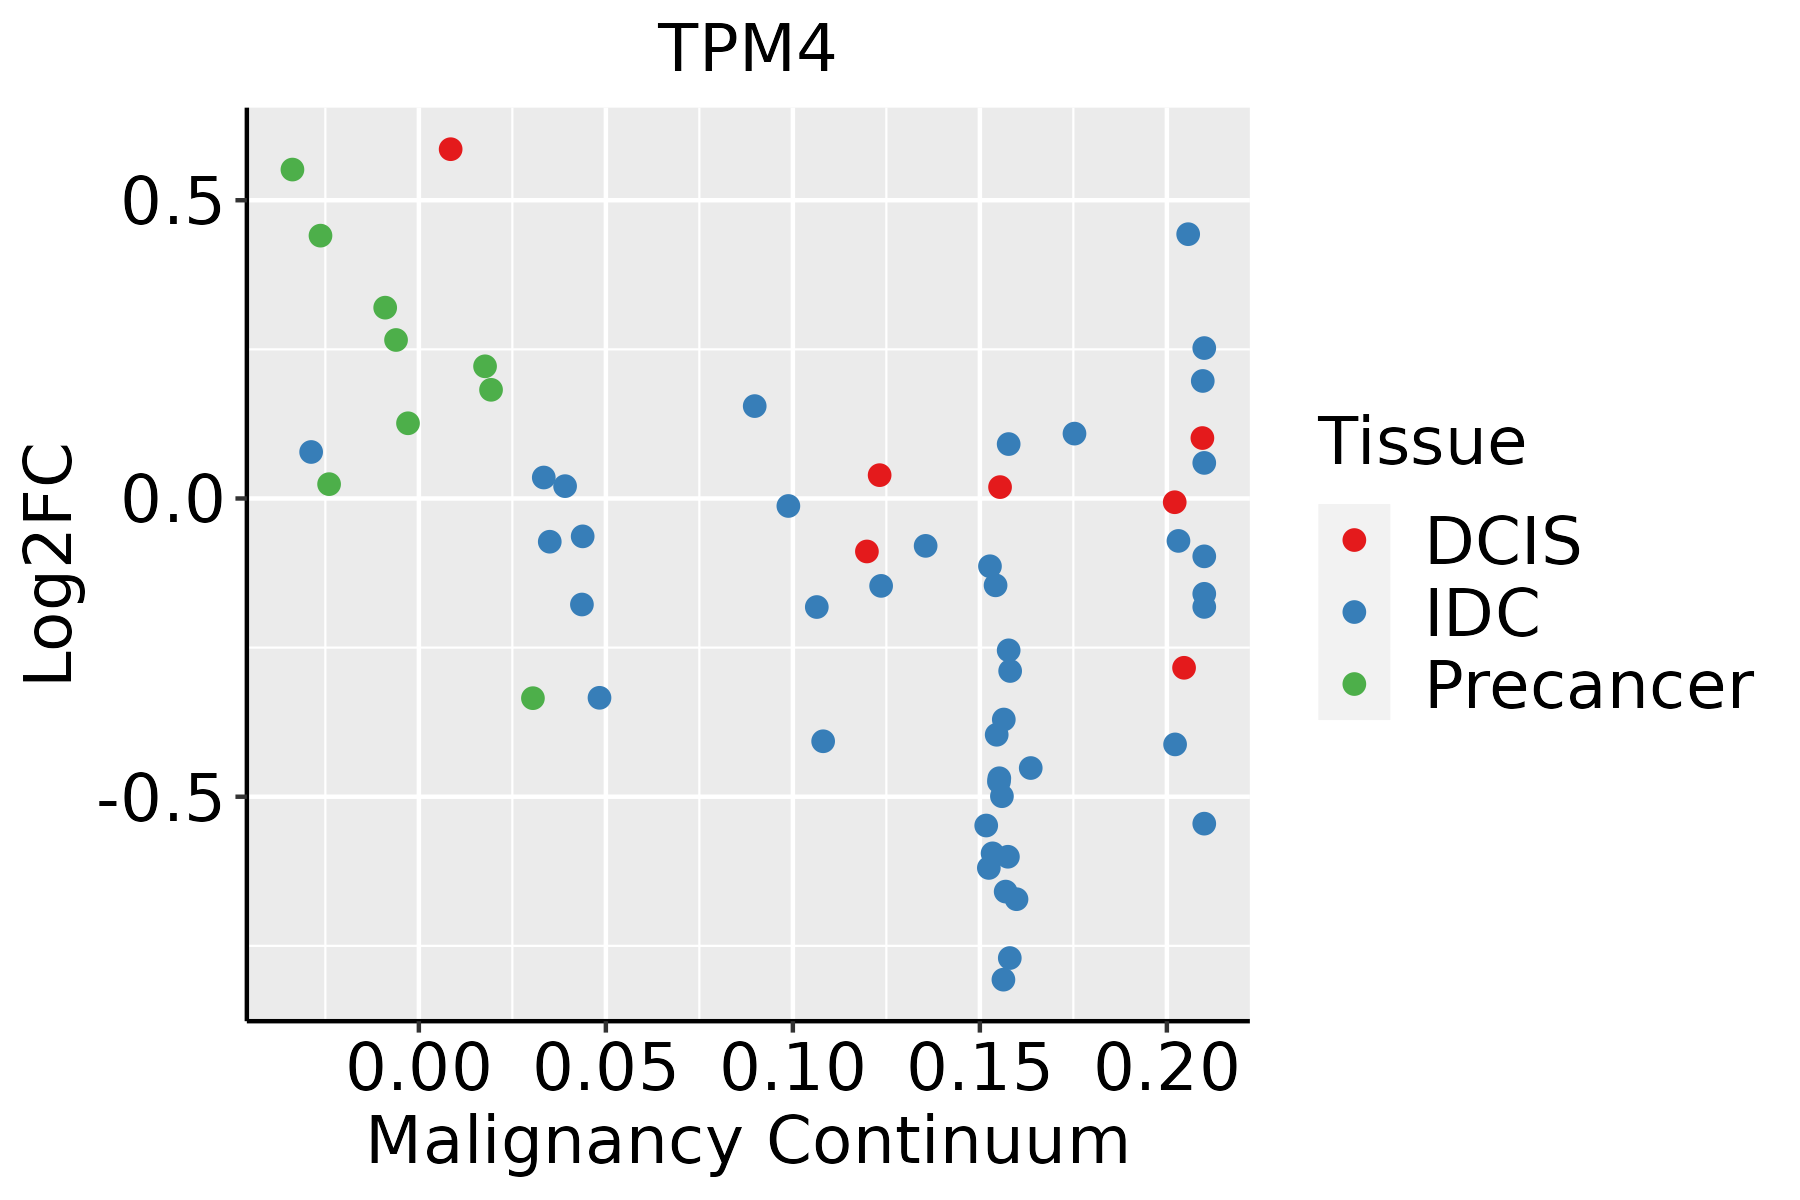 | IDC: Invasive ductal carcinoma |
| DCIS: Ductal carcinoma in situ | ||
| Precancer(BRCA1-mut): Precancerous lesion from BRCA1 mutation carriers | ||
| Cervix | 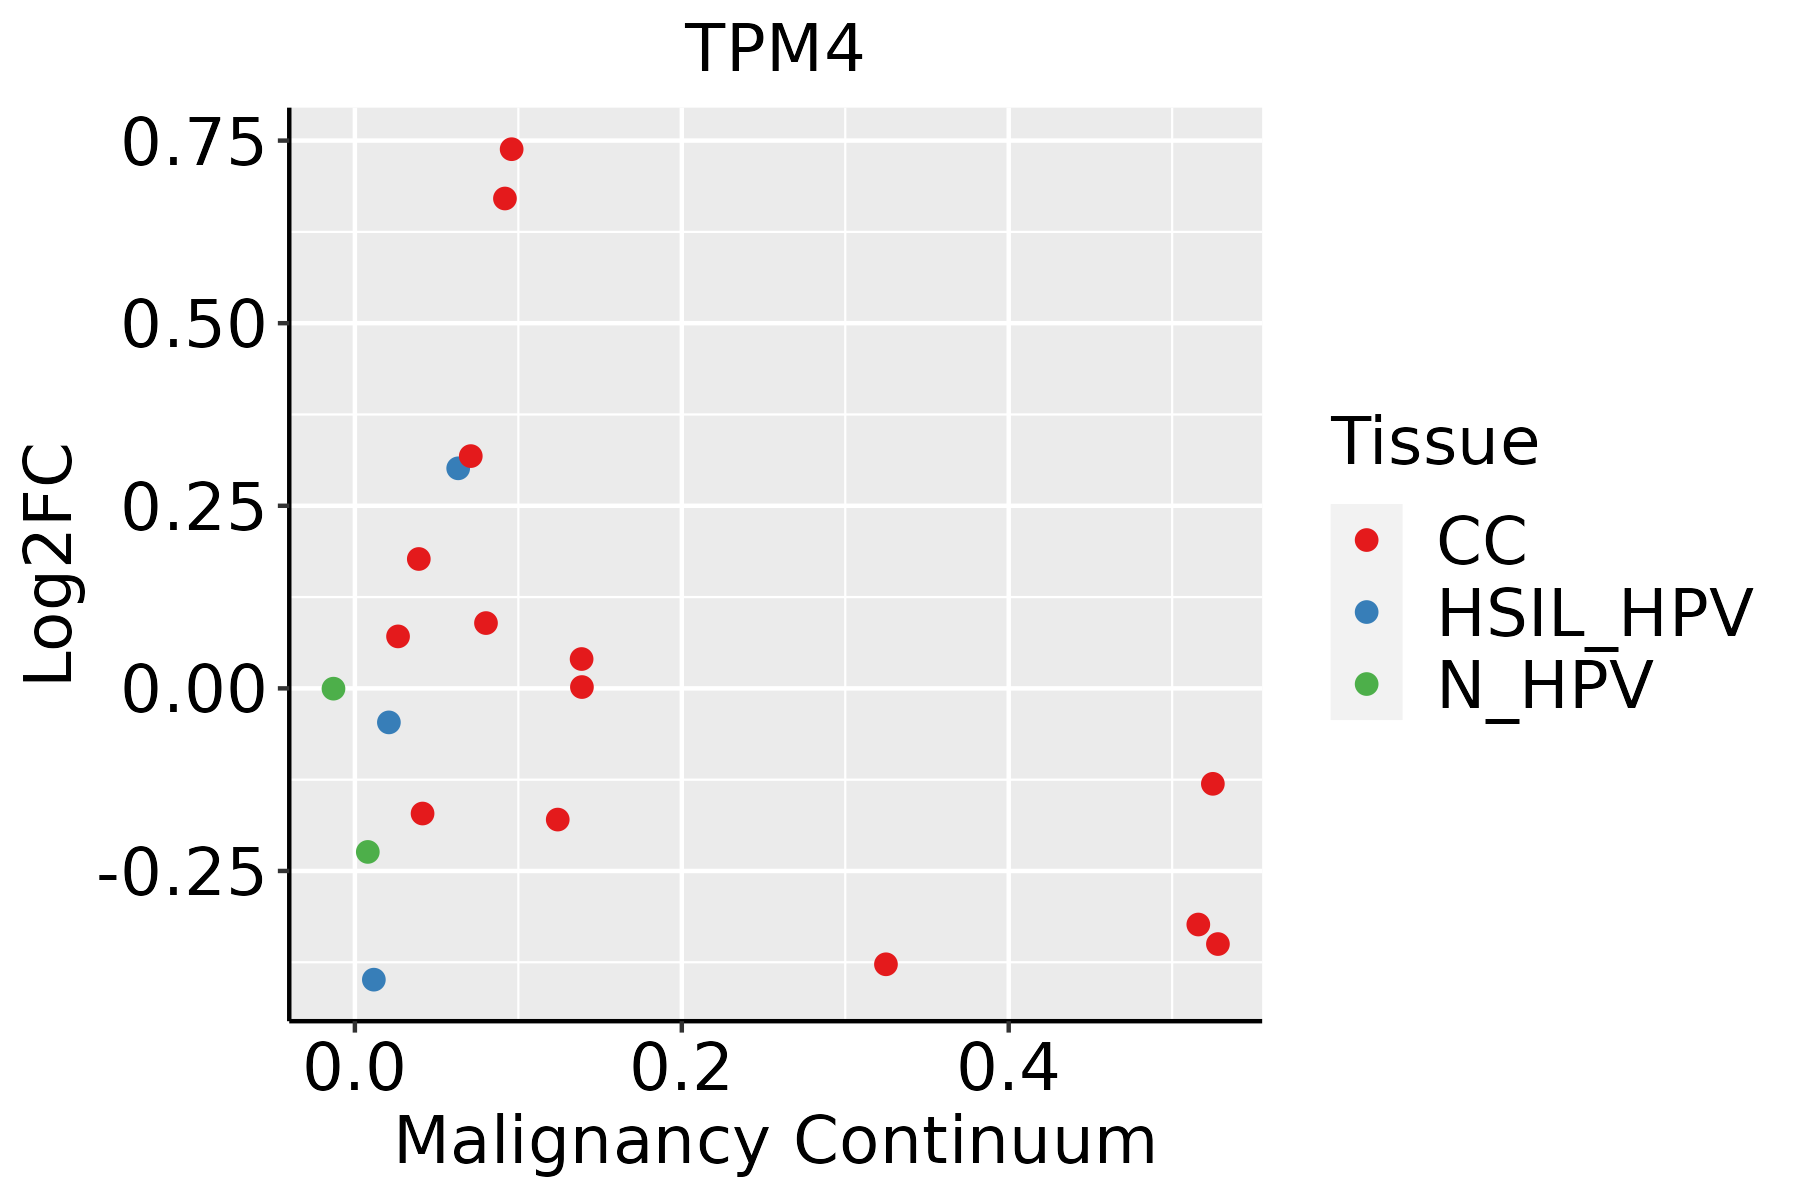 | CC: Cervix cancer |
| HSIL_HPV: HPV-infected high-grade squamous intraepithelial lesions | ||
| N_HPV: HPV-infected normal cervix | ||
| Colorectum (GSE201348) |  | FAP: Familial adenomatous polyposis |
| CRC: Colorectal cancer | ||
| Colorectum (HTA11) |  | AD: Adenomas |
| SER: Sessile serrated lesions | ||
| MSI-H: Microsatellite-high colorectal cancer | ||
| MSS: Microsatellite stable colorectal cancer | ||
| Endometrium | 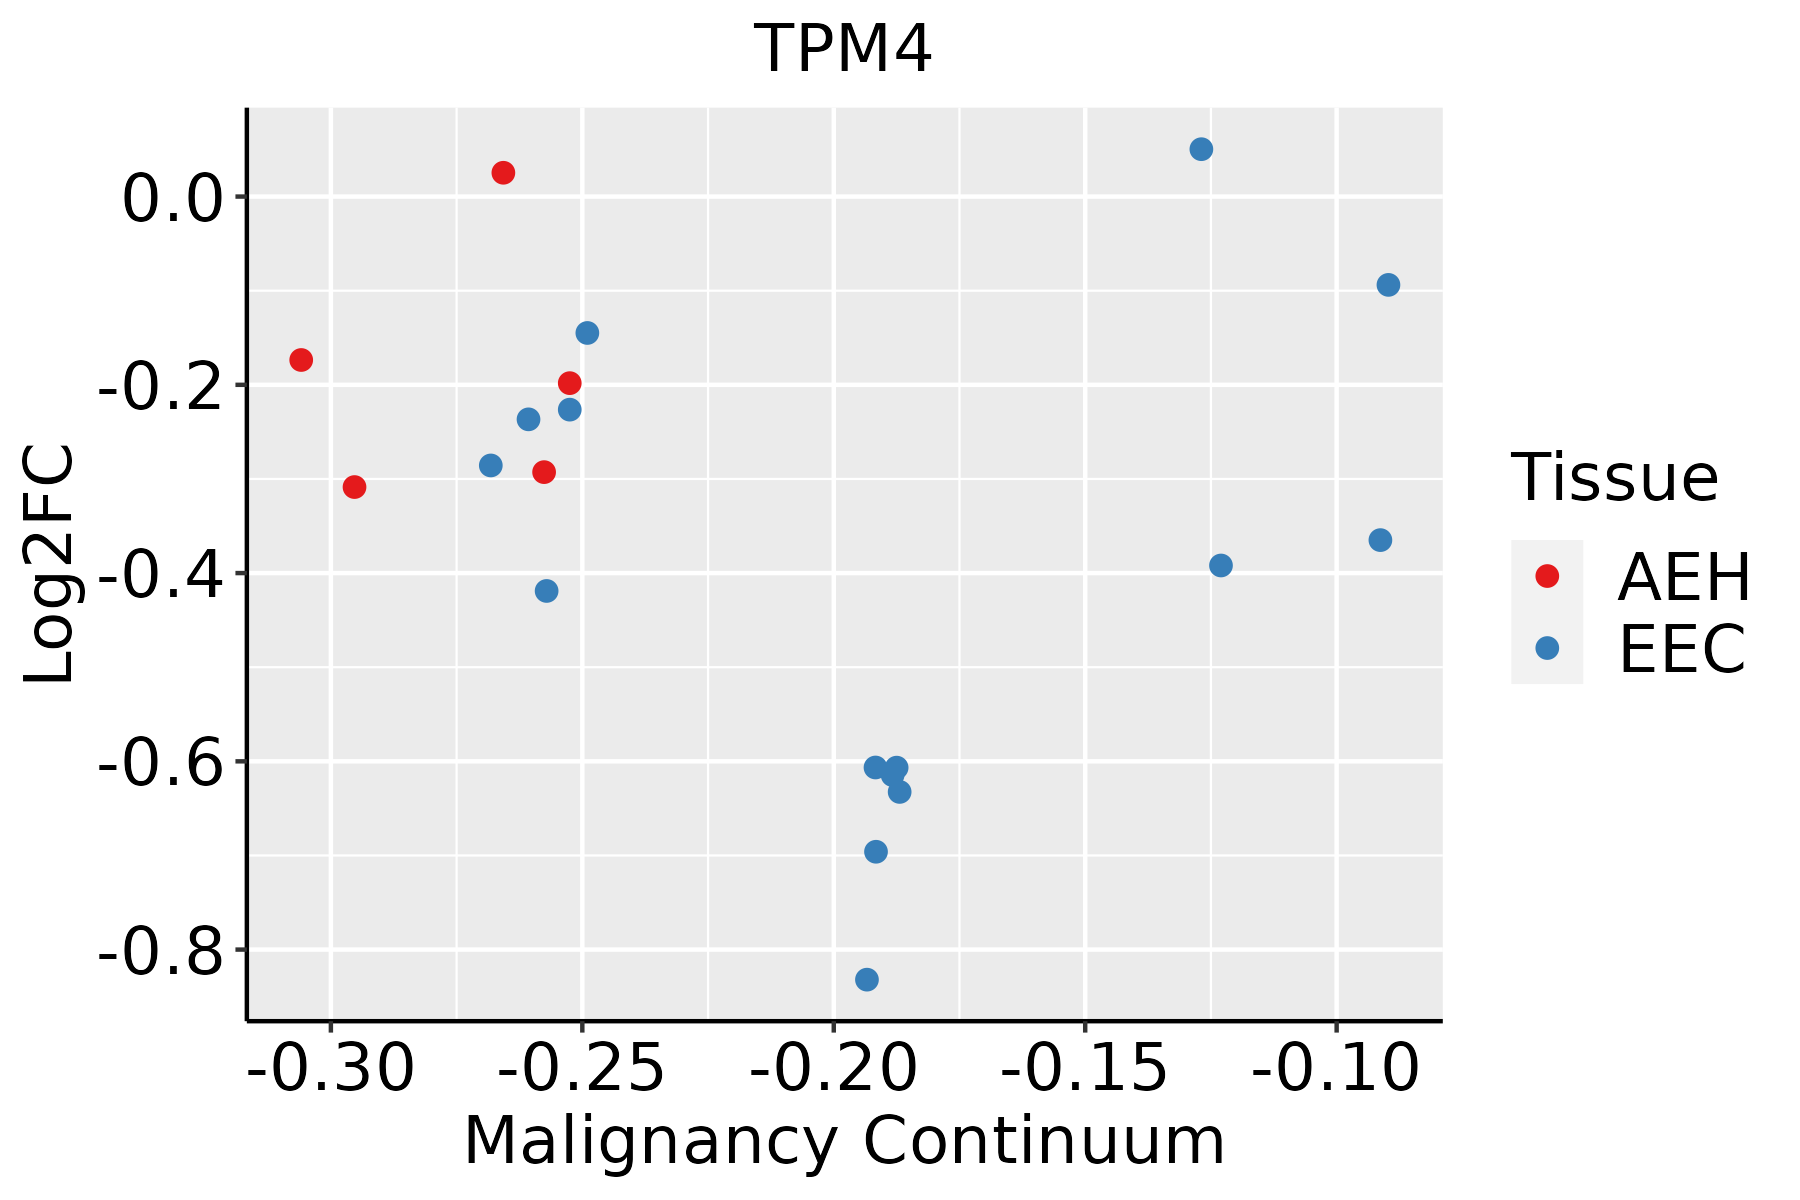 | AEH: Atypical endometrial hyperplasia |
| EEC: Endometrioid Cancer | ||
| Esophagus | 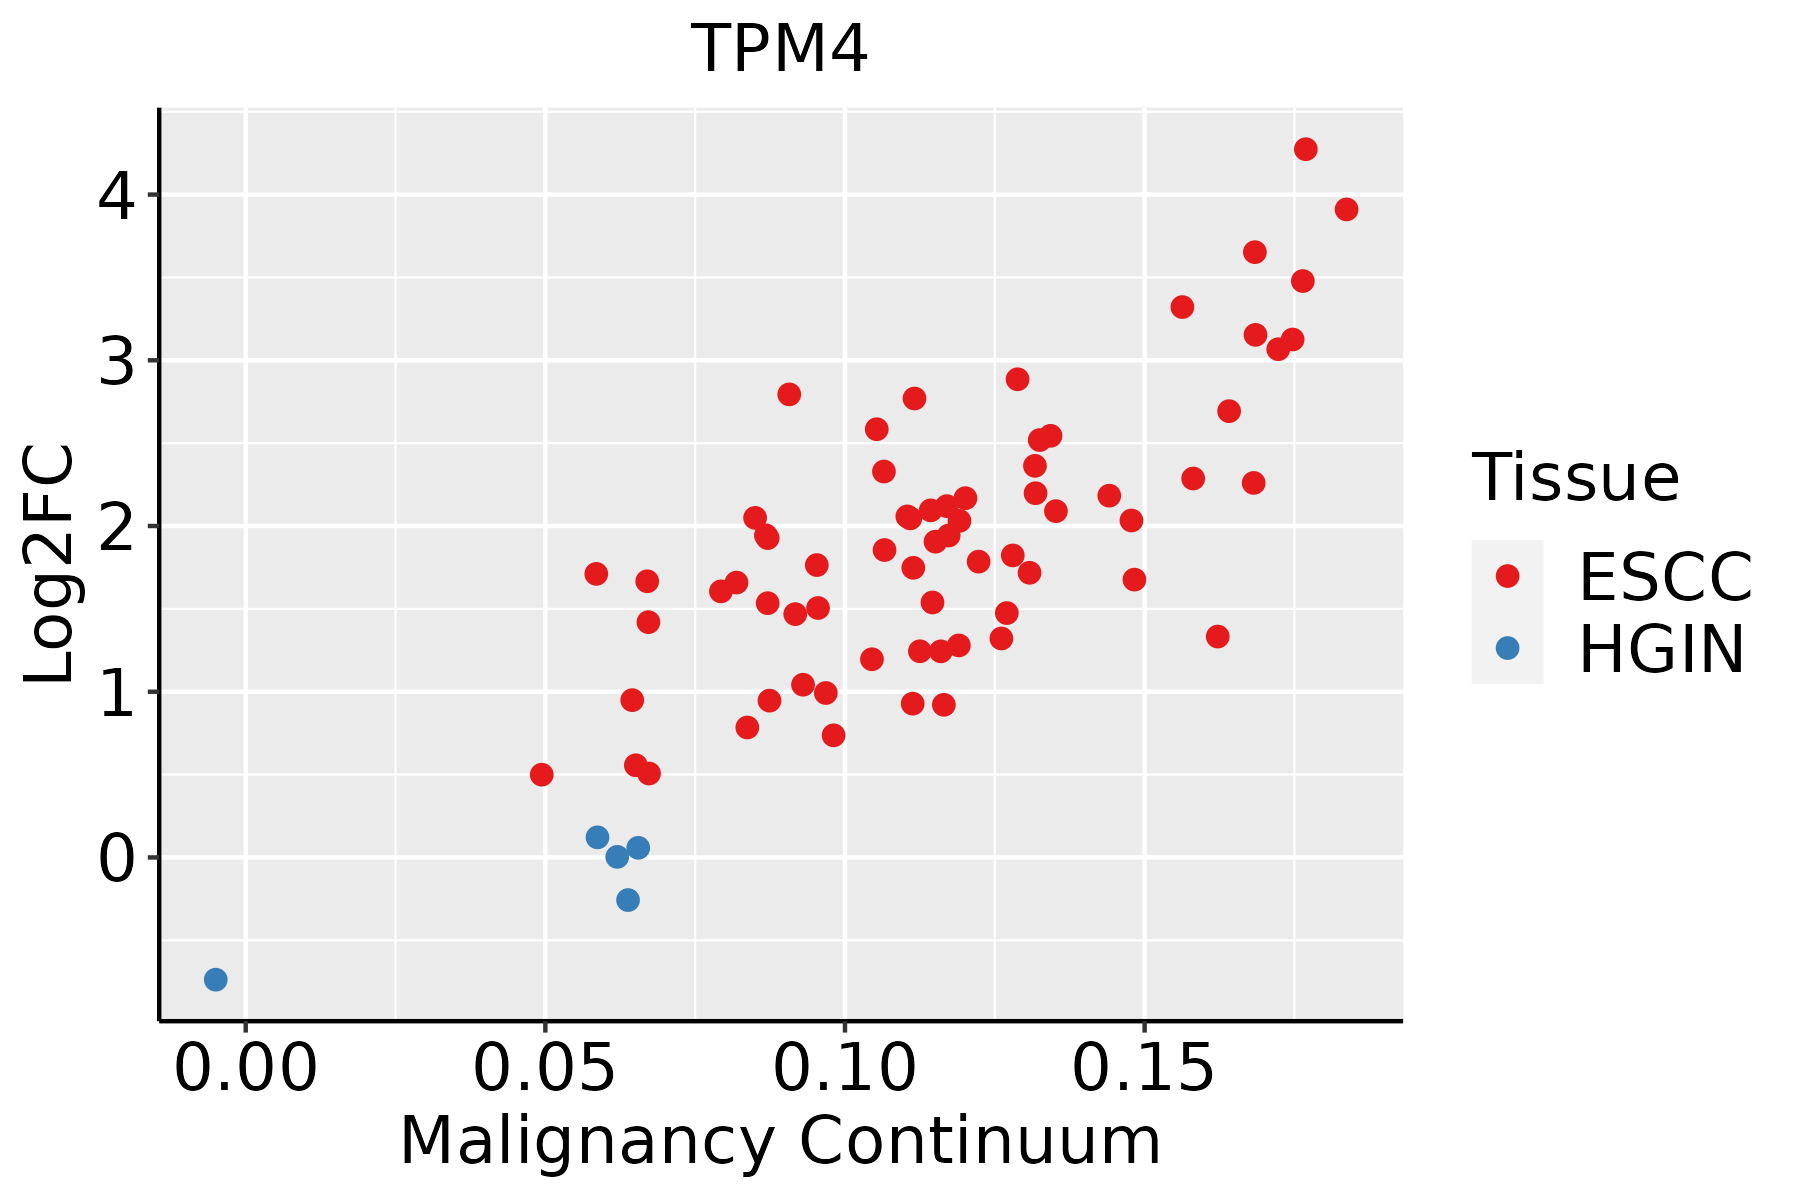 | ESCC: Esophageal squamous cell carcinoma |
| HGIN: High-grade intraepithelial neoplasias | ||
| LGIN: Low-grade intraepithelial neoplasias | ||
| GC | 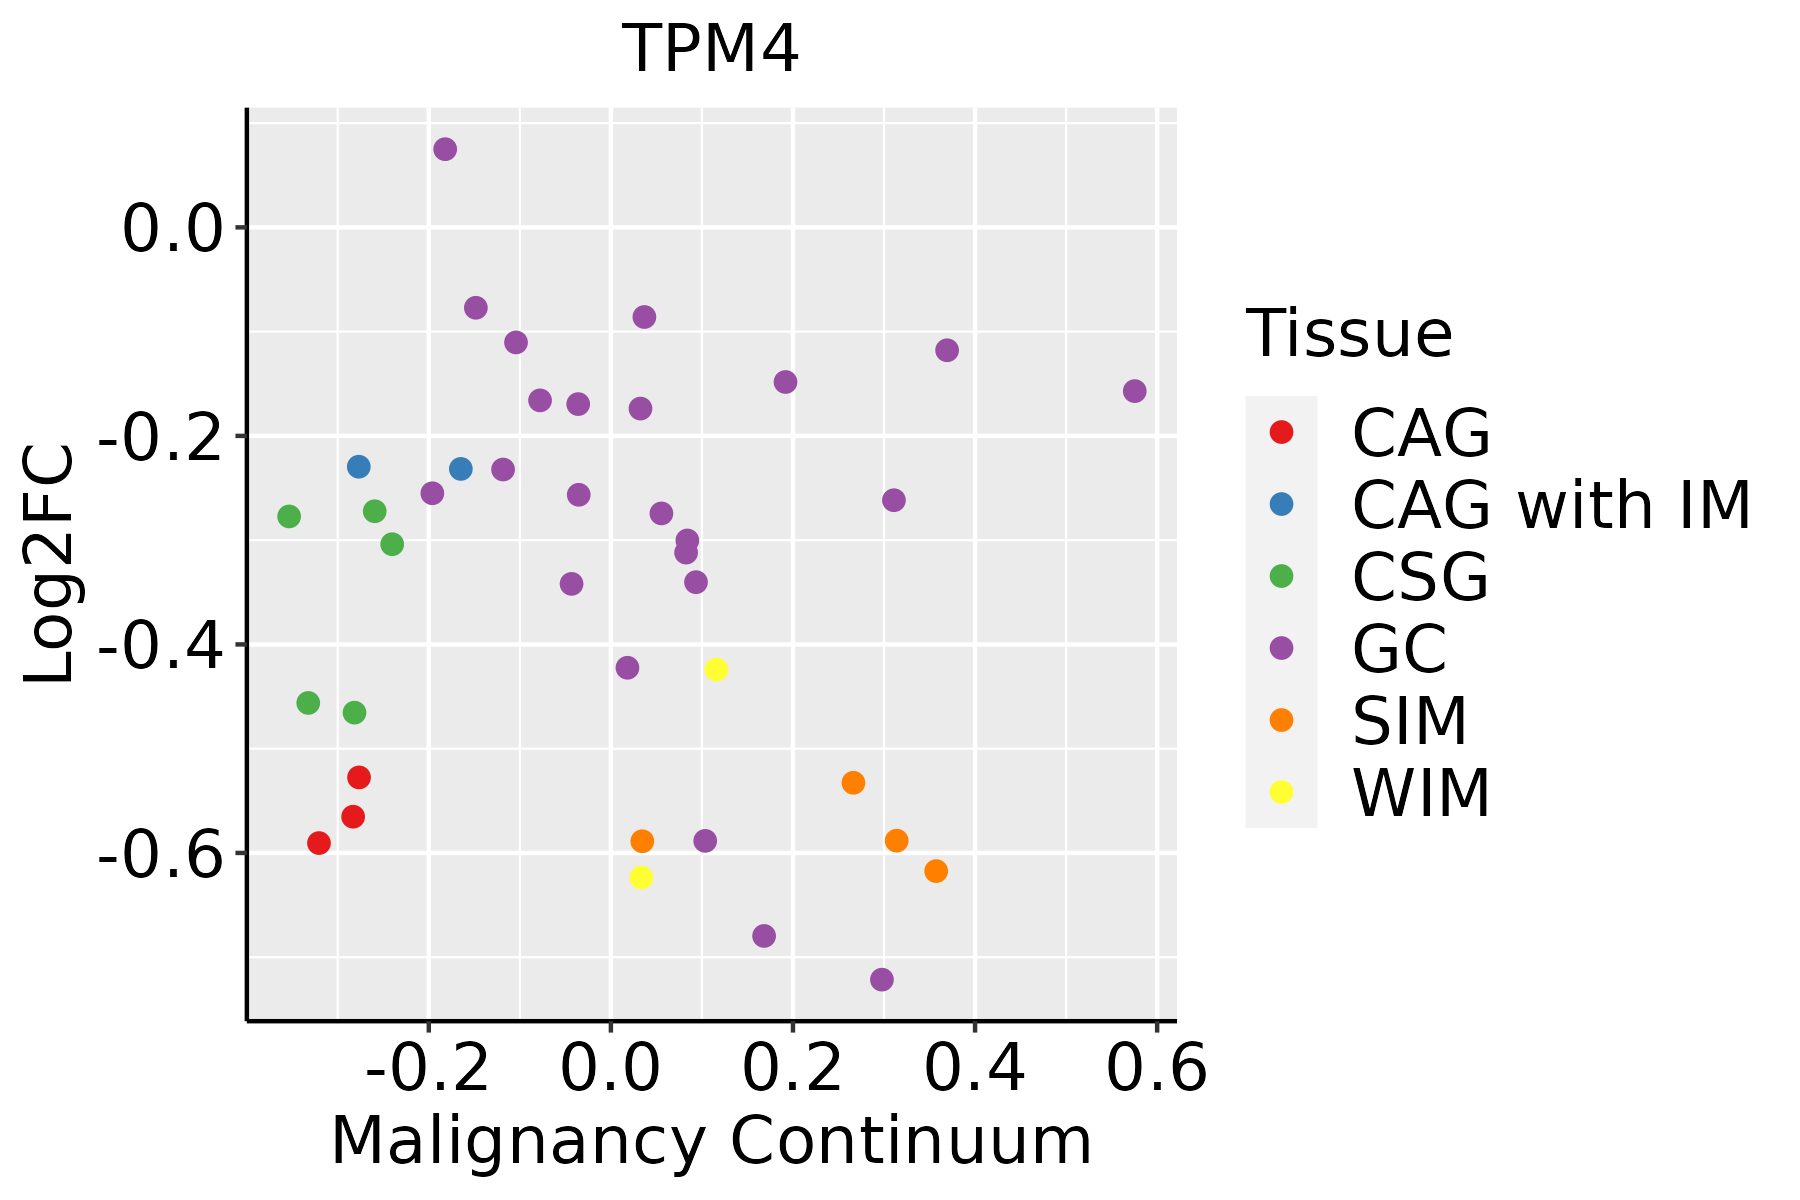 | CAG: Chronic atrophic gastritis |
| CAG with IM: Chronic atrophic gastritis with intestinal metaplasia | ||
| CSG: Chronic superficial gastritis | ||
| GC: Gastric cancer | ||
| SIM: Severe intestinal metaplasia | ||
| WIM: Wild intestinal metaplasia | ||
| Liver | 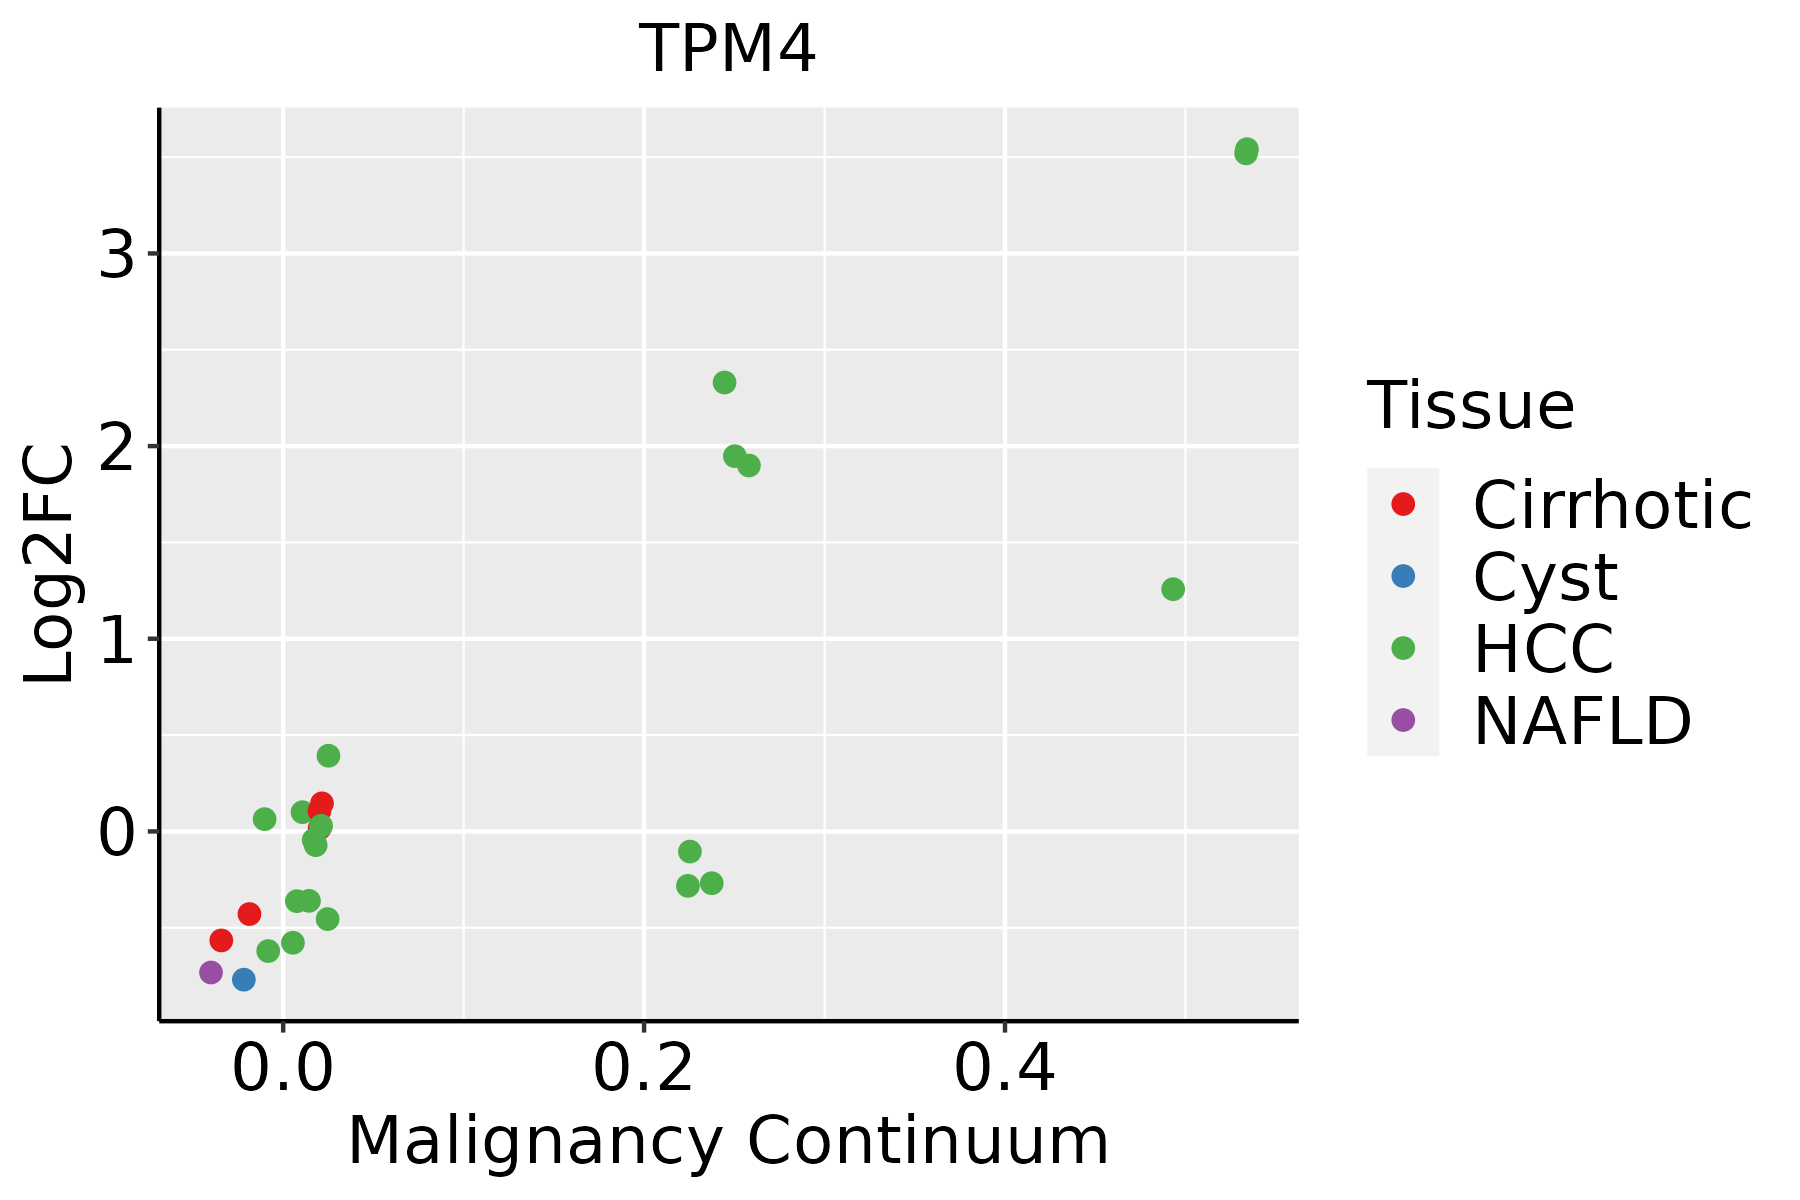 | HCC: Hepatocellular carcinoma |
| NAFLD: Non-alcoholic fatty liver disease | ||
| Oral Cavity | 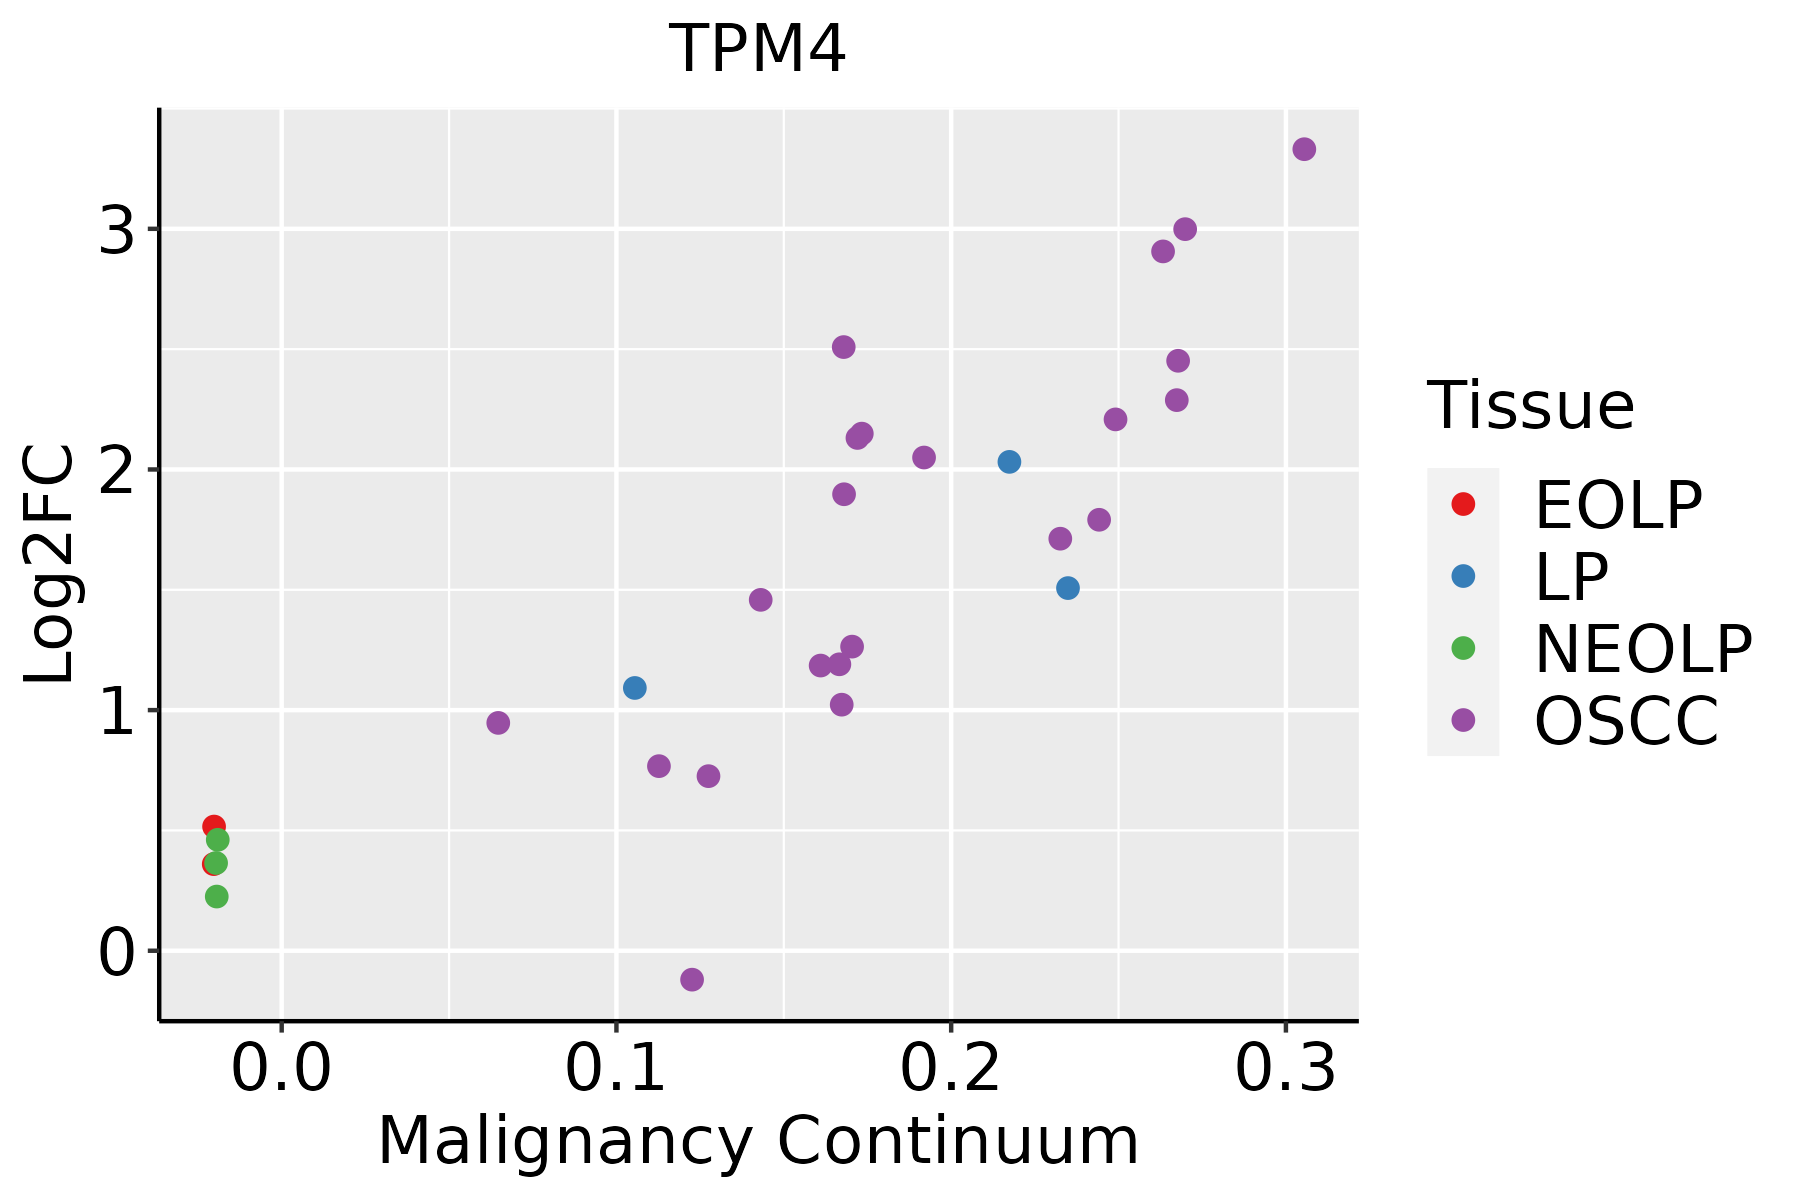 | EOLP: Erosive Oral lichen planus |
| LP: leukoplakia | ||
| NEOLP: Non-erosive oral lichen planus | ||
| OSCC: Oral squamous cell carcinoma | ||
| Prostate |  | BPH: Benign Prostatic Hyperplasia |
| Skin | 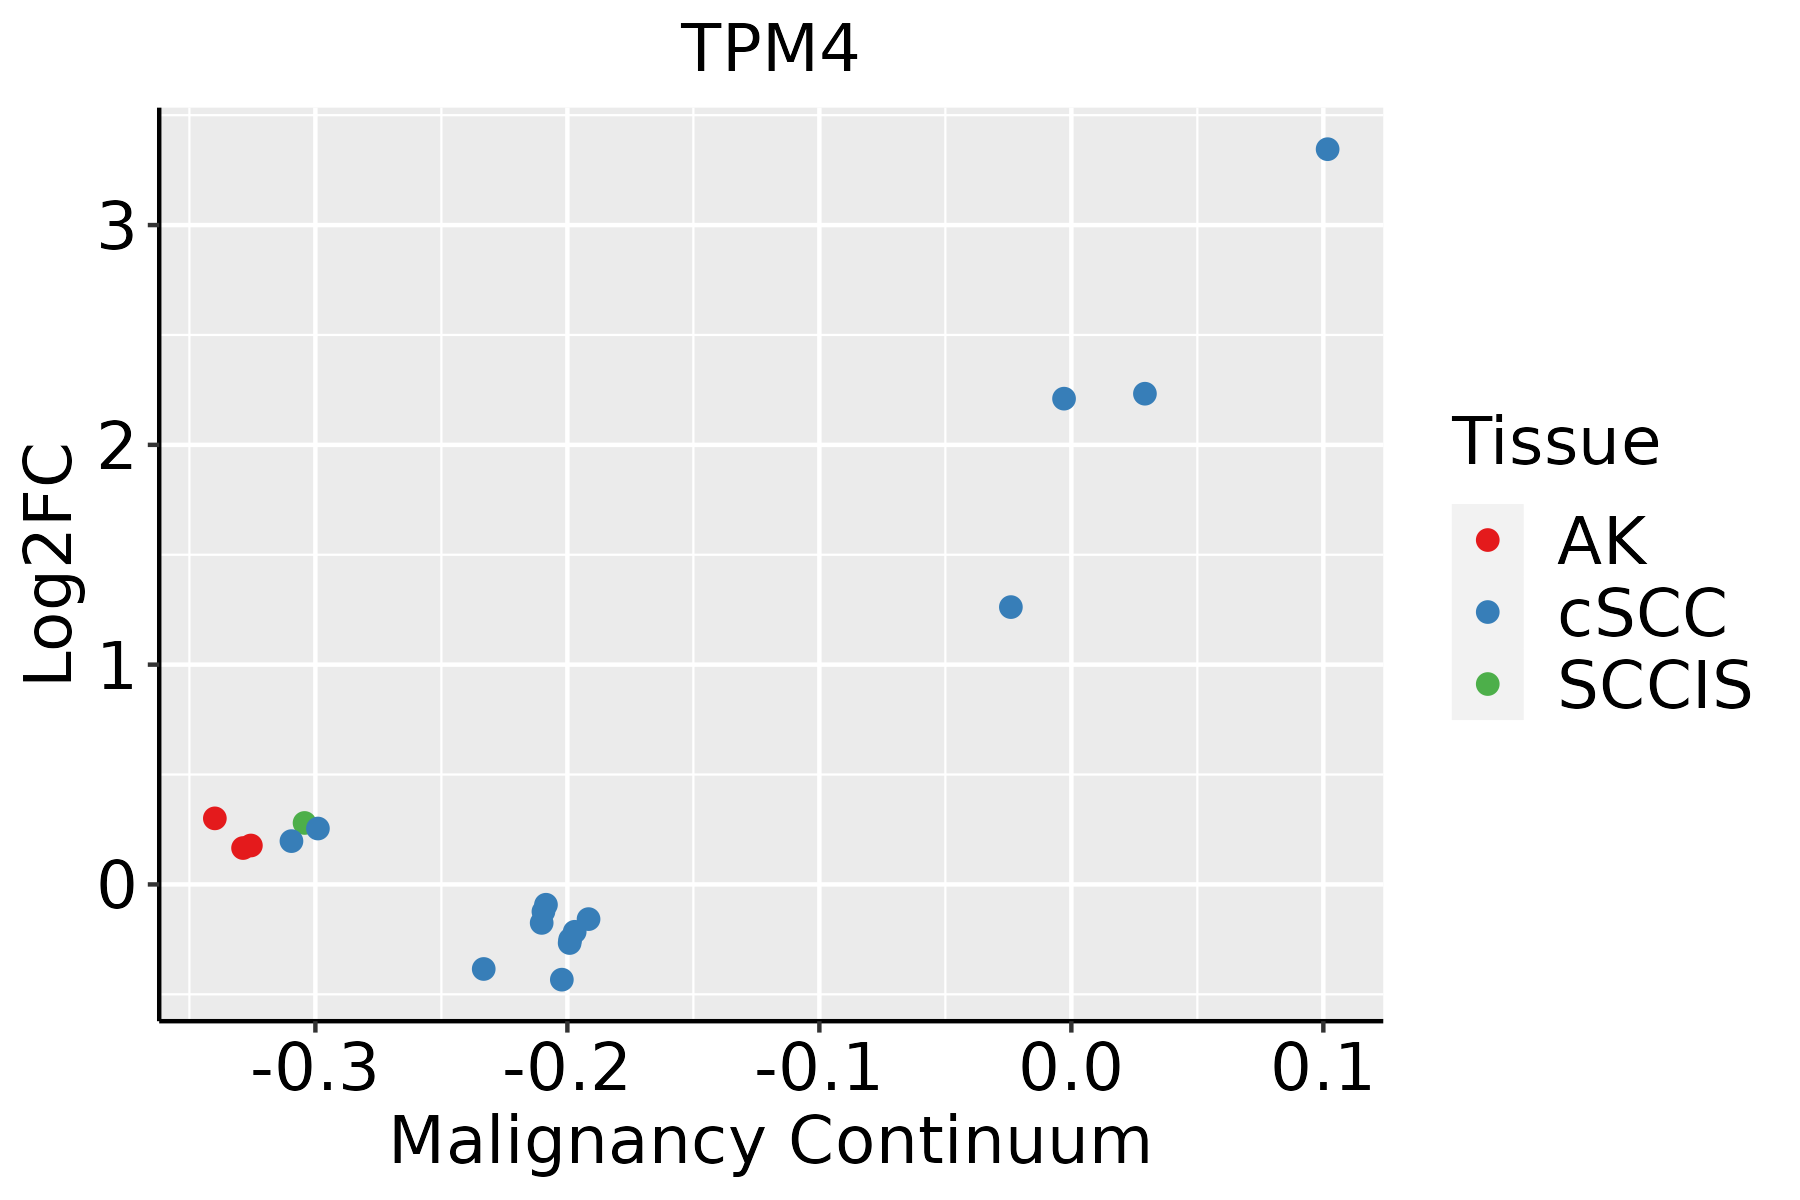 | AK: Actinic keratosis |
| cSCC: Cutaneous squamous cell carcinoma | ||
| SCCIS:squamous cell carcinoma in situ | ||
| Thyroid | 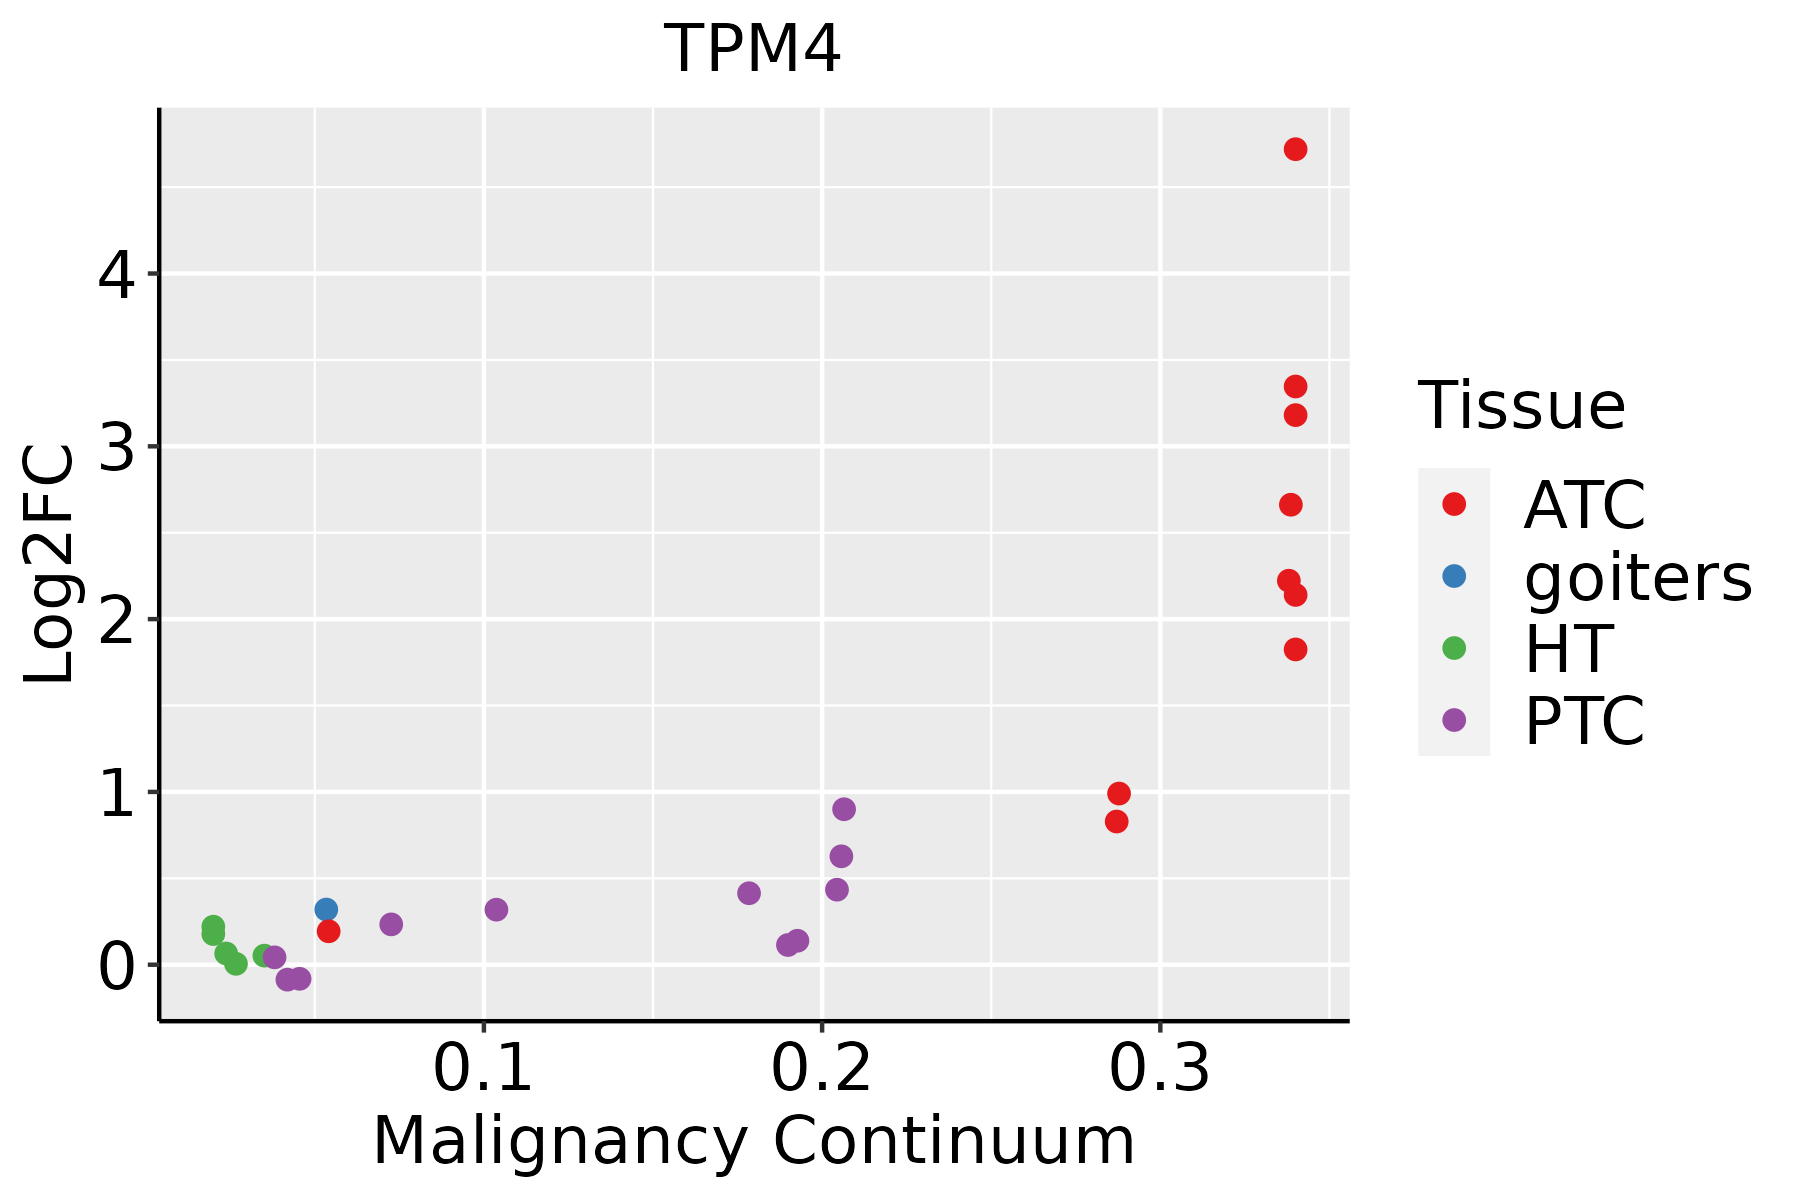 | ATC: Anaplastic thyroid cancer |
| HT: Hashimoto's thyroiditis | ||
| PTC: Papillary thyroid cancer |
| ∗log2FC in expression of this searched gene in stem-like cells from each diseased tissue sample relative to stem-like cells in normal samples in each tissue plotted against the malignancy continuum. Samples are colored based on if they are from different disease stage. |
Top |
Malignant transformation related pathway analysis |
| Find out the enriched GO biological processes and KEGG pathways involved in transition from healthy to precancer to cancer |
| Tissue | Disease Stage | Enriched GO biological Processes |
| Colorectum | AD |  |
| Colorectum | SER |  |
| Colorectum | MSS |  |
| Colorectum | MSI-H |  |
| Colorectum | FAP |  |
| ∗Top 15 enriched GO BP terms are showed in the bar plot of each disease state in each tissue. Each row represents a significant GO biological process which is colored according to the -log10(p.adjust). |
| Page: 1 2 3 4 5 6 7 8 9 |
| GO ID | Tissue | Disease Stage | Description | Gene Ratio | Bg Ratio | pvalue | p.adjust | Count |
| GO:00070159 | Breast | Precancer | actin filament organization | 44/1080 | 442/18723 | 3.02e-04 | 4.35e-03 | 44 |
| GO:00016496 | Breast | Precancer | osteoblast differentiation | 27/1080 | 229/18723 | 3.35e-04 | 4.73e-03 | 27 |
| GO:00015036 | Breast | Precancer | ossification | 36/1080 | 408/18723 | 7.53e-03 | 4.98e-02 | 36 |
| GO:000164912 | Breast | IDC | osteoblast differentiation | 35/1434 | 229/18723 | 6.64e-05 | 1.35e-03 | 35 |
| GO:000701514 | Breast | IDC | actin filament organization | 55/1434 | 442/18723 | 2.45e-04 | 3.84e-03 | 55 |
| GO:000150311 | Breast | IDC | ossification | 50/1434 | 408/18723 | 6.51e-04 | 8.04e-03 | 50 |
| GO:00030125 | Breast | IDC | muscle system process | 50/1434 | 452/18723 | 5.52e-03 | 4.05e-02 | 50 |
| GO:000701524 | Breast | DCIS | actin filament organization | 56/1390 | 442/18723 | 5.90e-05 | 1.19e-03 | 56 |
| GO:000164921 | Breast | DCIS | osteoblast differentiation | 32/1390 | 229/18723 | 4.00e-04 | 5.48e-03 | 32 |
| GO:000301212 | Breast | DCIS | muscle system process | 50/1390 | 452/18723 | 3.02e-03 | 2.57e-02 | 50 |
| GO:000150321 | Breast | DCIS | ossification | 45/1390 | 408/18723 | 4.98e-03 | 3.72e-02 | 45 |
| GO:000701510 | Cervix | CC | actin filament organization | 109/2311 | 442/18723 | 4.92e-13 | 2.45e-10 | 109 |
| GO:00016497 | Cervix | CC | osteoblast differentiation | 47/2311 | 229/18723 | 2.88e-04 | 3.11e-03 | 47 |
| GO:00015037 | Cervix | CC | ossification | 71/2311 | 408/18723 | 1.67e-03 | 1.28e-02 | 71 |
| GO:000701515 | Cervix | HSIL_HPV | actin filament organization | 43/737 | 442/18723 | 4.77e-08 | 3.59e-06 | 43 |
| GO:000701525 | Cervix | N_HPV | actin filament organization | 29/534 | 442/18723 | 3.00e-05 | 8.02e-04 | 29 |
| GO:000164913 | Cervix | N_HPV | osteoblast differentiation | 14/534 | 229/18723 | 6.22e-03 | 4.28e-02 | 14 |
| GO:000150312 | Cervix | N_HPV | ossification | 21/534 | 408/18723 | 6.98e-03 | 4.61e-02 | 21 |
| GO:0007015 | Colorectum | AD | actin filament organization | 167/3918 | 442/18723 | 1.65e-16 | 7.94e-14 | 167 |
| GO:0001649 | Colorectum | AD | osteoblast differentiation | 70/3918 | 229/18723 | 3.59e-04 | 4.18e-03 | 70 |
| Page: 1 2 3 4 5 |
| Pathway ID | Tissue | Disease Stage | Description | Gene Ratio | Bg Ratio | pvalue | p.adjust | qvalue | Count |
| hsa0426016 | Breast | Precancer | Cardiac muscle contraction | 22/684 | 87/8465 | 9.72e-07 | 1.62e-05 | 1.24e-05 | 22 |
| hsa0426017 | Breast | Precancer | Cardiac muscle contraction | 22/684 | 87/8465 | 9.72e-07 | 1.62e-05 | 1.24e-05 | 22 |
| hsa0426022 | Breast | IDC | Cardiac muscle contraction | 23/867 | 87/8465 | 1.39e-05 | 1.61e-04 | 1.21e-04 | 23 |
| hsa0426032 | Breast | IDC | Cardiac muscle contraction | 23/867 | 87/8465 | 1.39e-05 | 1.61e-04 | 1.21e-04 | 23 |
| hsa0426042 | Breast | DCIS | Cardiac muscle contraction | 22/846 | 87/8465 | 3.08e-05 | 3.43e-04 | 2.53e-04 | 22 |
| hsa0426052 | Breast | DCIS | Cardiac muscle contraction | 22/846 | 87/8465 | 3.08e-05 | 3.43e-04 | 2.53e-04 | 22 |
| hsa0426018 | Cervix | CC | Cardiac muscle contraction | 23/1267 | 87/8465 | 3.71e-03 | 1.34e-02 | 7.91e-03 | 23 |
| hsa0426019 | Cervix | CC | Cardiac muscle contraction | 23/1267 | 87/8465 | 3.71e-03 | 1.34e-02 | 7.91e-03 | 23 |
| hsa04260 | Colorectum | AD | Cardiac muscle contraction | 32/2092 | 87/8465 | 7.92e-03 | 3.13e-02 | 2.00e-02 | 32 |
| hsa042601 | Colorectum | AD | Cardiac muscle contraction | 32/2092 | 87/8465 | 7.92e-03 | 3.13e-02 | 2.00e-02 | 32 |
| hsa042602 | Colorectum | SER | Cardiac muscle contraction | 31/1580 | 87/8465 | 1.30e-04 | 1.30e-03 | 9.47e-04 | 31 |
| hsa042603 | Colorectum | SER | Cardiac muscle contraction | 31/1580 | 87/8465 | 1.30e-04 | 1.30e-03 | 9.47e-04 | 31 |
| hsa042606 | Colorectum | MSI-H | Cardiac muscle contraction | 22/797 | 87/8465 | 1.20e-05 | 1.86e-04 | 1.56e-04 | 22 |
| hsa042607 | Colorectum | MSI-H | Cardiac muscle contraction | 22/797 | 87/8465 | 1.20e-05 | 1.86e-04 | 1.56e-04 | 22 |
| hsa04261 | Colorectum | FAP | Adrenergic signaling in cardiomyocytes | 38/1404 | 154/8465 | 6.16e-03 | 2.34e-02 | 1.42e-02 | 38 |
| hsa042608 | Colorectum | FAP | Cardiac muscle contraction | 24/1404 | 87/8465 | 6.49e-03 | 2.43e-02 | 1.48e-02 | 24 |
| hsa042611 | Colorectum | FAP | Adrenergic signaling in cardiomyocytes | 38/1404 | 154/8465 | 6.16e-03 | 2.34e-02 | 1.42e-02 | 38 |
| hsa042609 | Colorectum | FAP | Cardiac muscle contraction | 24/1404 | 87/8465 | 6.49e-03 | 2.43e-02 | 1.48e-02 | 24 |
| hsa0426020 | Endometrium | AEH | Cardiac muscle contraction | 27/1197 | 87/8465 | 3.93e-05 | 3.99e-04 | 2.92e-04 | 27 |
| hsa048144 | Endometrium | AEH | Motor proteins | 42/1197 | 193/8465 | 2.41e-03 | 1.42e-02 | 1.04e-02 | 42 |
| Page: 1 2 3 |
Top |
Cell-cell communication analysis |
| Identification of potential cell-cell interactions between two cell types and their ligand-receptor pairs for different disease states |
| Ligand | Receptor | LRpair | Pathway | Tissue | Disease Stage |
| Page: 1 |
Top |
Single-cell gene regulatory network inference analysis |
| Find out the significant the regulons (TFs) and the target genes of each regulon across cell types for different disease states |
| TF | Cell Type | Tissue | Disease Stage | Target Gene | RSS | Regulon Activity |
| ∗The dot plots of a searched regulon are shown for all cell subpopulations in each disease state of each tissue based on the regulon specific score inferred using pySCENIC and by calculating the average expression. |
| Page: 1 |
Top |
Somatic mutation of malignant transformation related genes |
| Annotation of somatic variants for genes involved in malignant transformation |
| Hugo Symbol | Variant Class | Variant Classification | dbSNP RS | HGVSc | HGVSp | HGVSp Short | SWISSPROT | BIOTYPE | SIFT | PolyPhen | Tumor Sample Barcode | Tissue | Histology | Sex | Age | Stage | Therapy Types | Drugs | Outcome |
| TPM4 | SNV | Missense_Mutation | novel | c.545N>C | p.Arg182Pro | p.R182P | P67936 | protein_coding | deleterious(0) | probably_damaging(1) | TCGA-AC-A6IW-01 | Breast | breast invasive carcinoma | Female | >=65 | I/II | Unknown | Unknown | SD |
| TPM4 | SNV | Missense_Mutation | novel | c.706N>A | p.Glu236Lys | p.E236K | P67936 | protein_coding | deleterious(0) | probably_damaging(0.967) | TCGA-BH-A0H5-01 | Breast | breast invasive carcinoma | Female | <65 | I/II | Chemotherapy | cytoxan | CR |
| TPM4 | SNV | Missense_Mutation | c.157N>C | p.Thr53Pro | p.T53P | P67936 | protein_coding | tolerated(0.07) | possibly_damaging(0.602) | TCGA-EW-A1OX-01 | Breast | breast invasive carcinoma | Female | <65 | I/II | Chemotherapy | taxotere | SD | |
| TPM4 | insertion | Nonsense_Mutation | novel | c.833_834insGGTTCCTTGAGCCCAGGAGCTC | p.Asn279ValfsTer3 | p.N279Vfs*3 | P67936 | protein_coding | TCGA-A2-A0EM-01 | Breast | breast invasive carcinoma | Female | >=65 | I/II | Hormone Therapy | tamoxiphen | SD | ||
| TPM4 | SNV | Missense_Mutation | c.340N>A | p.Glu114Lys | p.E114K | P67936 | protein_coding | deleterious(0) | possibly_damaging(0.749) | TCGA-IR-A3LK-01 | Cervix | cervical & endocervical cancer | Female | >=65 | I/II | Chemotherapy | cisplatin | PD | |
| TPM4 | SNV | Missense_Mutation | c.259N>T | p.Ala87Ser | p.A87S | P67936 | protein_coding | tolerated(1) | benign(0.013) | TCGA-AA-3502-01 | Colorectum | colon adenocarcinoma | Male | >=65 | I/II | Unknown | Unknown | SD | |
| TPM4 | SNV | Missense_Mutation | c.617N>A | p.Ser206Tyr | p.S206Y | P67936 | protein_coding | deleterious(0) | probably_damaging(0.958) | TCGA-AA-3510-01 | Colorectum | colon adenocarcinoma | Male | >=65 | I/II | Unknown | Unknown | SD | |
| TPM4 | SNV | Missense_Mutation | c.548N>T | p.Ala183Val | p.A183V | P67936 | protein_coding | deleterious(0.03) | benign(0.441) | TCGA-AA-3821-01 | Colorectum | colon adenocarcinoma | Female | >=65 | I/II | Unknown | Unknown | SD | |
| TPM4 | SNV | Missense_Mutation | rs751550419 | c.323C>T | p.Thr108Met | p.T108M | P67936 | protein_coding | deleterious(0.03) | benign(0.207) | TCGA-AA-3864-01 | Colorectum | colon adenocarcinoma | Male | >=65 | I/II | Unknown | Unknown | SD |
| TPM4 | SNV | Missense_Mutation | c.617C>A | p.Ser206Tyr | p.S206Y | P67936 | protein_coding | deleterious(0) | probably_damaging(0.958) | TCGA-AA-3977-01 | Colorectum | colon adenocarcinoma | Male | >=65 | I/II | Unknown | Unknown | SD |
| Page: 1 2 3 |
Top |
Related drugs of malignant transformation related genes |
| Identification of chemicals and drugs interact with genes involved in malignant transfromation |
| (DGIdb 4.0) |
| Entrez ID | Symbol | Category | Interaction Types | Drug Claim Name | Drug Name | PMIDs |
| Page: 1 |

Copyright 2023-Present -The University of Texas Health Science Center at Houston |