
|
|||||
|
 | |
| |
| |
| |
| |
| |
|
Gene: TPM3 |
Gene summary for TPM3 |
| Gene information | Species | Human | Gene symbol | TPM3 | Gene ID | 7170 |
| Gene name | tropomyosin 3 | |
| Gene Alias | CAPM1 | |
| Cytomap | 1q21.3 | |
| Gene Type | protein-coding | GO ID | GO:0003008 | UniProtAcc | A0A0S2Z4I4 |
Top |
Malignant transformation analysis |
| Identification of the aberrant gene expression in precancerous and cancerous lesions by comparing the gene expression of stem-like cells in diseased tissues with normal stem cells |
| Entrez ID | Symbol | Replicates | Species | Organ | Tissue | Adj P-value | Log2FC | Malignancy |
| 7170 | TPM3 | GSM4909282 | Human | Breast | IDC | 8.99e-11 | 4.24e-01 | -0.0288 |
| 7170 | TPM3 | GSM4909285 | Human | Breast | IDC | 3.13e-04 | 2.44e-01 | 0.21 |
| 7170 | TPM3 | GSM4909287 | Human | Breast | IDC | 3.04e-11 | 4.74e-01 | 0.2057 |
| 7170 | TPM3 | GSM4909293 | Human | Breast | IDC | 4.41e-44 | 8.15e-01 | 0.1581 |
| 7170 | TPM3 | GSM4909294 | Human | Breast | IDC | 1.33e-05 | 2.69e-01 | 0.2022 |
| 7170 | TPM3 | GSM4909296 | Human | Breast | IDC | 2.92e-06 | -1.28e-01 | 0.1524 |
| 7170 | TPM3 | GSM4909297 | Human | Breast | IDC | 2.86e-09 | -9.41e-02 | 0.1517 |
| 7170 | TPM3 | GSM4909298 | Human | Breast | IDC | 6.71e-03 | 2.20e-01 | 0.1551 |
| 7170 | TPM3 | GSM4909304 | Human | Breast | IDC | 9.11e-04 | 3.27e-01 | 0.1636 |
| 7170 | TPM3 | GSM4909307 | Human | Breast | IDC | 1.06e-03 | 3.52e-01 | 0.1569 |
| 7170 | TPM3 | GSM4909308 | Human | Breast | IDC | 1.51e-12 | 5.18e-01 | 0.158 |
| 7170 | TPM3 | GSM4909311 | Human | Breast | IDC | 1.36e-32 | -2.39e-01 | 0.1534 |
| 7170 | TPM3 | GSM4909312 | Human | Breast | IDC | 7.48e-07 | 2.12e-01 | 0.1552 |
| 7170 | TPM3 | GSM4909313 | Human | Breast | IDC | 1.76e-03 | 3.09e-01 | 0.0391 |
| 7170 | TPM3 | GSM4909315 | Human | Breast | IDC | 1.42e-09 | 4.36e-01 | 0.21 |
| 7170 | TPM3 | GSM4909316 | Human | Breast | IDC | 1.16e-02 | 3.28e-01 | 0.21 |
| 7170 | TPM3 | GSM4909317 | Human | Breast | IDC | 3.14e-12 | 5.34e-01 | 0.1355 |
| 7170 | TPM3 | GSM4909318 | Human | Breast | IDC | 2.74e-13 | 8.37e-01 | 0.2031 |
| 7170 | TPM3 | GSM4909319 | Human | Breast | IDC | 2.16e-38 | -1.19e-01 | 0.1563 |
| 7170 | TPM3 | GSM4909320 | Human | Breast | IDC | 1.09e-02 | -6.04e-02 | 0.1575 |
| Page: 1 2 3 4 5 6 7 8 9 10 11 12 |
| Tissue | Expression Dynamics | Abbreviation |
| Breast | 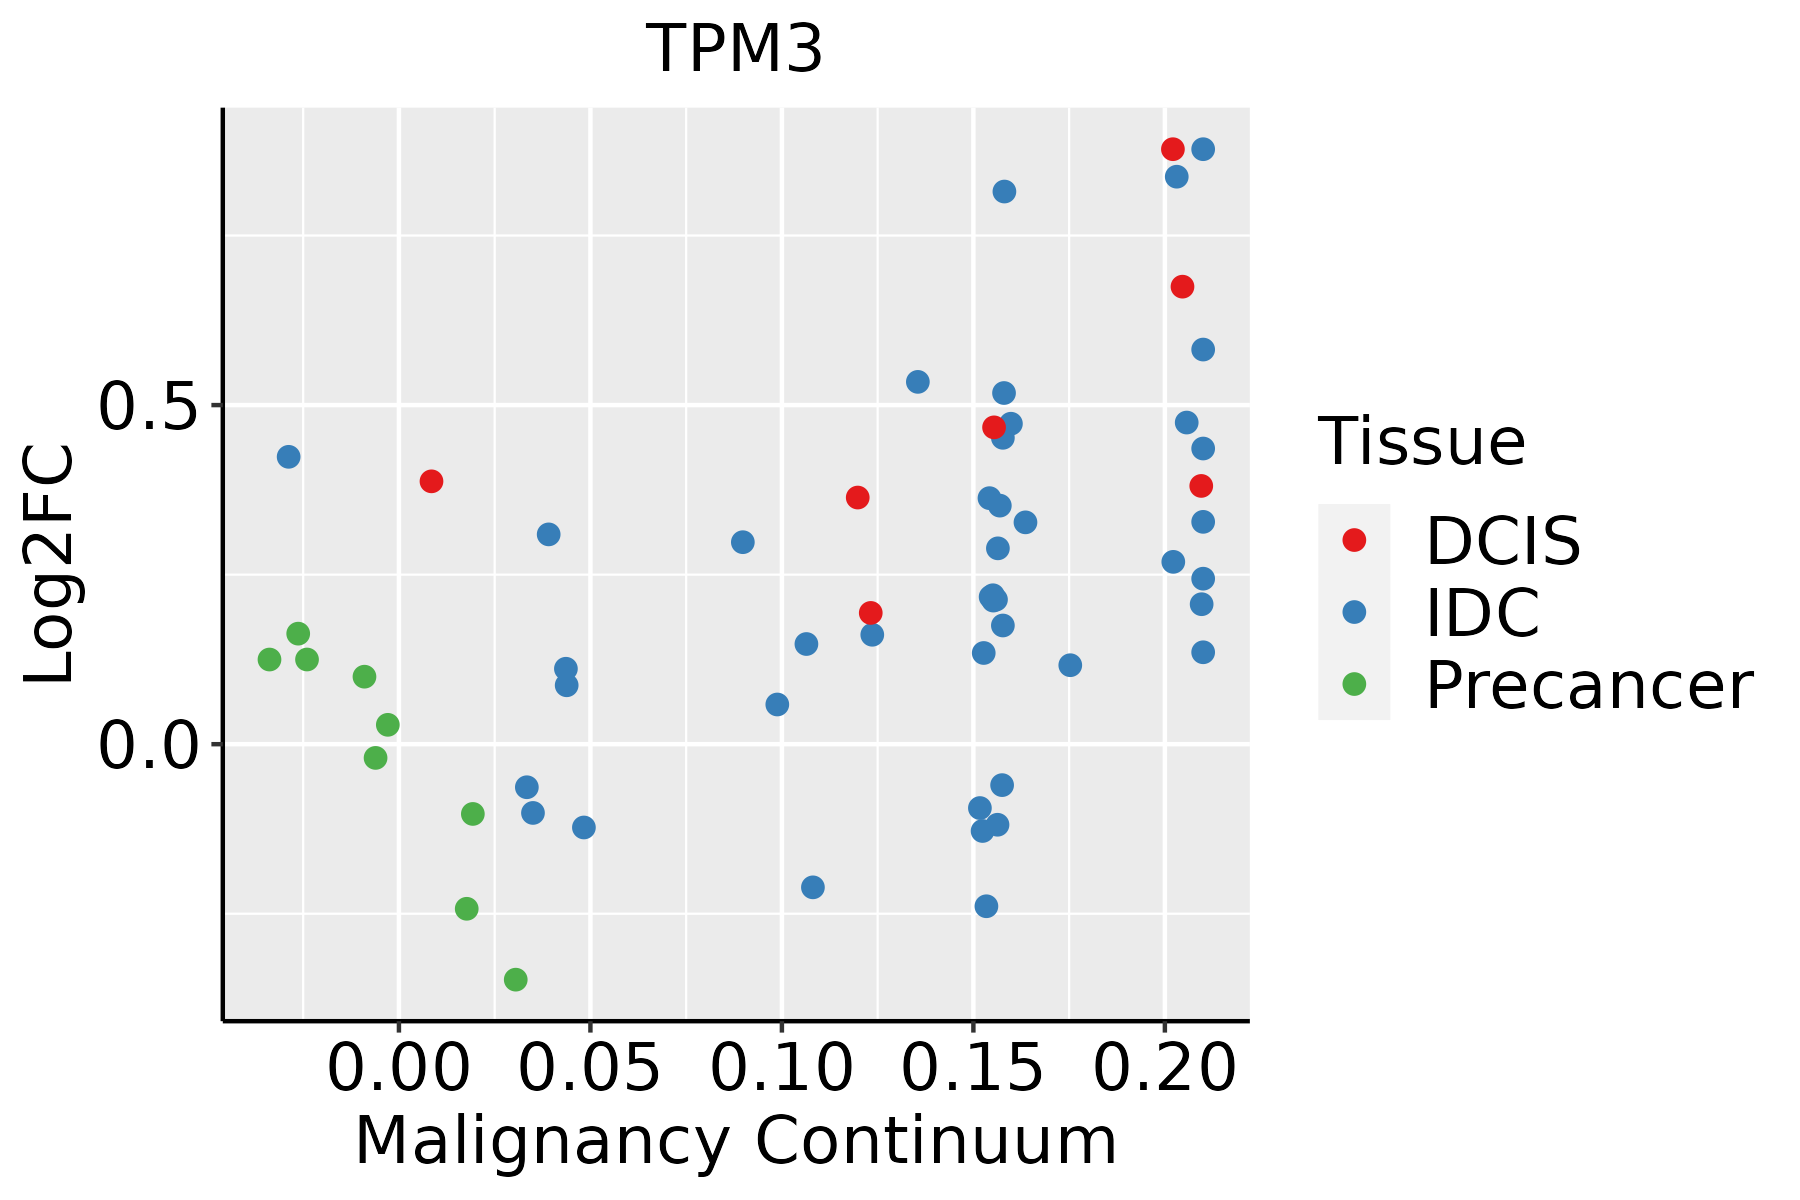 | IDC: Invasive ductal carcinoma |
| DCIS: Ductal carcinoma in situ | ||
| Precancer(BRCA1-mut): Precancerous lesion from BRCA1 mutation carriers | ||
| Colorectum (GSE201348) |  | FAP: Familial adenomatous polyposis |
| CRC: Colorectal cancer | ||
| Colorectum (HTA11) |  | AD: Adenomas |
| SER: Sessile serrated lesions | ||
| MSI-H: Microsatellite-high colorectal cancer | ||
| MSS: Microsatellite stable colorectal cancer | ||
| Endometrium |  | AEH: Atypical endometrial hyperplasia |
| EEC: Endometrioid Cancer | ||
| Esophagus | 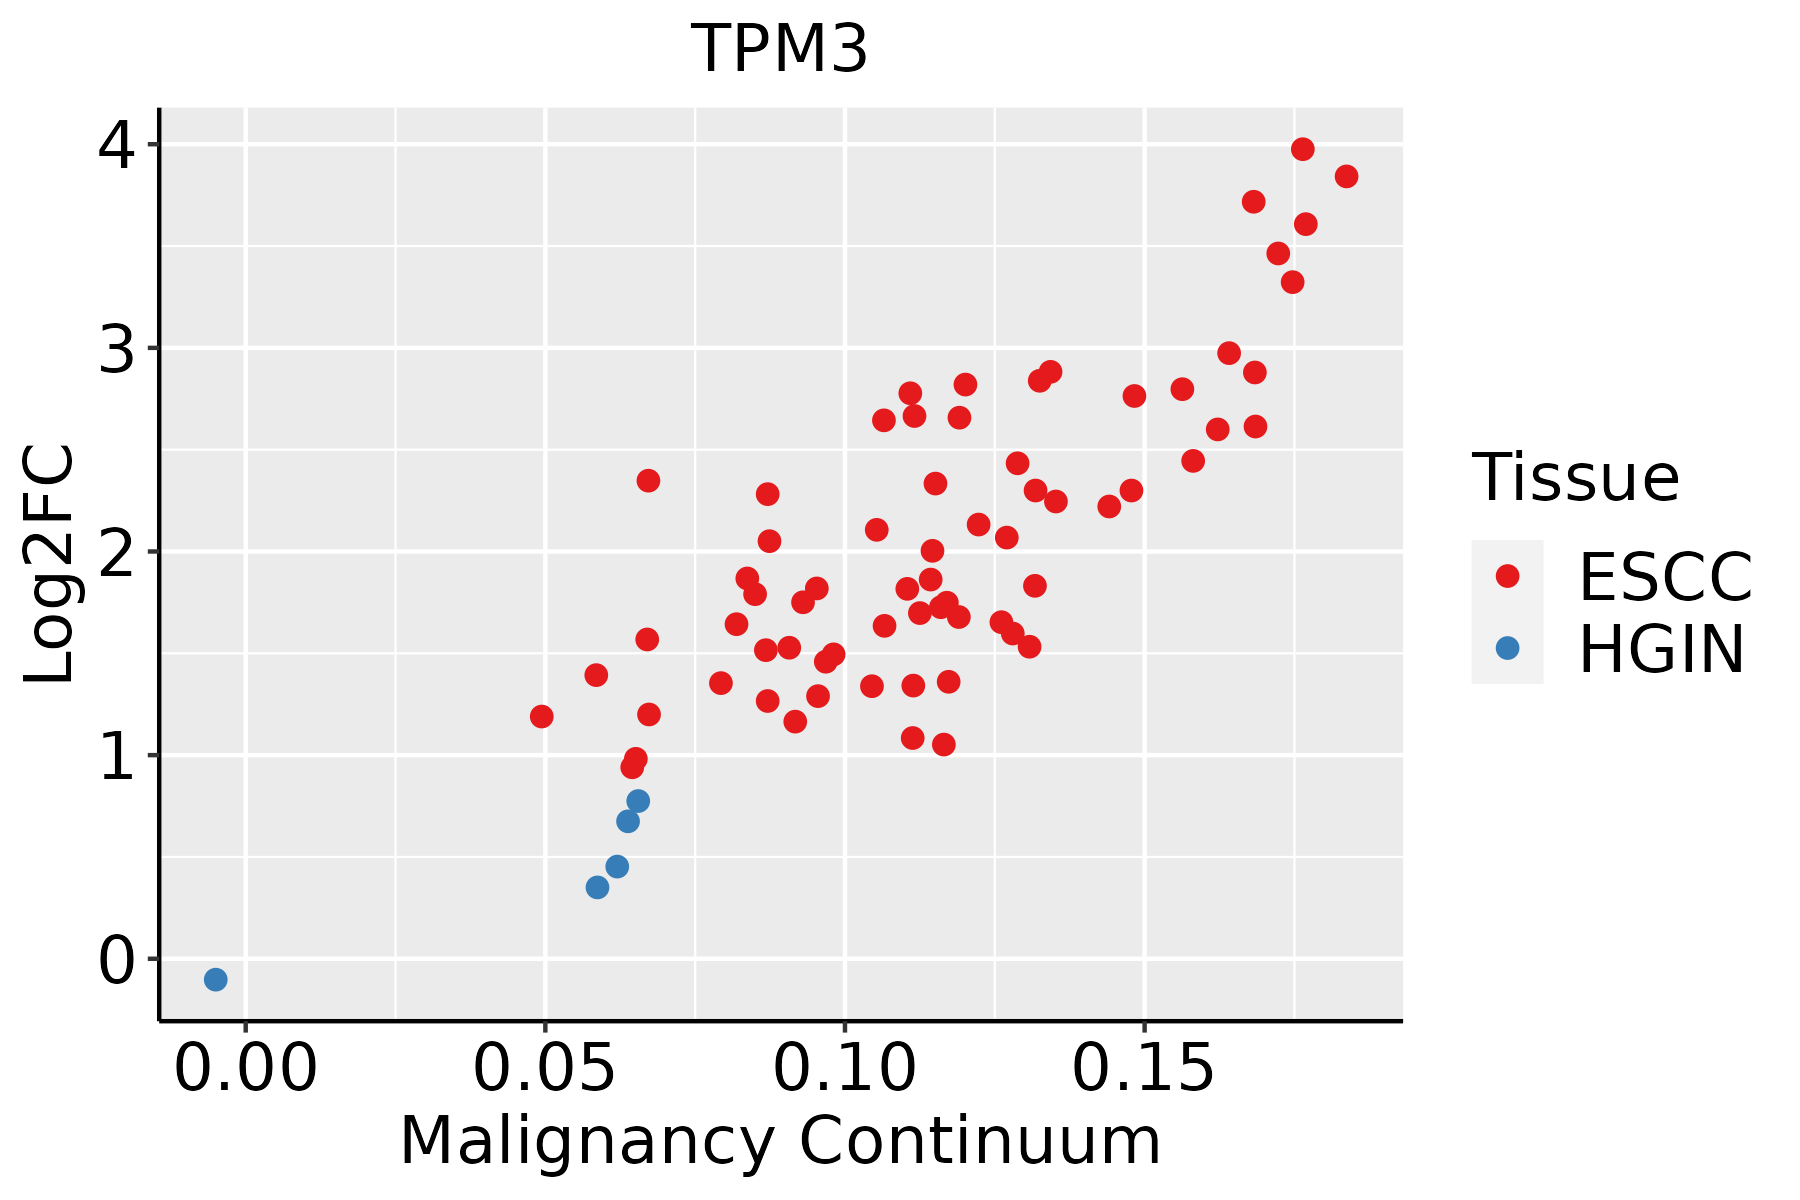 | ESCC: Esophageal squamous cell carcinoma |
| HGIN: High-grade intraepithelial neoplasias | ||
| LGIN: Low-grade intraepithelial neoplasias | ||
| Liver | 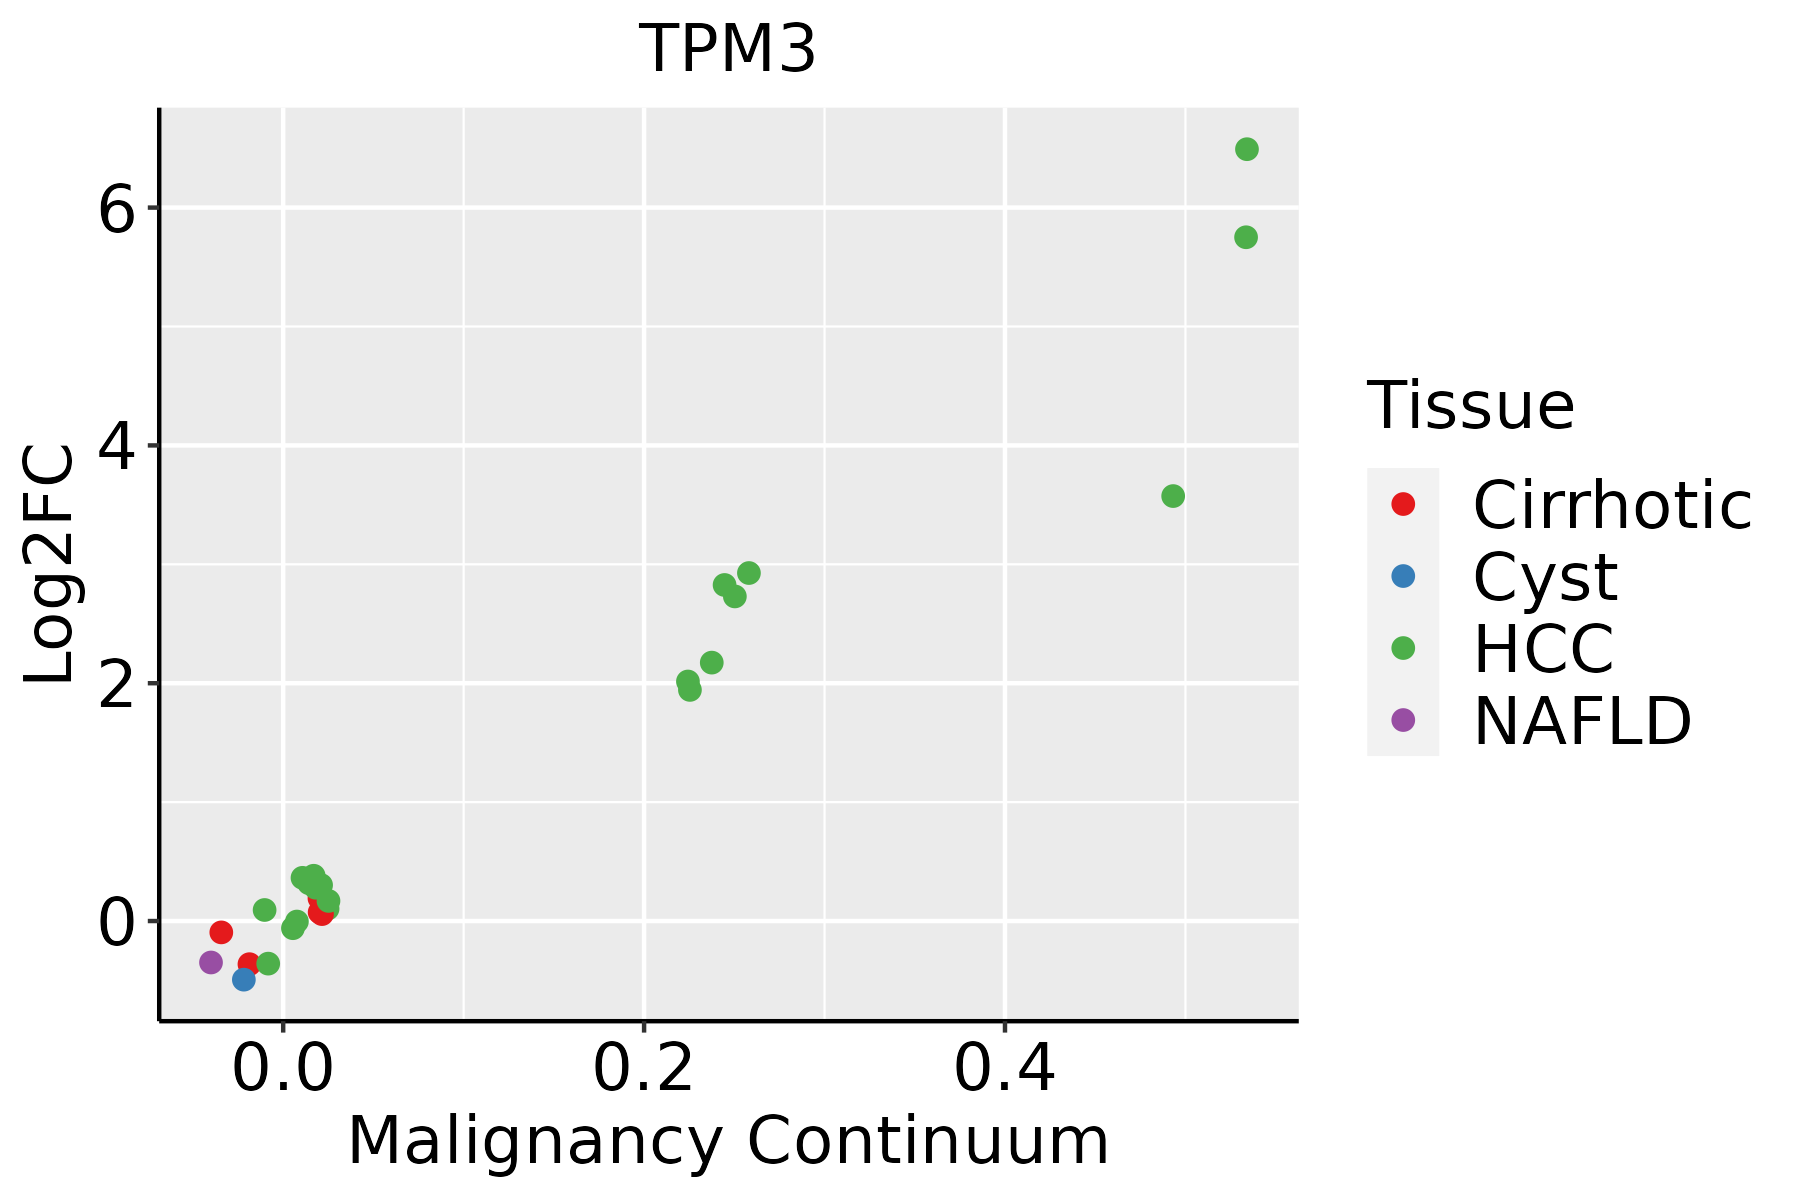 | HCC: Hepatocellular carcinoma |
| NAFLD: Non-alcoholic fatty liver disease | ||
| Oral Cavity | 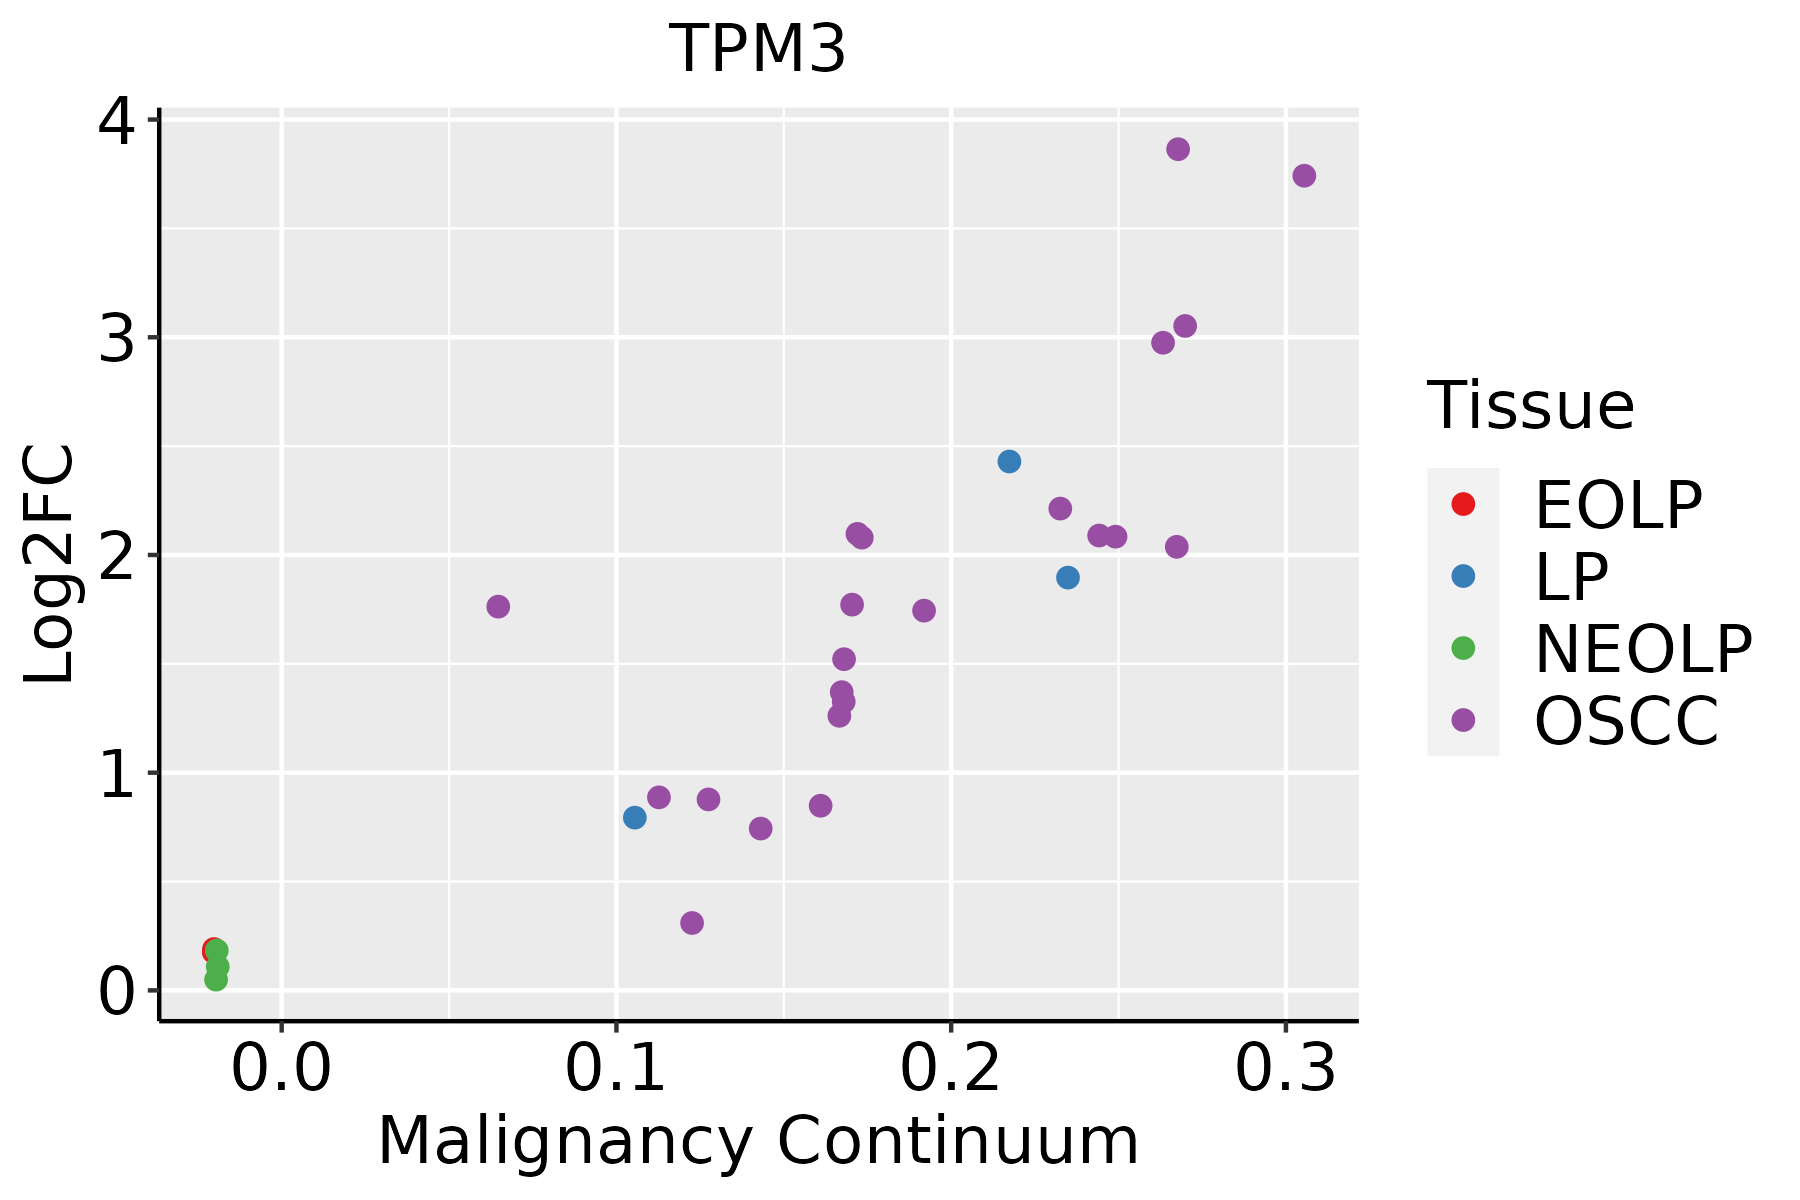 | EOLP: Erosive Oral lichen planus |
| LP: leukoplakia | ||
| NEOLP: Non-erosive oral lichen planus | ||
| OSCC: Oral squamous cell carcinoma | ||
| Prostate |  | BPH: Benign Prostatic Hyperplasia |
| Skin | 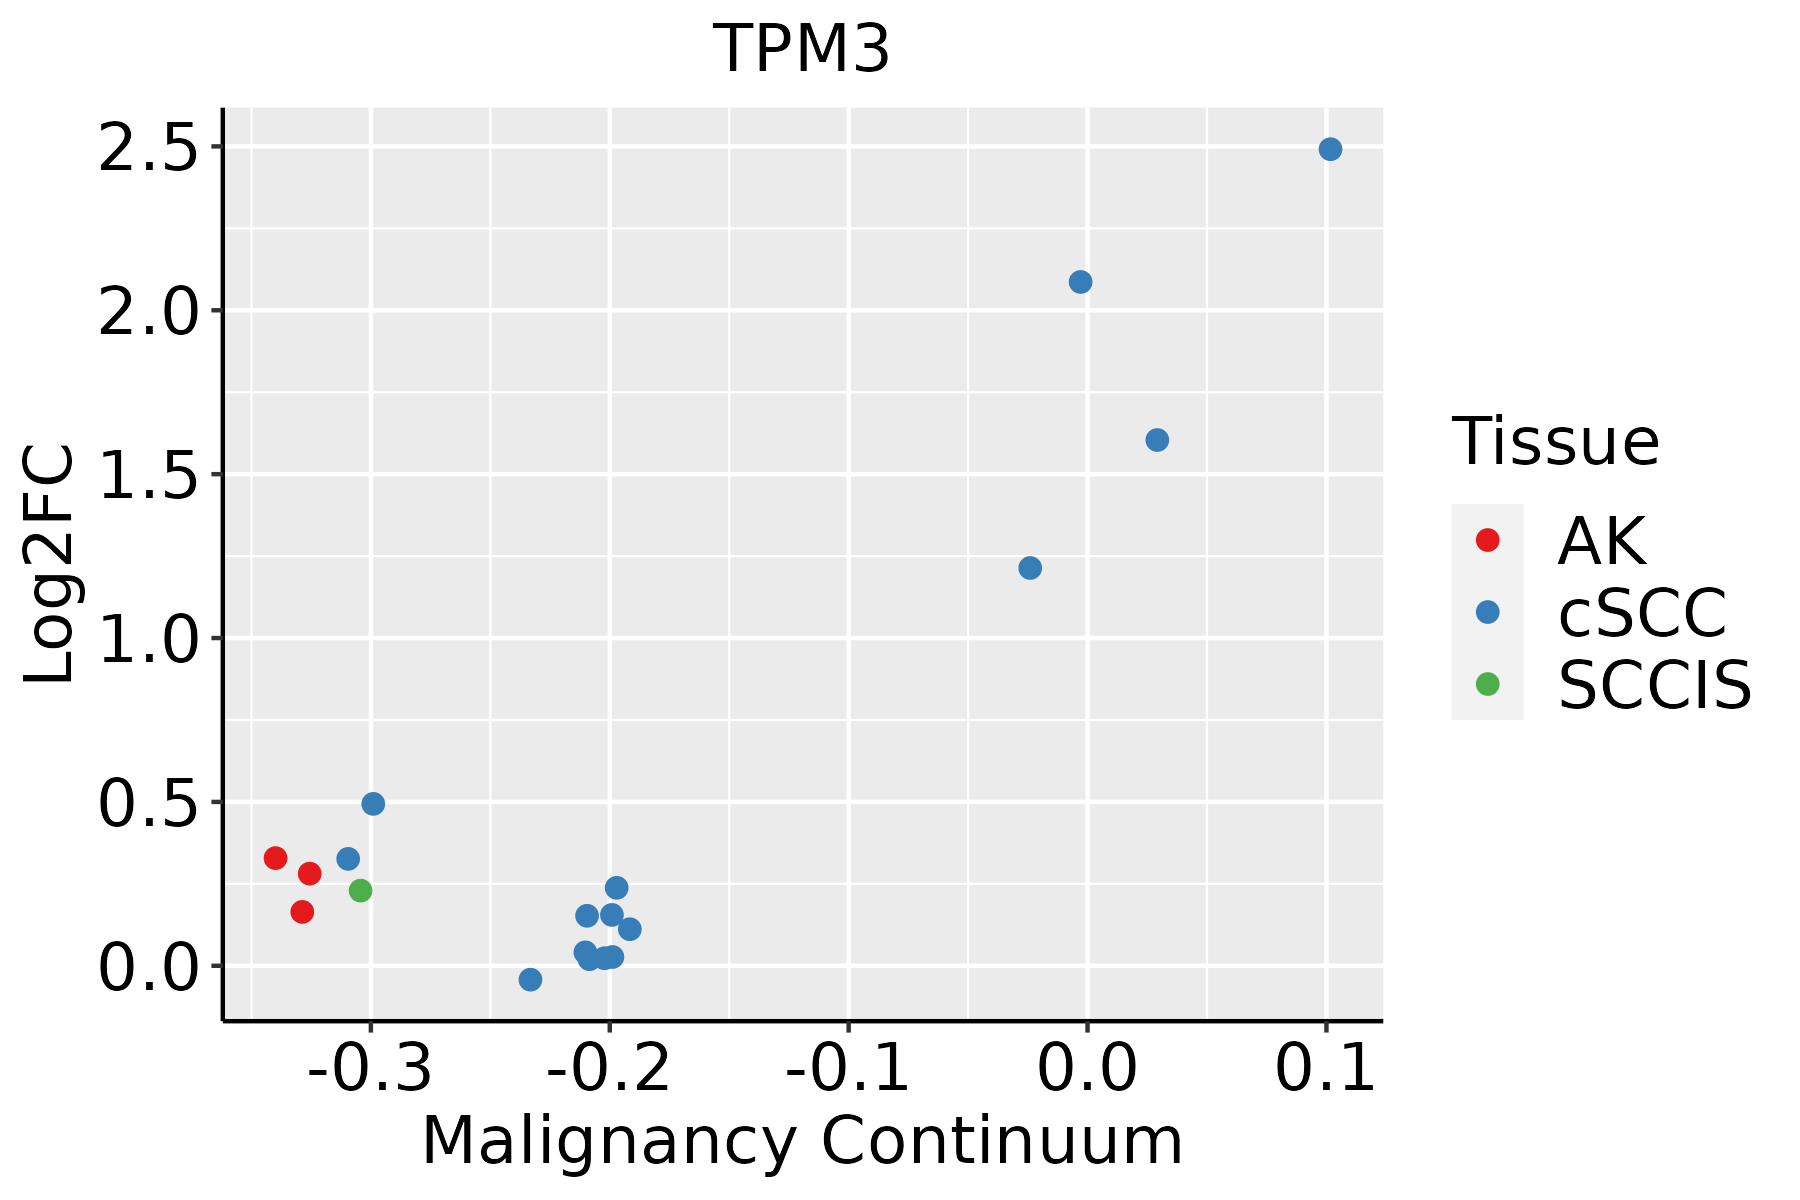 | AK: Actinic keratosis |
| cSCC: Cutaneous squamous cell carcinoma | ||
| SCCIS:squamous cell carcinoma in situ | ||
| Thyroid | 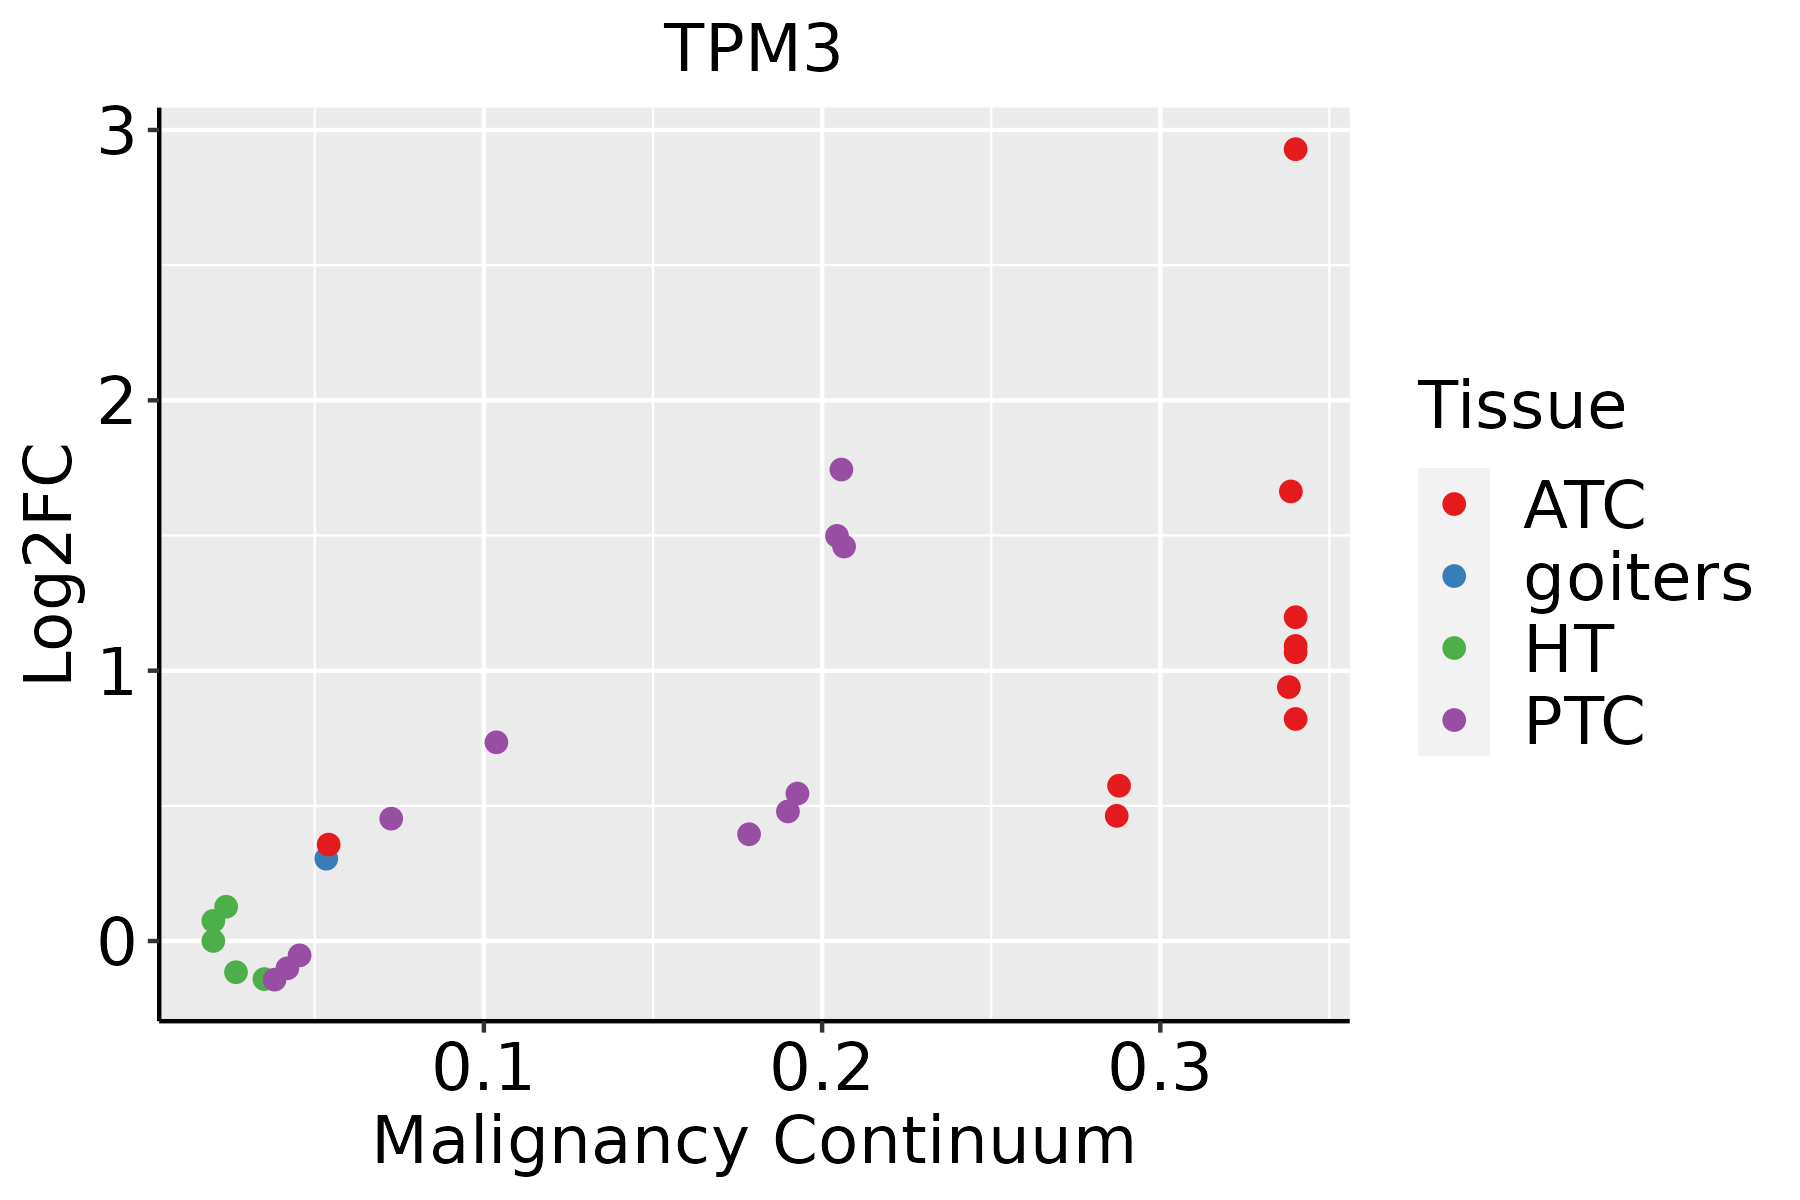 | ATC: Anaplastic thyroid cancer |
| HT: Hashimoto's thyroiditis | ||
| PTC: Papillary thyroid cancer |
| ∗log2FC in expression of this searched gene in stem-like cells from each diseased tissue sample relative to stem-like cells in normal samples in each tissue plotted against the malignancy continuum. Samples are colored based on if they are from different disease stage. |
Top |
Malignant transformation related pathway analysis |
| Find out the enriched GO biological processes and KEGG pathways involved in transition from healthy to precancer to cancer |
| Tissue | Disease Stage | Enriched GO biological Processes |
| Colorectum | AD |  |
| Colorectum | SER |  |
| Colorectum | MSS |  |
| Colorectum | MSI-H |  |
| Colorectum | FAP |  |
| ∗Top 15 enriched GO BP terms are showed in the bar plot of each disease state in each tissue. Each row represents a significant GO biological process which is colored according to the -log10(p.adjust). |
| Page: 1 2 3 4 5 6 7 8 9 |
| GO ID | Tissue | Disease Stage | Description | Gene Ratio | Bg Ratio | pvalue | p.adjust | Count |
| GO:00070159 | Breast | Precancer | actin filament organization | 44/1080 | 442/18723 | 3.02e-04 | 4.35e-03 | 44 |
| GO:000701514 | Breast | IDC | actin filament organization | 55/1434 | 442/18723 | 2.45e-04 | 3.84e-03 | 55 |
| GO:00030125 | Breast | IDC | muscle system process | 50/1434 | 452/18723 | 5.52e-03 | 4.05e-02 | 50 |
| GO:000701524 | Breast | DCIS | actin filament organization | 56/1390 | 442/18723 | 5.90e-05 | 1.19e-03 | 56 |
| GO:000301212 | Breast | DCIS | muscle system process | 50/1390 | 452/18723 | 3.02e-03 | 2.57e-02 | 50 |
| GO:0007015 | Colorectum | AD | actin filament organization | 167/3918 | 442/18723 | 1.65e-16 | 7.94e-14 | 167 |
| GO:00070151 | Colorectum | SER | actin filament organization | 134/2897 | 442/18723 | 1.39e-15 | 5.70e-13 | 134 |
| GO:0003012 | Colorectum | SER | muscle system process | 92/2897 | 452/18723 | 2.98e-03 | 2.63e-02 | 92 |
| GO:00070152 | Colorectum | MSS | actin filament organization | 146/3467 | 442/18723 | 1.16e-13 | 2.67e-11 | 146 |
| GO:00030121 | Colorectum | MSS | muscle system process | 105/3467 | 452/18723 | 6.39e-03 | 4.26e-02 | 105 |
| GO:00070154 | Colorectum | FAP | actin filament organization | 125/2622 | 442/18723 | 1.97e-15 | 3.03e-12 | 125 |
| GO:00030122 | Colorectum | FAP | muscle system process | 89/2622 | 452/18723 | 4.63e-04 | 5.39e-03 | 89 |
| GO:00070155 | Colorectum | CRC | actin filament organization | 104/2078 | 442/18723 | 4.75e-14 | 7.12e-11 | 104 |
| GO:00030123 | Colorectum | CRC | muscle system process | 74/2078 | 452/18723 | 3.92e-04 | 5.80e-03 | 74 |
| GO:000701516 | Endometrium | AEH | actin filament organization | 98/2100 | 442/18723 | 1.99e-11 | 2.98e-09 | 98 |
| GO:00030126 | Endometrium | AEH | muscle system process | 78/2100 | 452/18723 | 6.89e-05 | 1.06e-03 | 78 |
| GO:0006936 | Endometrium | AEH | muscle contraction | 59/2100 | 347/18723 | 7.32e-04 | 6.99e-03 | 59 |
| GO:000701517 | Endometrium | EEC | actin filament organization | 95/2168 | 442/18723 | 1.31e-09 | 1.09e-07 | 95 |
| GO:000301213 | Endometrium | EEC | muscle system process | 79/2168 | 452/18723 | 1.16e-04 | 1.55e-03 | 79 |
| GO:00069361 | Endometrium | EEC | muscle contraction | 59/2168 | 347/18723 | 1.57e-03 | 1.26e-02 | 59 |
| Page: 1 2 |
| Pathway ID | Tissue | Disease Stage | Description | Gene Ratio | Bg Ratio | pvalue | p.adjust | qvalue | Count |
| hsa0426016 | Breast | Precancer | Cardiac muscle contraction | 22/684 | 87/8465 | 9.72e-07 | 1.62e-05 | 1.24e-05 | 22 |
| hsa0426017 | Breast | Precancer | Cardiac muscle contraction | 22/684 | 87/8465 | 9.72e-07 | 1.62e-05 | 1.24e-05 | 22 |
| hsa0426022 | Breast | IDC | Cardiac muscle contraction | 23/867 | 87/8465 | 1.39e-05 | 1.61e-04 | 1.21e-04 | 23 |
| hsa052169 | Breast | IDC | Thyroid cancer | 9/867 | 37/8465 | 1.06e-02 | 4.92e-02 | 3.68e-02 | 9 |
| hsa0426032 | Breast | IDC | Cardiac muscle contraction | 23/867 | 87/8465 | 1.39e-05 | 1.61e-04 | 1.21e-04 | 23 |
| hsa0521614 | Breast | IDC | Thyroid cancer | 9/867 | 37/8465 | 1.06e-02 | 4.92e-02 | 3.68e-02 | 9 |
| hsa0426042 | Breast | DCIS | Cardiac muscle contraction | 22/846 | 87/8465 | 3.08e-05 | 3.43e-04 | 2.53e-04 | 22 |
| hsa0521624 | Breast | DCIS | Thyroid cancer | 9/846 | 37/8465 | 9.07e-03 | 4.13e-02 | 3.04e-02 | 9 |
| hsa0426052 | Breast | DCIS | Cardiac muscle contraction | 22/846 | 87/8465 | 3.08e-05 | 3.43e-04 | 2.53e-04 | 22 |
| hsa0521634 | Breast | DCIS | Thyroid cancer | 9/846 | 37/8465 | 9.07e-03 | 4.13e-02 | 3.04e-02 | 9 |
| hsa05216 | Colorectum | AD | Thyroid cancer | 21/2092 | 37/8465 | 3.05e-05 | 2.76e-04 | 1.76e-04 | 21 |
| hsa04260 | Colorectum | AD | Cardiac muscle contraction | 32/2092 | 87/8465 | 7.92e-03 | 3.13e-02 | 2.00e-02 | 32 |
| hsa052161 | Colorectum | AD | Thyroid cancer | 21/2092 | 37/8465 | 3.05e-05 | 2.76e-04 | 1.76e-04 | 21 |
| hsa042601 | Colorectum | AD | Cardiac muscle contraction | 32/2092 | 87/8465 | 7.92e-03 | 3.13e-02 | 2.00e-02 | 32 |
| hsa042602 | Colorectum | SER | Cardiac muscle contraction | 31/1580 | 87/8465 | 1.30e-04 | 1.30e-03 | 9.47e-04 | 31 |
| hsa042603 | Colorectum | SER | Cardiac muscle contraction | 31/1580 | 87/8465 | 1.30e-04 | 1.30e-03 | 9.47e-04 | 31 |
| hsa052162 | Colorectum | MSS | Thyroid cancer | 21/1875 | 37/8465 | 4.98e-06 | 6.00e-05 | 3.68e-05 | 21 |
| hsa042604 | Colorectum | MSS | Cardiac muscle contraction | 31/1875 | 87/8465 | 2.73e-03 | 1.32e-02 | 8.12e-03 | 31 |
| hsa052163 | Colorectum | MSS | Thyroid cancer | 21/1875 | 37/8465 | 4.98e-06 | 6.00e-05 | 3.68e-05 | 21 |
| hsa042605 | Colorectum | MSS | Cardiac muscle contraction | 31/1875 | 87/8465 | 2.73e-03 | 1.32e-02 | 8.12e-03 | 31 |
| Page: 1 2 3 |
Top |
Cell-cell communication analysis |
| Identification of potential cell-cell interactions between two cell types and their ligand-receptor pairs for different disease states |
| Ligand | Receptor | LRpair | Pathway | Tissue | Disease Stage |
| Page: 1 |
Top |
Single-cell gene regulatory network inference analysis |
| Find out the significant the regulons (TFs) and the target genes of each regulon across cell types for different disease states |
| TF | Cell Type | Tissue | Disease Stage | Target Gene | RSS | Regulon Activity |
| ∗The dot plots of a searched regulon are shown for all cell subpopulations in each disease state of each tissue based on the regulon specific score inferred using pySCENIC and by calculating the average expression. |
| Page: 1 |
Top |
Somatic mutation of malignant transformation related genes |
| Annotation of somatic variants for genes involved in malignant transformation |
| Hugo Symbol | Variant Class | Variant Classification | dbSNP RS | HGVSc | HGVSp | HGVSp Short | SWISSPROT | BIOTYPE | SIFT | PolyPhen | Tumor Sample Barcode | Tissue | Histology | Sex | Age | Stage | Therapy Types | Drugs | Outcome |
| TPM3 | SNV | Missense_Mutation | c.157N>T | p.Gly53Trp | p.G53W | P06753 | protein_coding | deleterious(0.02) | possibly_damaging(0.729) | TCGA-D8-A1XR-01 | Breast | breast invasive carcinoma | Female | <65 | I/II | Chemotherapy | adriamycin+cyclophosphamide | SD | |
| TPM3 | SNV | Missense_Mutation | c.200N>T | p.Asp67Val | p.D67V | P06753 | protein_coding | tolerated(0.06) | benign(0.027) | TCGA-E2-A159-01 | Breast | breast invasive carcinoma | Female | <65 | I/II | Chemotherapy | cyclophosphamide | SD | |
| TPM3 | SNV | Missense_Mutation | c.418N>A | p.Glu140Lys | p.E140K | P06753 | protein_coding | deleterious(0) | probably_damaging(0.999) | TCGA-GM-A2D9-01 | Breast | breast invasive carcinoma | Female | >=65 | I/II | Hormone Therapy | arimidex | SD | |
| TPM3 | SNV | Missense_Mutation | novel | c.401N>A | p.Arg134Gln | p.R134Q | P06753 | protein_coding | deleterious(0.02) | possibly_damaging(0.793) | TCGA-UU-A93S-01 | Breast | breast invasive carcinoma | Female | <65 | III/IV | Unknown | Unknown | PD |
| TPM3 | SNV | Missense_Mutation | rs199474711 | c.11N>T | p.Ala4Val | p.A4V | P06753 | protein_coding | deleterious(0) | probably_damaging(0.999) | TCGA-AA-3811-01 | Colorectum | colon adenocarcinoma | Female | >=65 | III/IV | Unknown | Unknown | PD |
| TPM3 | SNV | Missense_Mutation | novel | c.716G>A | p.Arg239His | p.R239H | P06753 | protein_coding | deleterious(0.04) | probably_damaging(1) | TCGA-AA-3864-01 | Colorectum | colon adenocarcinoma | Male | >=65 | I/II | Unknown | Unknown | SD |
| TPM3 | SNV | Missense_Mutation | c.727N>A | p.Ala243Thr | p.A243T | P06753 | protein_coding | deleterious(0.01) | possibly_damaging(0.894) | TCGA-AD-6895-01 | Colorectum | colon adenocarcinoma | Male | >=65 | III/IV | Unknown | Unknown | SD | |
| TPM3 | SNV | Missense_Mutation | novel | c.235G>T | p.Ala79Ser | p.A79S | P06753 | protein_coding | tolerated(0.09) | possibly_damaging(0.782) | TCGA-AZ-4315-01 | Colorectum | colon adenocarcinoma | Male | <65 | I/II | Unknown | Unknown | SD |
| TPM3 | SNV | Missense_Mutation | c.239N>T | p.Ala80Val | p.A80V | P06753 | protein_coding | tolerated(0.08) | benign(0.127) | TCGA-G4-6588-01 | Colorectum | colon adenocarcinoma | Female | <65 | I/II | Unknown | Unknown | SD | |
| TPM3 | SNV | Missense_Mutation | novel | c.499N>A | p.Ala167Thr | p.A167T | P06753 | protein_coding | deleterious(0.01) | benign(0.422) | TCGA-AJ-A3BG-01 | Endometrium | uterine corpus endometrioid carcinoma | Female | >=65 | I/II | Chemotherapy | carboplatin | PD |
| Page: 1 2 3 |
Top |
Related drugs of malignant transformation related genes |
| Identification of chemicals and drugs interact with genes involved in malignant transfromation |
| (DGIdb 4.0) |
| Entrez ID | Symbol | Category | Interaction Types | Drug Claim Name | Drug Name | PMIDs |
| 7170 | TPM3 | KINASE, CLINICALLY ACTIONABLE | METHOTREXATE | METHOTREXATE | 8509220 | |
| 7170 | TPM3 | KINASE, CLINICALLY ACTIONABLE | EPINEPHRINE | EPINEPHRINE | 18172836 | |
| 7170 | TPM3 | KINASE, CLINICALLY ACTIONABLE | AMINOGLYCOSIDES | 15164360 | ||
| 7170 | TPM3 | KINASE, CLINICALLY ACTIONABLE | ACTH | CORTICOTROPIN | 17877367 | |
| 7170 | TPM3 | KINASE, CLINICALLY ACTIONABLE | PROGESTERONE | PROGESTERONE | 17549730 | |
| 7170 | TPM3 | KINASE, CLINICALLY ACTIONABLE | EO9 | APAZIQUONE | 8509220 | |
| 7170 | TPM3 | KINASE, CLINICALLY ACTIONABLE | MIDAZOLAM | MIDAZOLAM | 16738805 | |
| 7170 | TPM3 | KINASE, CLINICALLY ACTIONABLE | SIMVASTATIN | SIMVASTATIN | 10720627 | |
| 7170 | TPM3 | KINASE, CLINICALLY ACTIONABLE | UVB | 9270028 | ||
| 7170 | TPM3 | KINASE, CLINICALLY ACTIONABLE | 6-THIOGUANINE | THIOGUANINE | 7687657 |
| Page: 1 2 |

Copyright 2023-Present -The University of Texas Health Science Center at Houston |