
|
|||||
|
 | |
| |
| |
| |
| |
| |
|
Gene: TPM2 |
Gene summary for TPM2 |
| Gene information | Species | Human | Gene symbol | TPM2 | Gene ID | 7169 |
| Gene name | tropomyosin 2 | |
| Gene Alias | AMCD1 | |
| Cytomap | 9p13.3 | |
| Gene Type | protein-coding | GO ID | GO:0003008 | UniProtAcc | Q5TCU3 |
Top |
Malignant transformation analysis |
| Identification of the aberrant gene expression in precancerous and cancerous lesions by comparing the gene expression of stem-like cells in diseased tissues with normal stem cells |
| Entrez ID | Symbol | Replicates | Species | Organ | Tissue | Adj P-value | Log2FC | Malignancy |
| 7169 | TPM2 | GSM4909281 | Human | Breast | IDC | 1.86e-73 | 1.28e+00 | 0.21 |
| 7169 | TPM2 | GSM4909282 | Human | Breast | IDC | 2.51e-42 | 9.08e-01 | -0.0288 |
| 7169 | TPM2 | GSM4909286 | Human | Breast | IDC | 4.07e-08 | 2.67e-01 | 0.1081 |
| 7169 | TPM2 | GSM4909287 | Human | Breast | IDC | 5.78e-04 | 3.84e-01 | 0.2057 |
| 7169 | TPM2 | GSM4909294 | Human | Breast | IDC | 2.10e-07 | -1.85e-01 | 0.2022 |
| 7169 | TPM2 | GSM4909295 | Human | Breast | IDC | 2.52e-06 | 5.65e-01 | 0.0898 |
| 7169 | TPM2 | GSM4909296 | Human | Breast | IDC | 1.69e-06 | -2.04e-01 | 0.1524 |
| 7169 | TPM2 | GSM4909297 | Human | Breast | IDC | 1.50e-05 | -1.93e-01 | 0.1517 |
| 7169 | TPM2 | GSM4909301 | Human | Breast | IDC | 7.69e-06 | -2.04e-01 | 0.1577 |
| 7169 | TPM2 | GSM4909304 | Human | Breast | IDC | 3.18e-06 | -2.08e-01 | 0.1636 |
| 7169 | TPM2 | GSM4909311 | Human | Breast | IDC | 1.27e-07 | -1.23e-01 | 0.1534 |
| 7169 | TPM2 | GSM4909312 | Human | Breast | IDC | 1.08e-06 | -2.14e-01 | 0.1552 |
| 7169 | TPM2 | GSM4909315 | Human | Breast | IDC | 4.62e-05 | -2.11e-01 | 0.21 |
| 7169 | TPM2 | GSM4909319 | Human | Breast | IDC | 2.43e-06 | -1.99e-01 | 0.1563 |
| 7169 | TPM2 | GSM4909321 | Human | Breast | IDC | 8.04e-10 | -2.23e-01 | 0.1559 |
| 7169 | TPM2 | brca3 | Human | Breast | Precancer | 1.14e-05 | 2.56e-01 | -0.0263 |
| 7169 | TPM2 | P1 | Human | Breast | IDC | 2.86e-03 | -1.95e-01 | 0.1527 |
| 7169 | TPM2 | P2 | Human | Breast | IDC | 7.53e-04 | -2.23e-01 | 0.21 |
| 7169 | TPM2 | DCIS2 | Human | Breast | DCIS | 3.43e-14 | 4.48e-03 | 0.0085 |
| 7169 | TPM2 | sample1 | Human | Cervix | CC | 3.33e-10 | 6.26e-01 | 0.0959 |
| Page: 1 2 3 4 5 6 7 8 |
| Tissue | Expression Dynamics | Abbreviation |
| Breast | 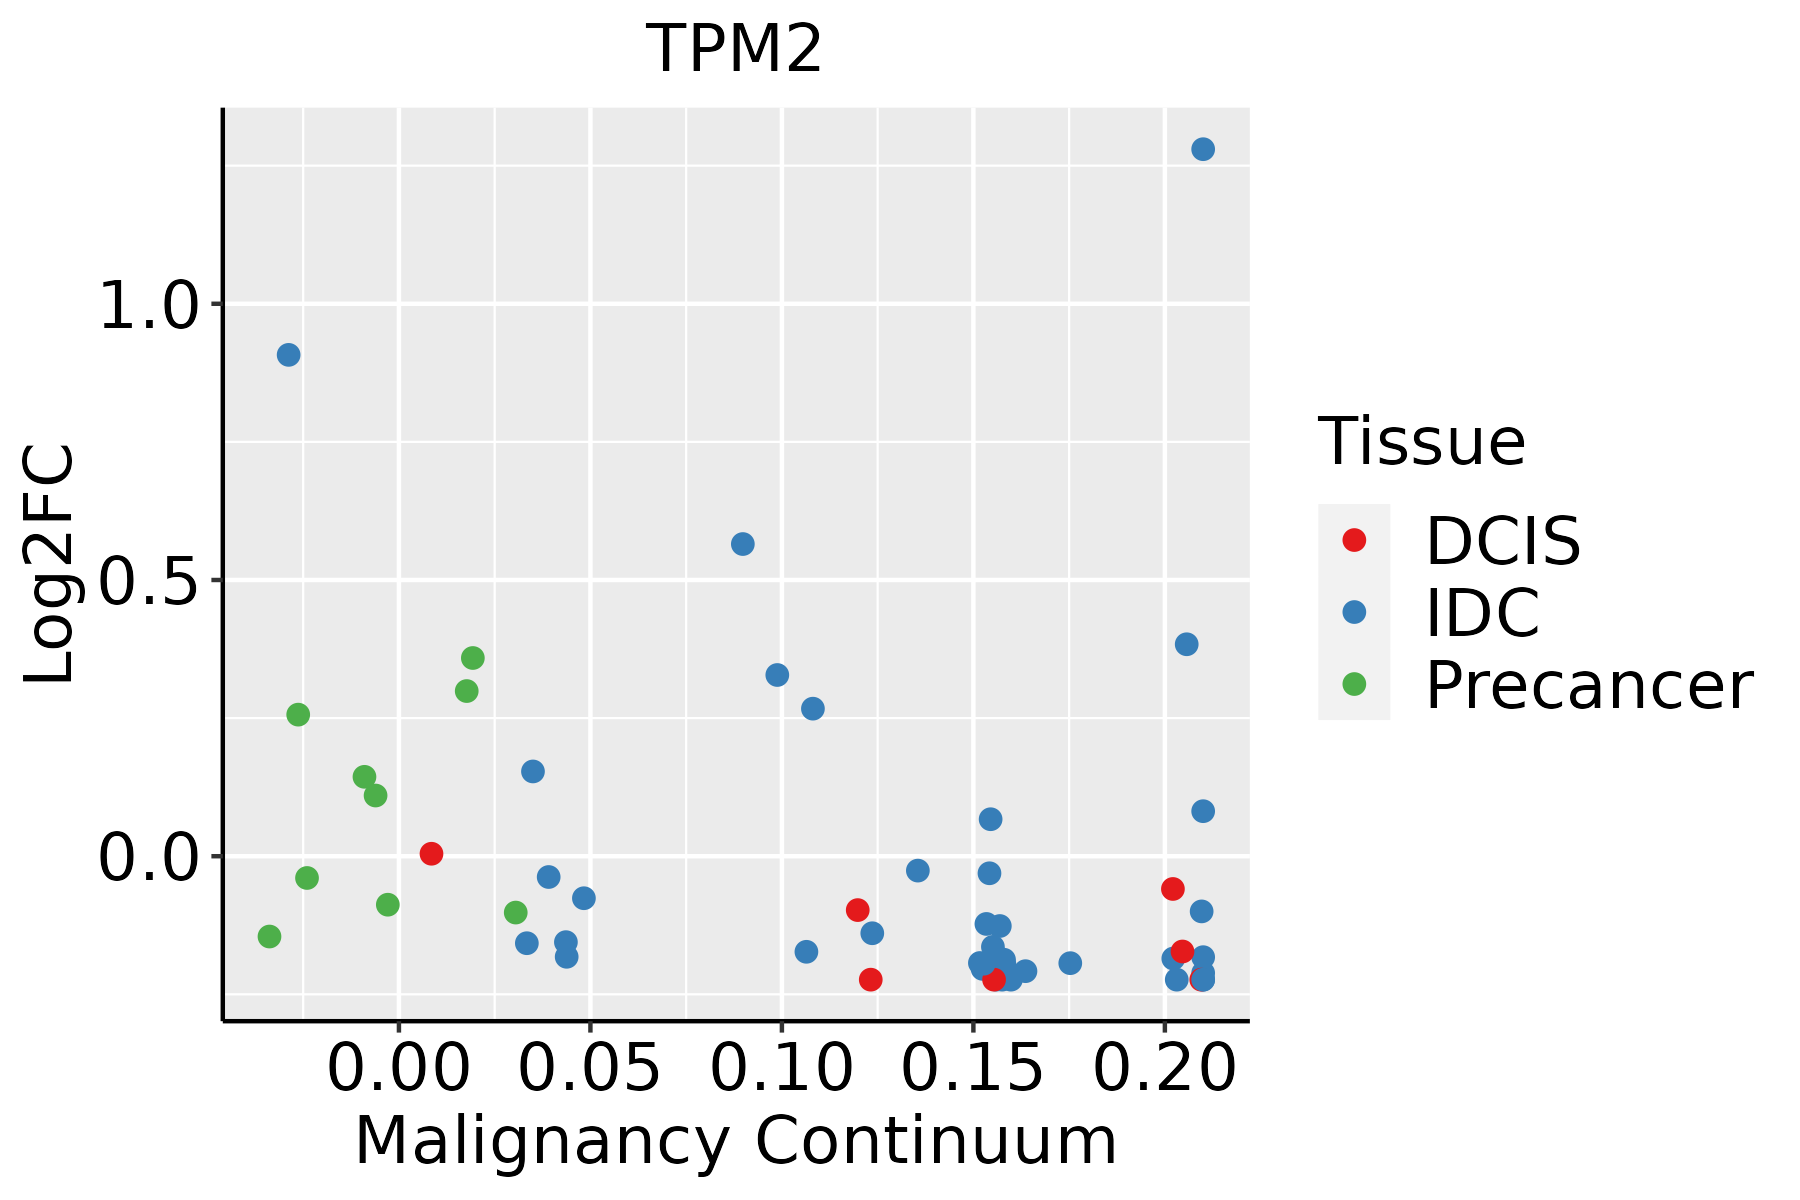 | IDC: Invasive ductal carcinoma |
| DCIS: Ductal carcinoma in situ | ||
| Precancer(BRCA1-mut): Precancerous lesion from BRCA1 mutation carriers | ||
| Cervix | 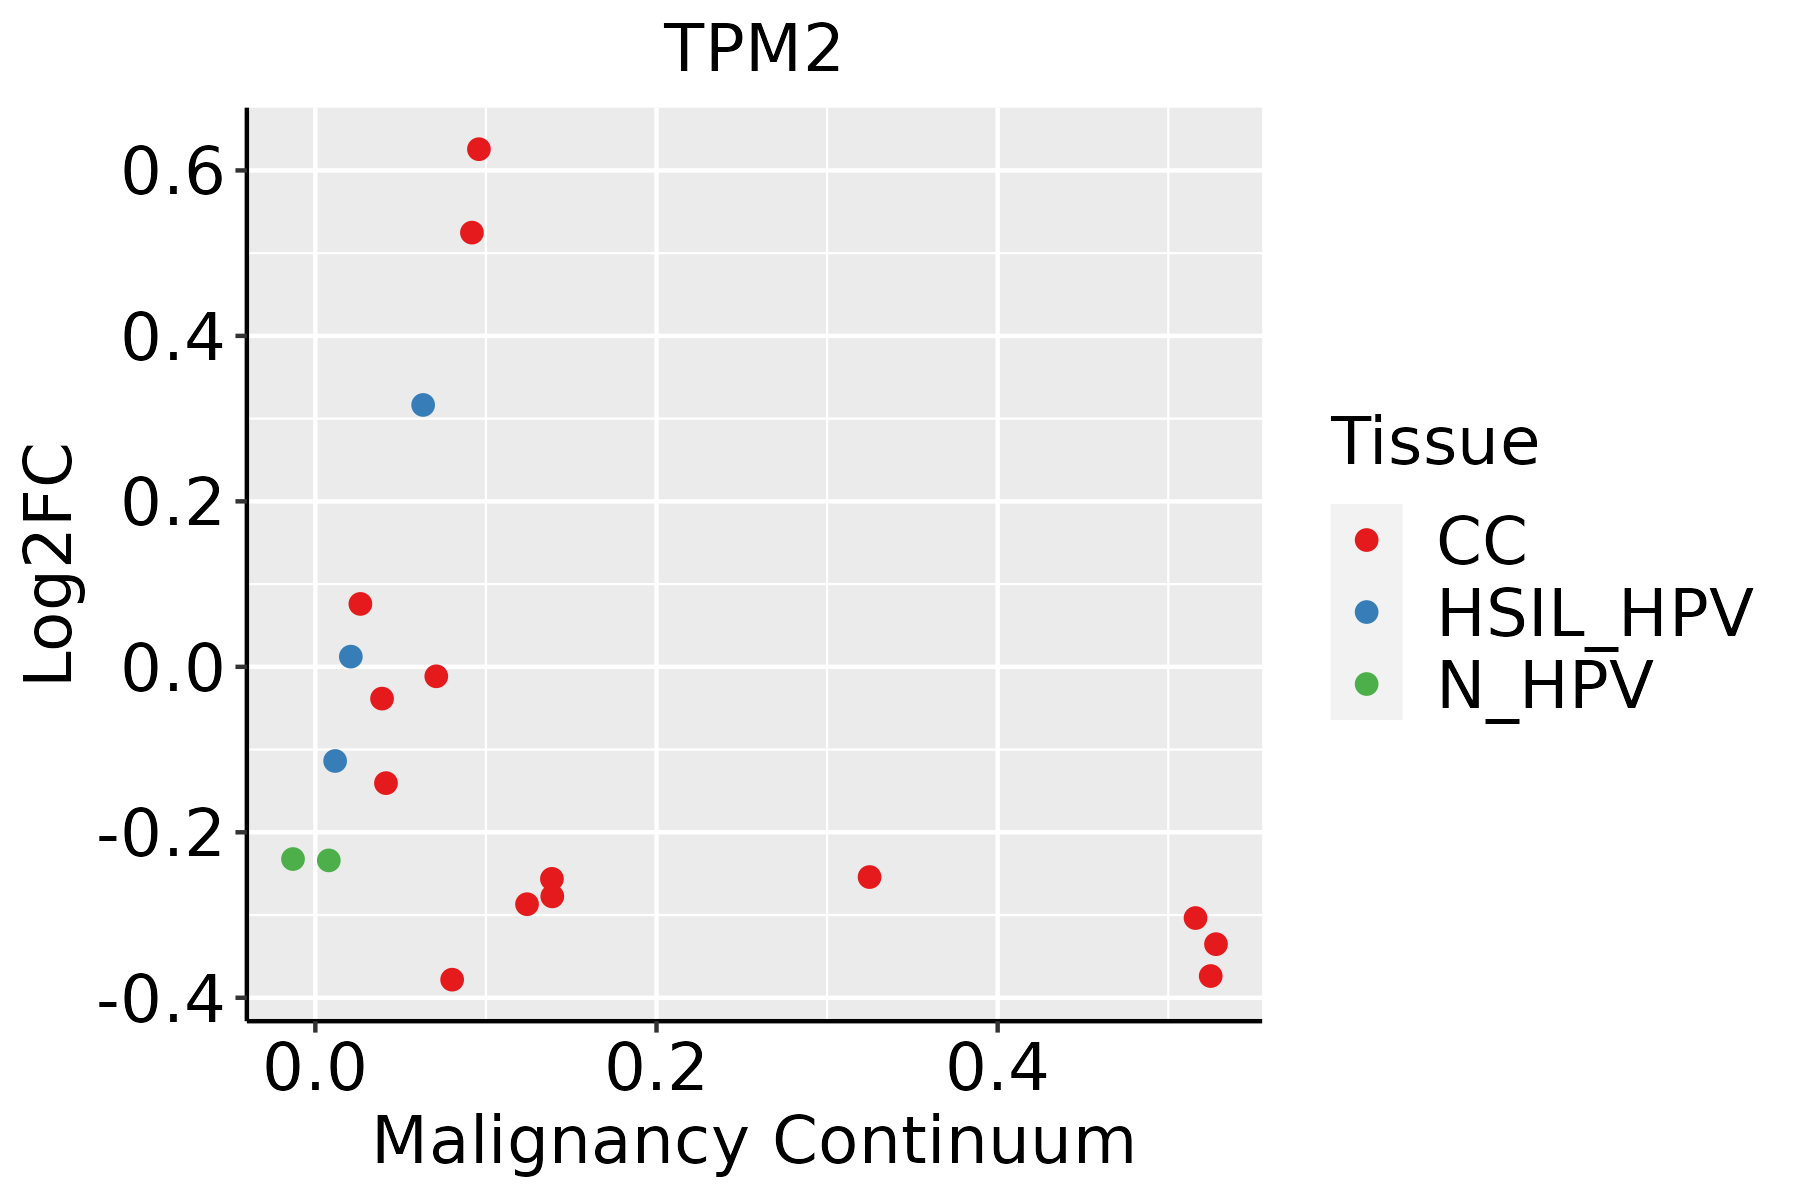 | CC: Cervix cancer |
| HSIL_HPV: HPV-infected high-grade squamous intraepithelial lesions | ||
| N_HPV: HPV-infected normal cervix | ||
| Endometrium | 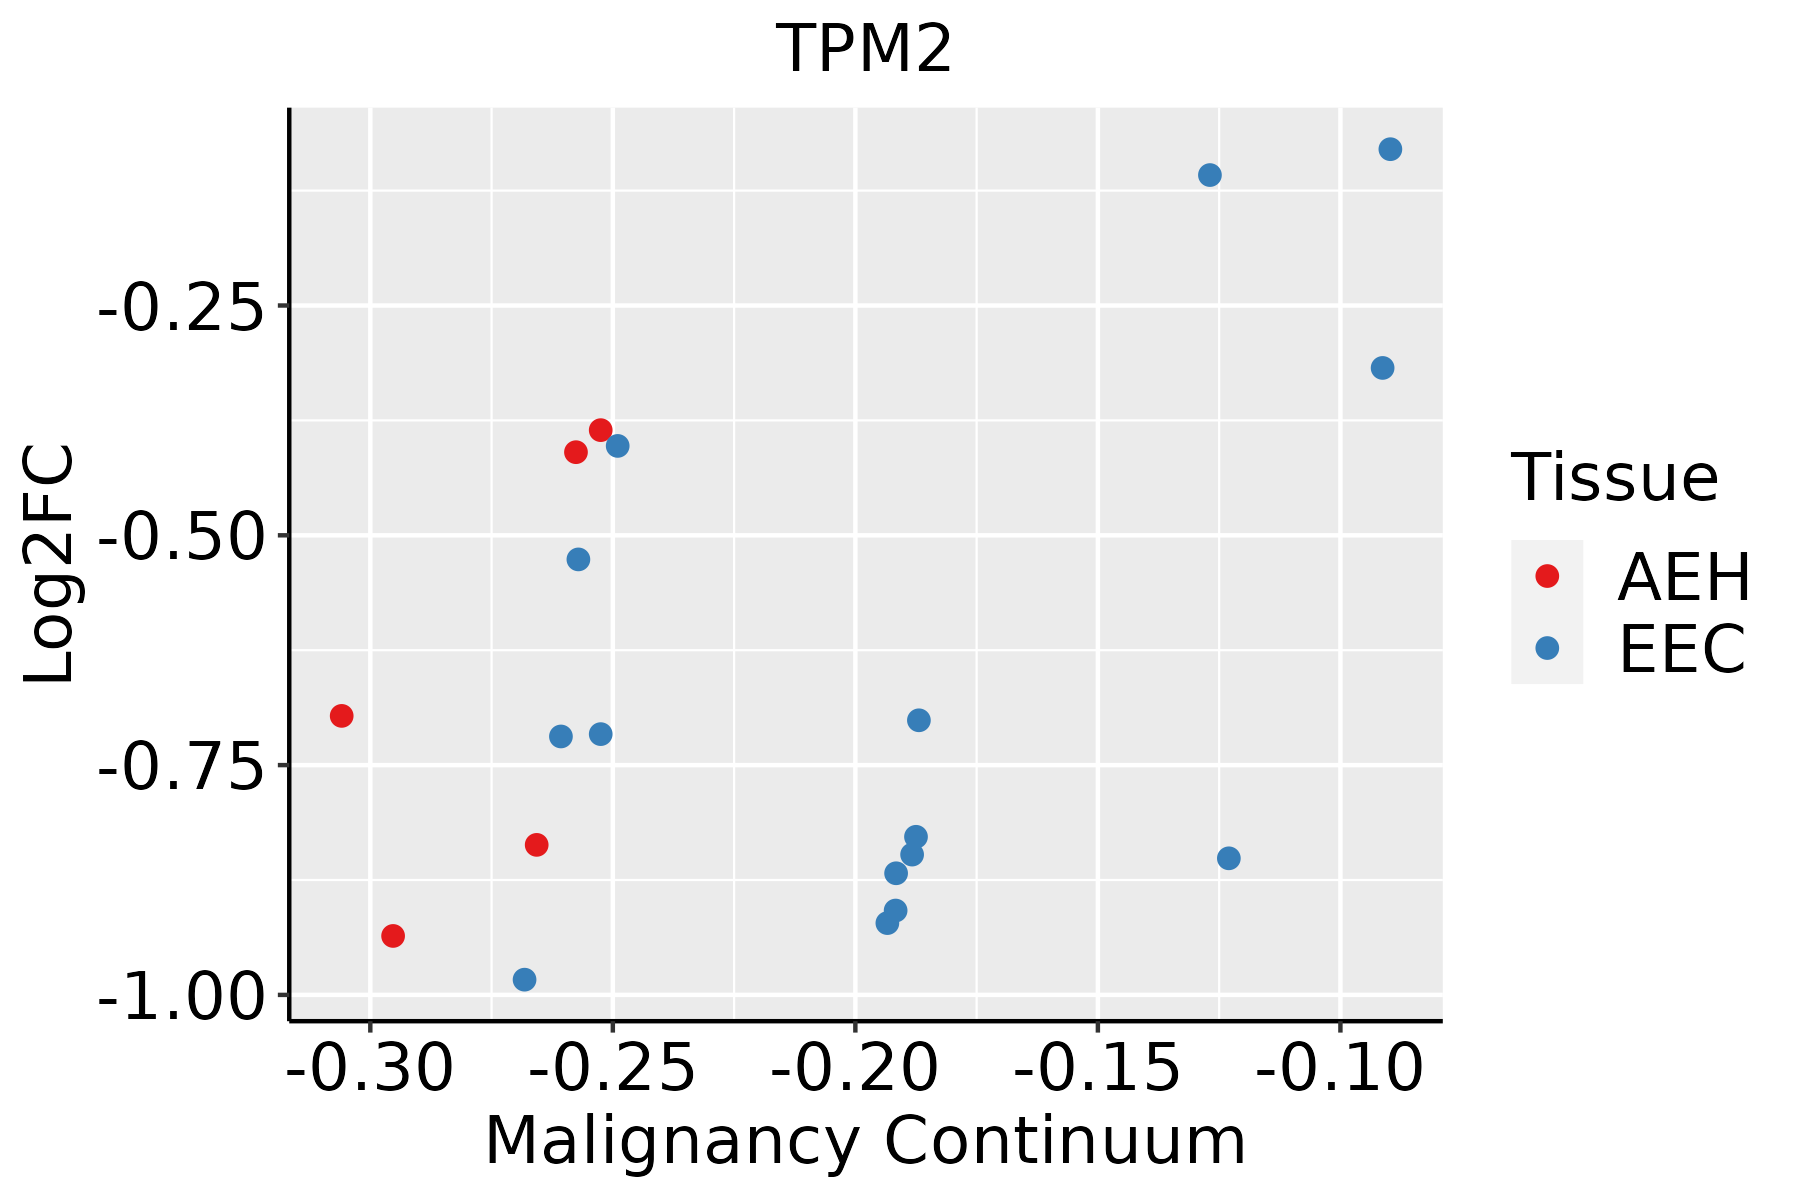 | AEH: Atypical endometrial hyperplasia |
| EEC: Endometrioid Cancer | ||
| Esophagus |  | ESCC: Esophageal squamous cell carcinoma |
| HGIN: High-grade intraepithelial neoplasias | ||
| LGIN: Low-grade intraepithelial neoplasias | ||
| GC | 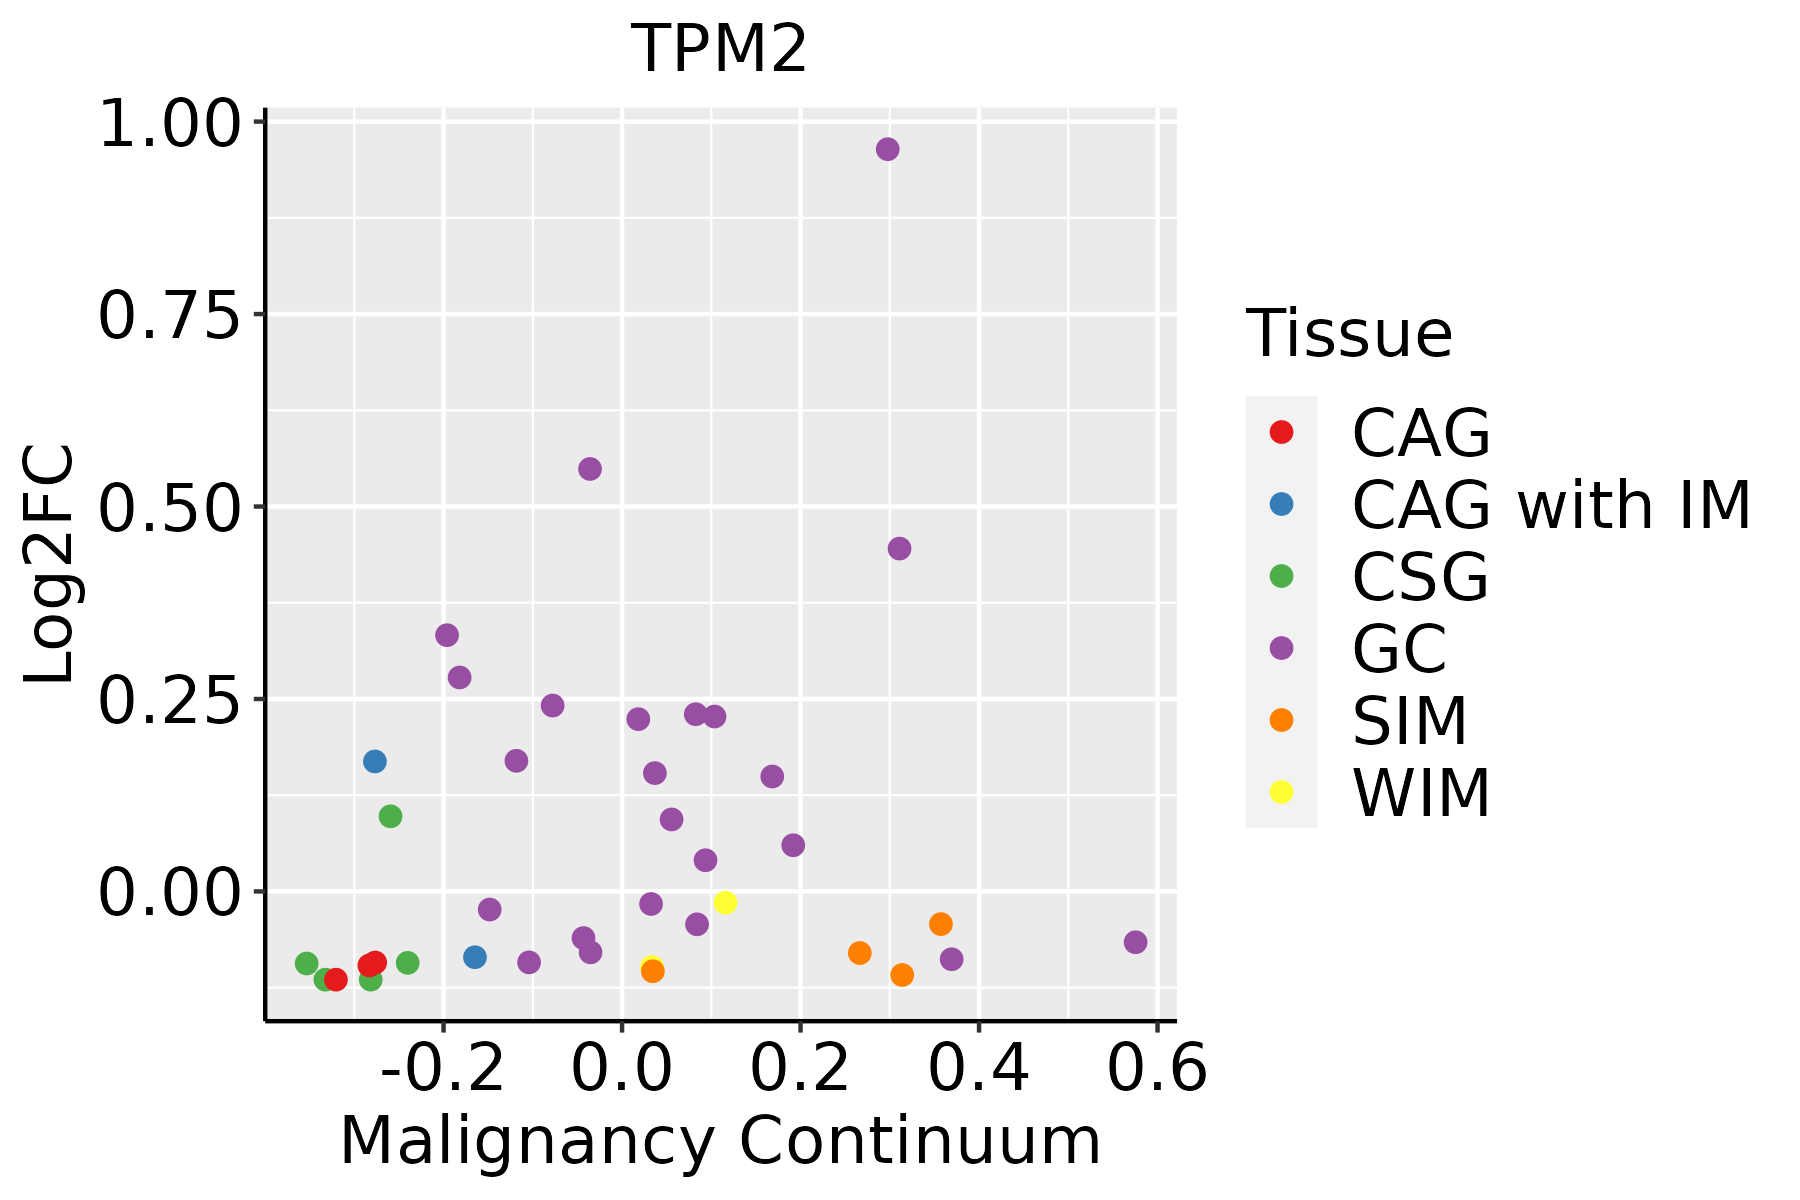 | CAG: Chronic atrophic gastritis |
| CAG with IM: Chronic atrophic gastritis with intestinal metaplasia | ||
| CSG: Chronic superficial gastritis | ||
| GC: Gastric cancer | ||
| SIM: Severe intestinal metaplasia | ||
| WIM: Wild intestinal metaplasia | ||
| Liver | 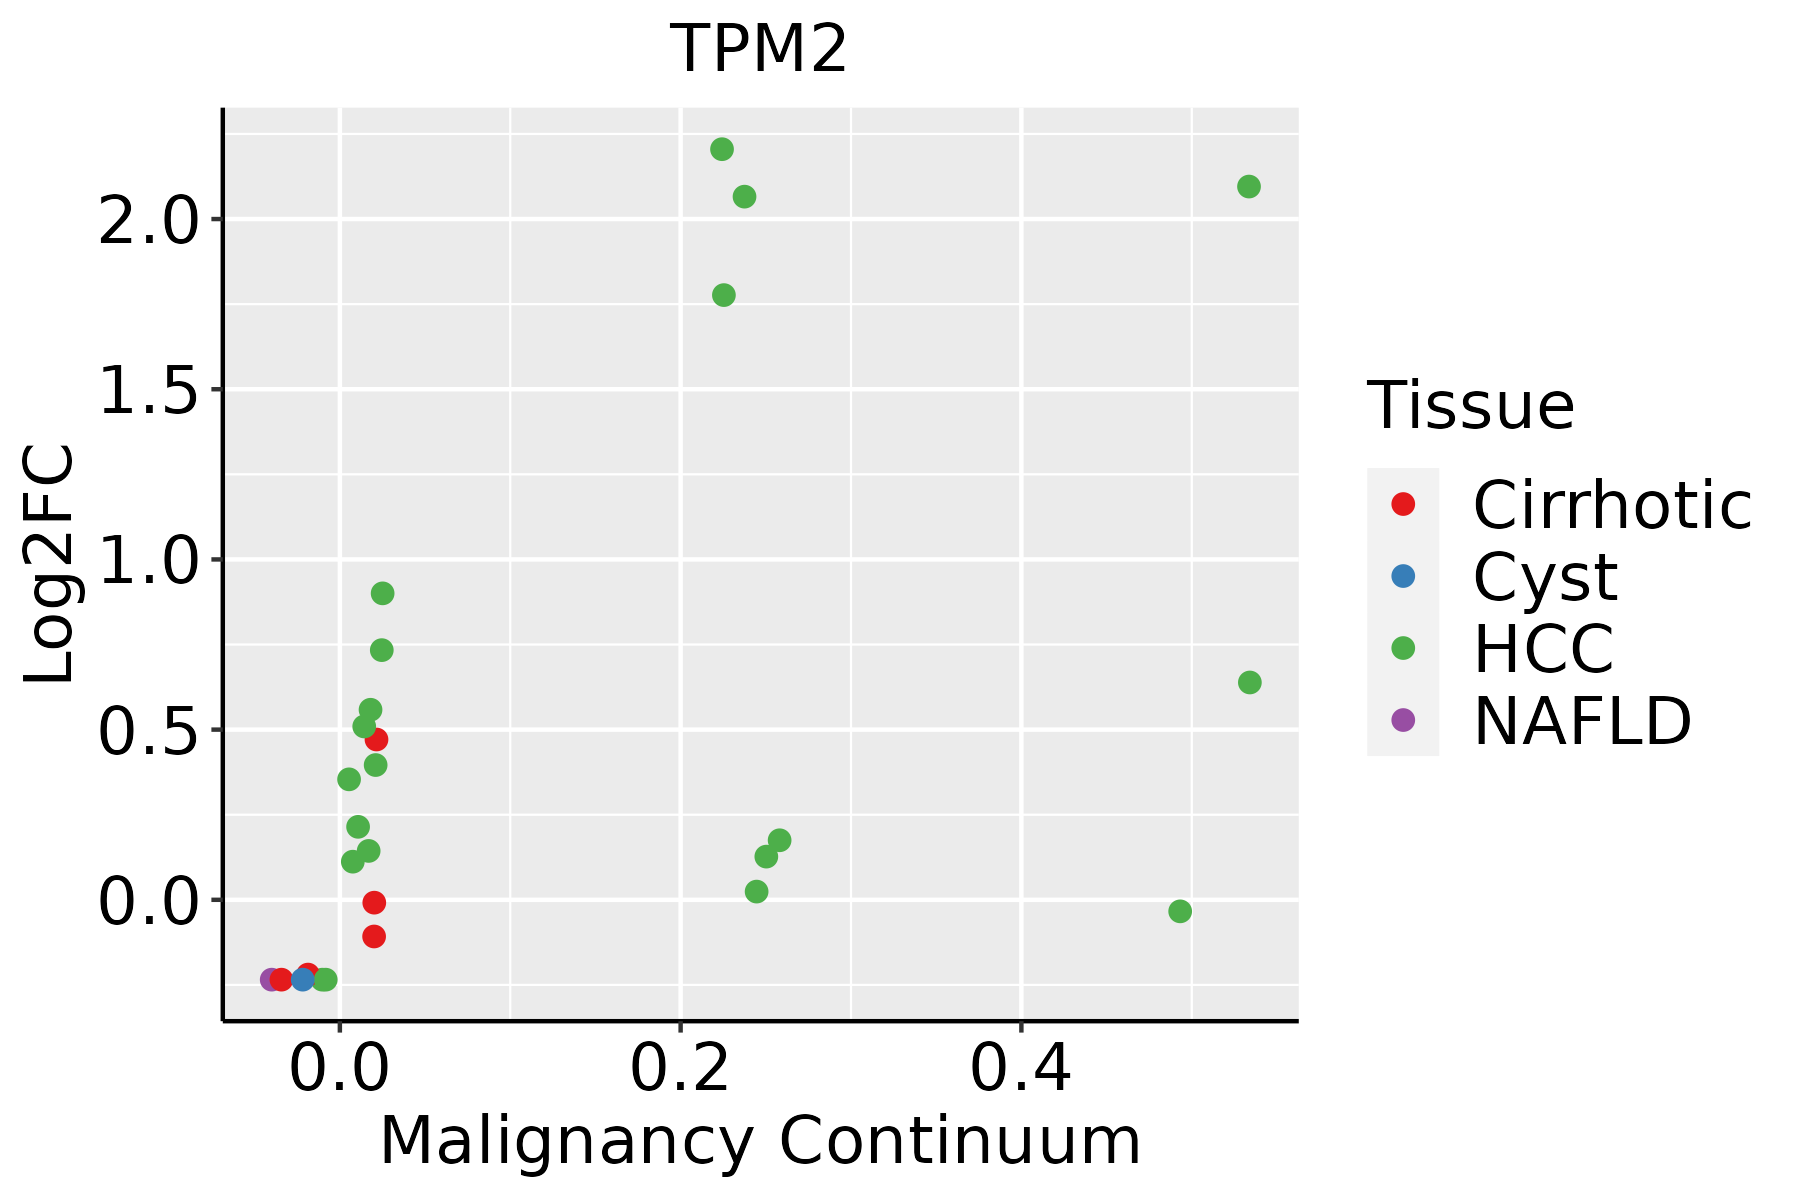 | HCC: Hepatocellular carcinoma |
| NAFLD: Non-alcoholic fatty liver disease | ||
| Oral Cavity | 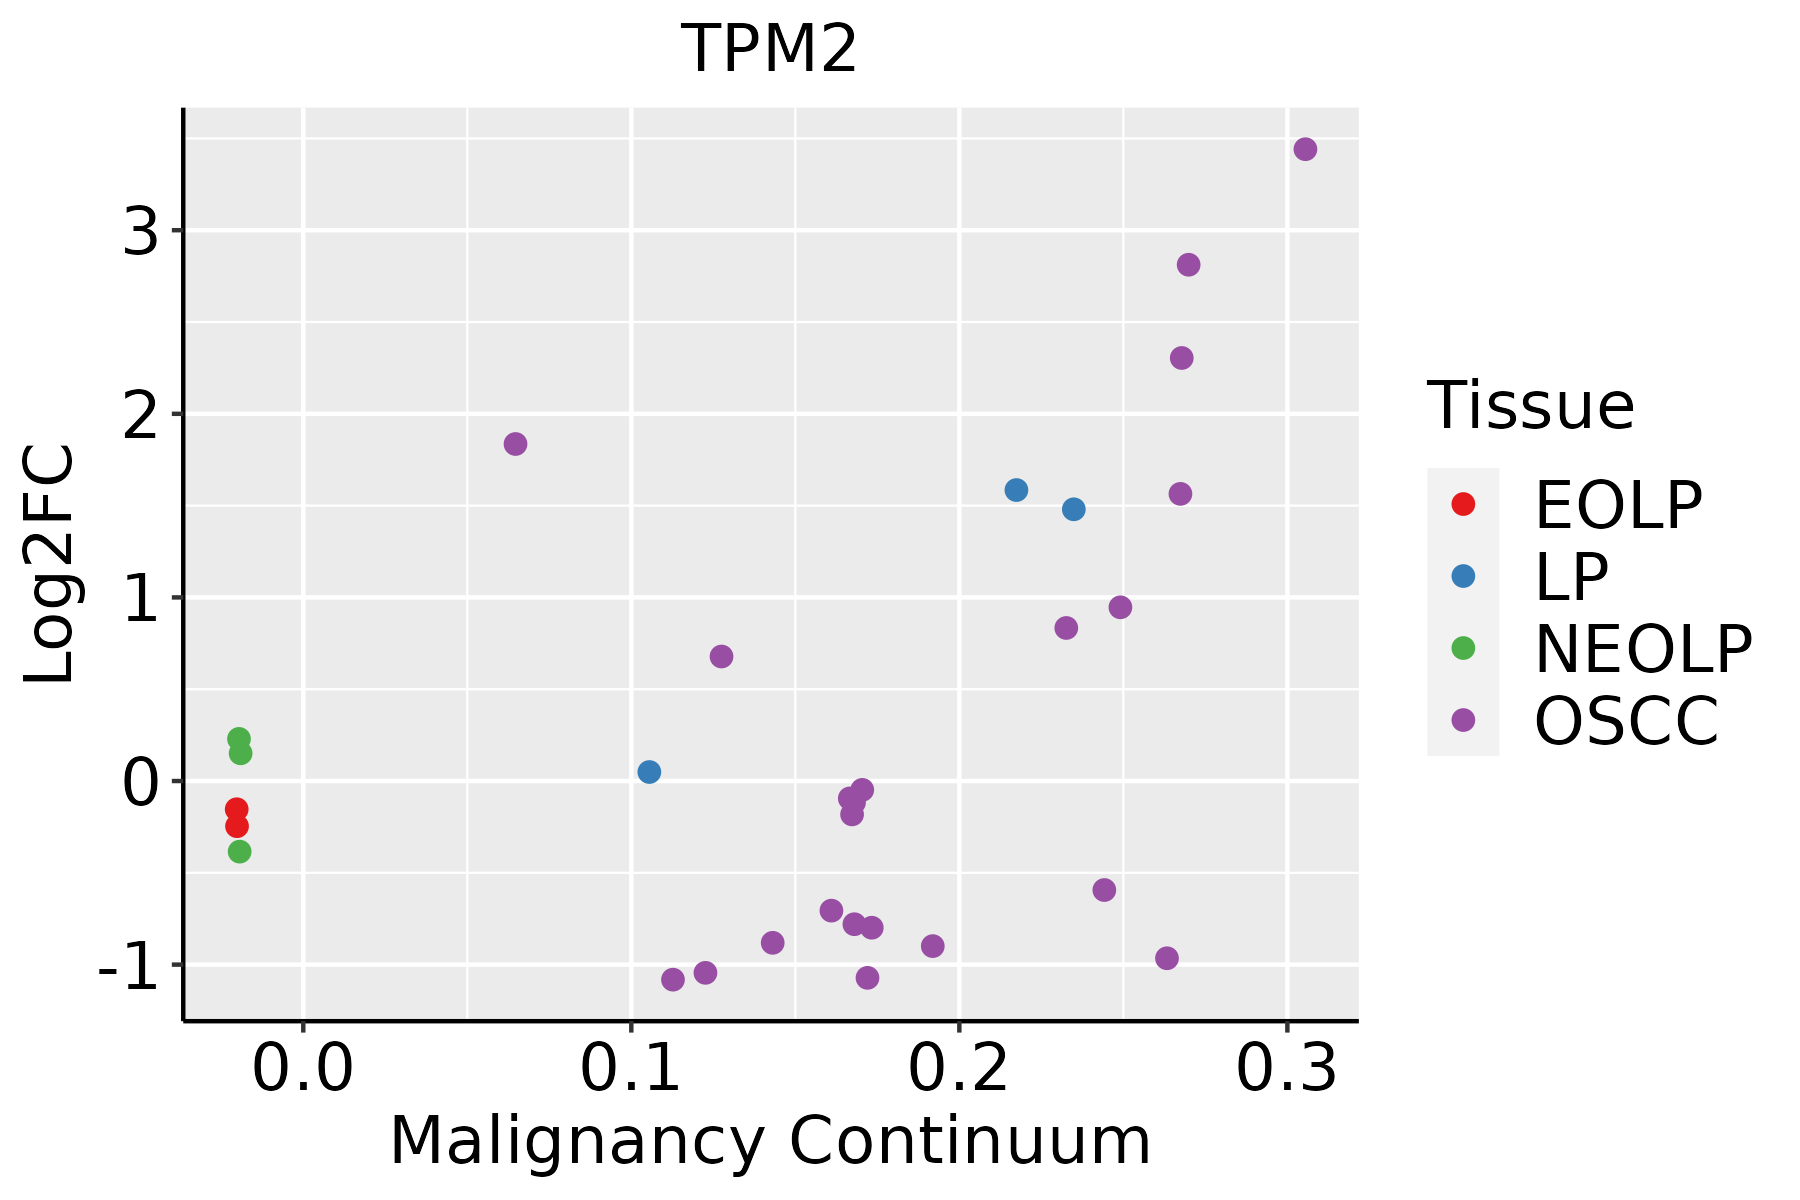 | EOLP: Erosive Oral lichen planus |
| LP: leukoplakia | ||
| NEOLP: Non-erosive oral lichen planus | ||
| OSCC: Oral squamous cell carcinoma | ||
| Skin | 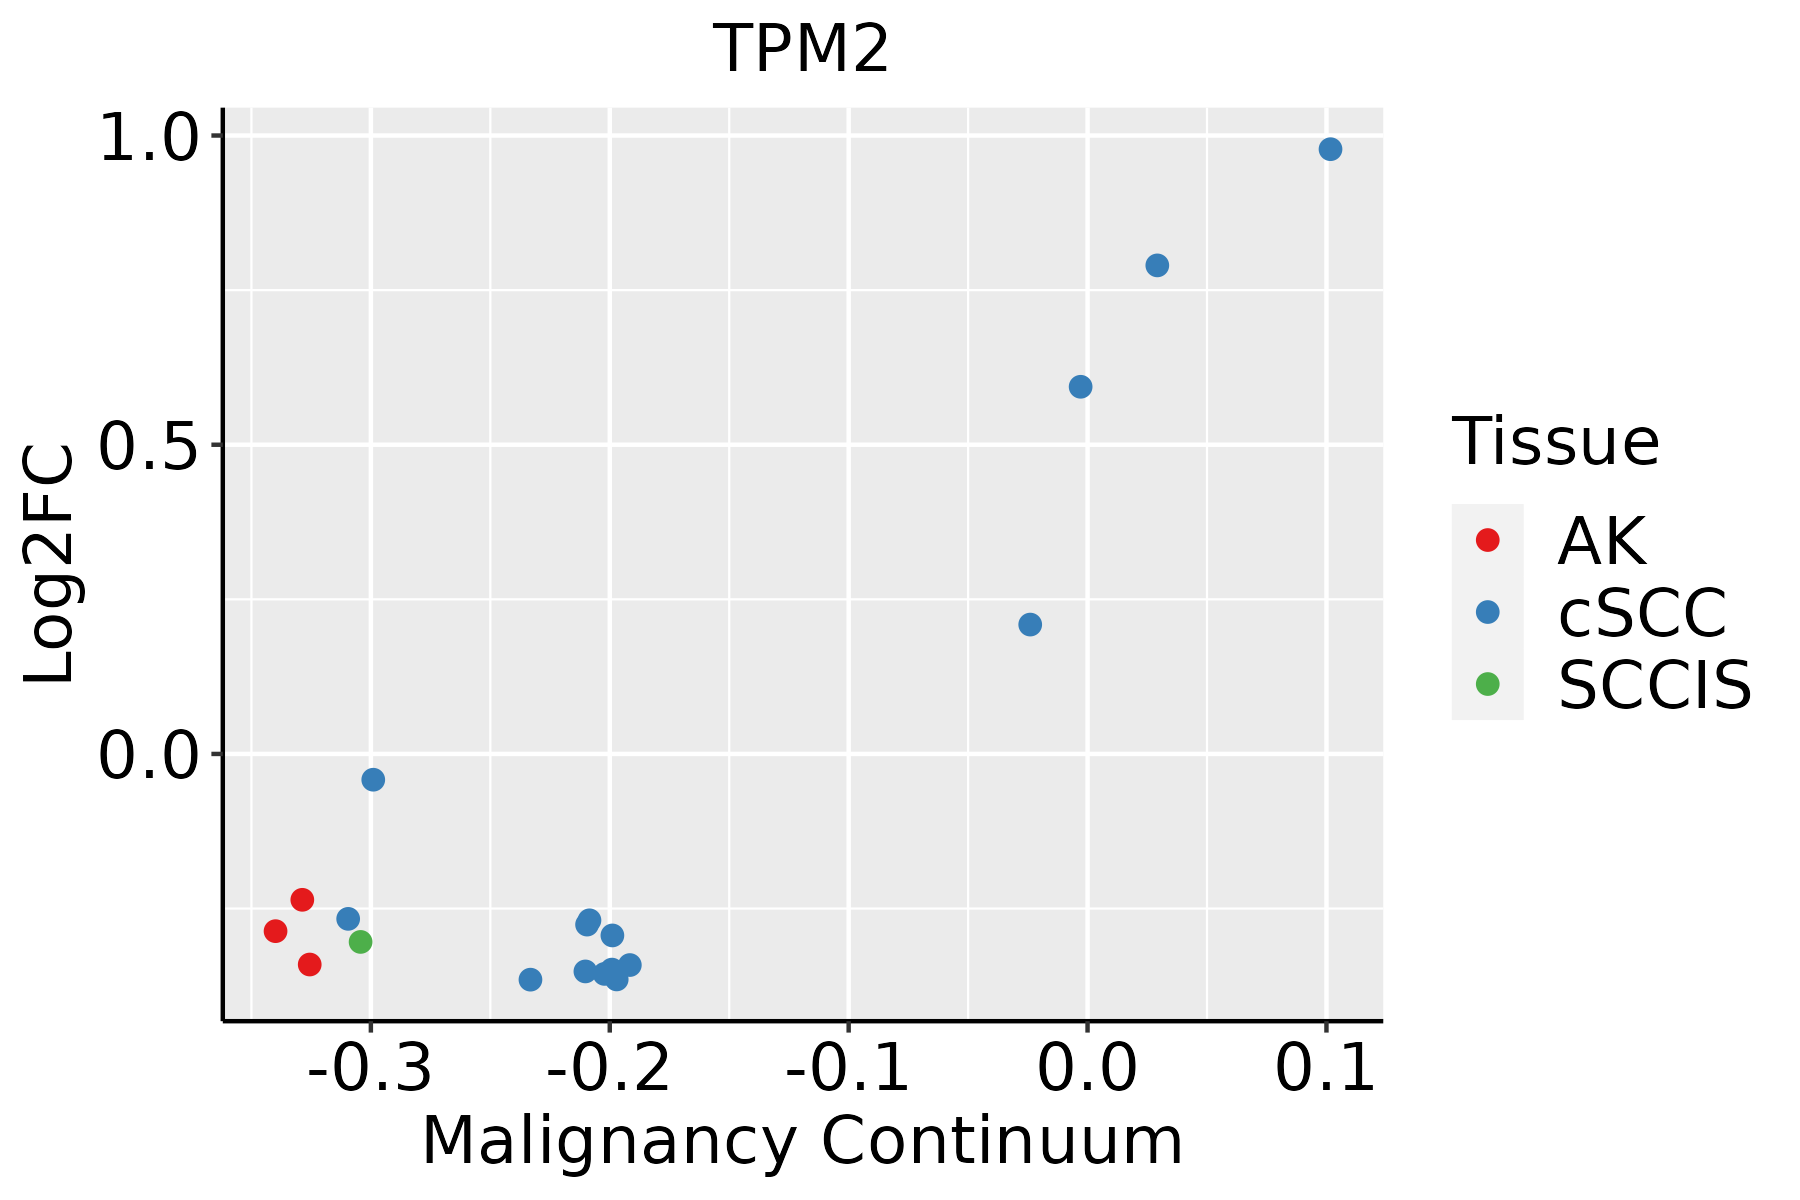 | AK: Actinic keratosis |
| cSCC: Cutaneous squamous cell carcinoma | ||
| SCCIS:squamous cell carcinoma in situ | ||
| Thyroid | 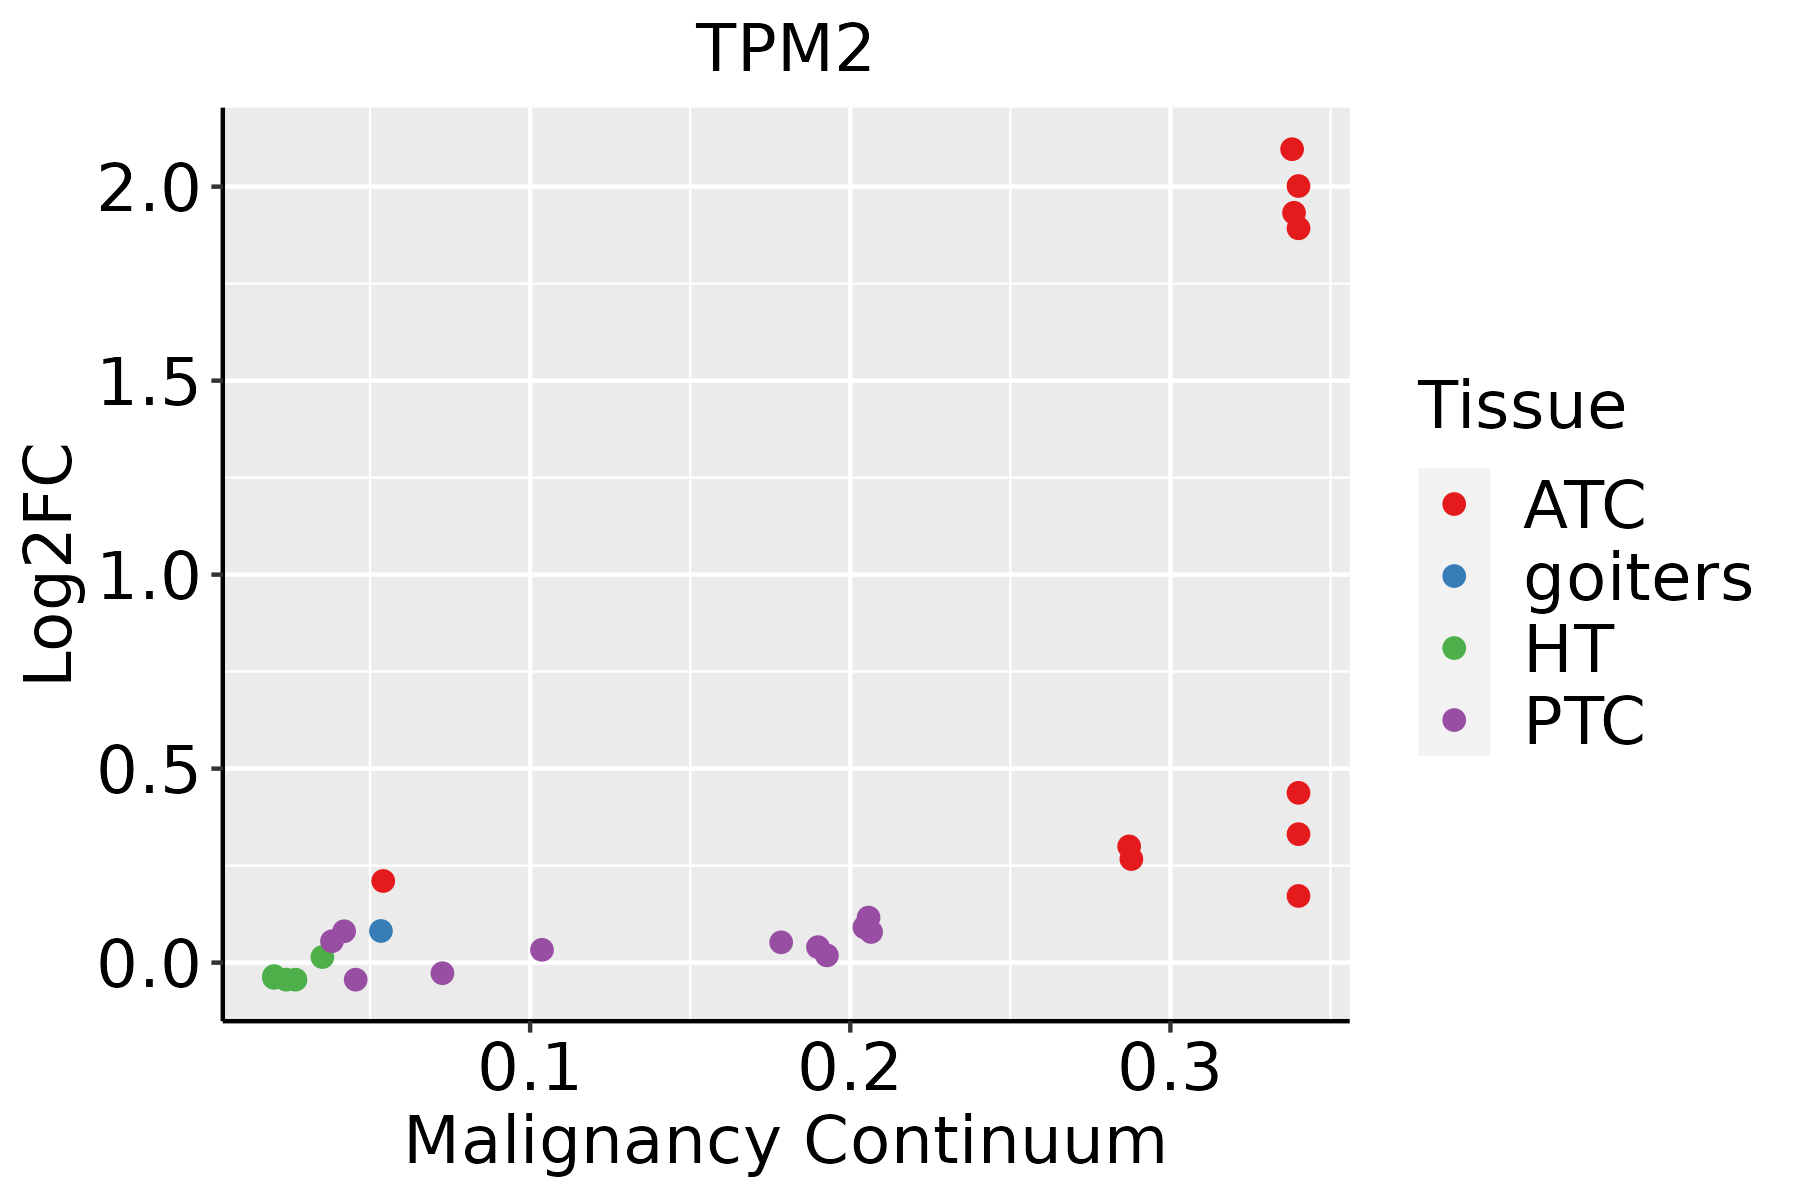 | ATC: Anaplastic thyroid cancer |
| HT: Hashimoto's thyroiditis | ||
| PTC: Papillary thyroid cancer |
| ∗log2FC in expression of this searched gene in stem-like cells from each diseased tissue sample relative to stem-like cells in normal samples in each tissue plotted against the malignancy continuum. Samples are colored based on if they are from different disease stage. |
Top |
Malignant transformation related pathway analysis |
| Find out the enriched GO biological processes and KEGG pathways involved in transition from healthy to precancer to cancer |
| Tissue | Disease Stage | Enriched GO biological Processes |
| Colorectum | AD |  |
| Colorectum | SER |  |
| Colorectum | MSS |  |
| Colorectum | MSI-H |  |
| Colorectum | FAP |  |
| ∗Top 15 enriched GO BP terms are showed in the bar plot of each disease state in each tissue. Each row represents a significant GO biological process which is colored according to the -log10(p.adjust). |
| Page: 1 2 3 4 5 6 7 8 9 |
| GO ID | Tissue | Disease Stage | Description | Gene Ratio | Bg Ratio | pvalue | p.adjust | Count |
| GO:00434624 | Breast | Precancer | regulation of ATPase activity | 10/1080 | 46/18723 | 2.38e-04 | 3.57e-03 | 10 |
| GO:00070159 | Breast | Precancer | actin filament organization | 44/1080 | 442/18723 | 3.02e-04 | 4.35e-03 | 44 |
| GO:004346212 | Breast | IDC | regulation of ATPase activity | 12/1434 | 46/18723 | 1.31e-04 | 2.37e-03 | 12 |
| GO:000701514 | Breast | IDC | actin filament organization | 55/1434 | 442/18723 | 2.45e-04 | 3.84e-03 | 55 |
| GO:00030125 | Breast | IDC | muscle system process | 50/1434 | 452/18723 | 5.52e-03 | 4.05e-02 | 50 |
| GO:000701524 | Breast | DCIS | actin filament organization | 56/1390 | 442/18723 | 5.90e-05 | 1.19e-03 | 56 |
| GO:004346221 | Breast | DCIS | regulation of ATPase activity | 12/1390 | 46/18723 | 9.70e-05 | 1.78e-03 | 12 |
| GO:000301212 | Breast | DCIS | muscle system process | 50/1390 | 452/18723 | 3.02e-03 | 2.57e-02 | 50 |
| GO:000701510 | Cervix | CC | actin filament organization | 109/2311 | 442/18723 | 4.92e-13 | 2.45e-10 | 109 |
| GO:000701515 | Cervix | HSIL_HPV | actin filament organization | 43/737 | 442/18723 | 4.77e-08 | 3.59e-06 | 43 |
| GO:000701516 | Endometrium | AEH | actin filament organization | 98/2100 | 442/18723 | 1.99e-11 | 2.98e-09 | 98 |
| GO:00030126 | Endometrium | AEH | muscle system process | 78/2100 | 452/18723 | 6.89e-05 | 1.06e-03 | 78 |
| GO:0006936 | Endometrium | AEH | muscle contraction | 59/2100 | 347/18723 | 7.32e-04 | 6.99e-03 | 59 |
| GO:000701517 | Endometrium | EEC | actin filament organization | 95/2168 | 442/18723 | 1.31e-09 | 1.09e-07 | 95 |
| GO:000301213 | Endometrium | EEC | muscle system process | 79/2168 | 452/18723 | 1.16e-04 | 1.55e-03 | 79 |
| GO:00069361 | Endometrium | EEC | muscle contraction | 59/2168 | 347/18723 | 1.57e-03 | 1.26e-02 | 59 |
| GO:000701527 | Esophagus | ESCC | actin filament organization | 259/8552 | 442/18723 | 2.37e-08 | 4.50e-07 | 259 |
| GO:00434627 | Esophagus | ESCC | regulation of ATPase activity | 30/8552 | 46/18723 | 5.91e-03 | 2.18e-02 | 30 |
| GO:000701512 | Liver | Cirrhotic | actin filament organization | 171/4634 | 442/18723 | 3.93e-11 | 2.30e-09 | 171 |
| GO:00434623 | Liver | Cirrhotic | regulation of ATPase activity | 21/4634 | 46/18723 | 1.61e-03 | 1.04e-02 | 21 |
| Page: 1 2 |
| Pathway ID | Tissue | Disease Stage | Description | Gene Ratio | Bg Ratio | pvalue | p.adjust | qvalue | Count |
| hsa0426016 | Breast | Precancer | Cardiac muscle contraction | 22/684 | 87/8465 | 9.72e-07 | 1.62e-05 | 1.24e-05 | 22 |
| hsa0426017 | Breast | Precancer | Cardiac muscle contraction | 22/684 | 87/8465 | 9.72e-07 | 1.62e-05 | 1.24e-05 | 22 |
| hsa0426022 | Breast | IDC | Cardiac muscle contraction | 23/867 | 87/8465 | 1.39e-05 | 1.61e-04 | 1.21e-04 | 23 |
| hsa0426032 | Breast | IDC | Cardiac muscle contraction | 23/867 | 87/8465 | 1.39e-05 | 1.61e-04 | 1.21e-04 | 23 |
| hsa0426020 | Endometrium | AEH | Cardiac muscle contraction | 27/1197 | 87/8465 | 3.93e-05 | 3.99e-04 | 2.92e-04 | 27 |
| hsa048144 | Endometrium | AEH | Motor proteins | 42/1197 | 193/8465 | 2.41e-03 | 1.42e-02 | 1.04e-02 | 42 |
| hsa04260110 | Endometrium | AEH | Cardiac muscle contraction | 27/1197 | 87/8465 | 3.93e-05 | 3.99e-04 | 2.92e-04 | 27 |
| hsa0481411 | Endometrium | AEH | Motor proteins | 42/1197 | 193/8465 | 2.41e-03 | 1.42e-02 | 1.04e-02 | 42 |
| hsa0426023 | Endometrium | EEC | Cardiac muscle contraction | 28/1237 | 87/8465 | 2.49e-05 | 2.73e-04 | 2.03e-04 | 28 |
| hsa048142 | Endometrium | EEC | Motor proteins | 42/1237 | 193/8465 | 4.43e-03 | 2.39e-02 | 1.78e-02 | 42 |
| hsa0426033 | Endometrium | EEC | Cardiac muscle contraction | 28/1237 | 87/8465 | 2.49e-05 | 2.73e-04 | 2.03e-04 | 28 |
| hsa048143 | Endometrium | EEC | Motor proteins | 42/1237 | 193/8465 | 4.43e-03 | 2.39e-02 | 1.78e-02 | 42 |
| hsa0426026 | Oral cavity | EOLP | Cardiac muscle contraction | 22/1218 | 87/8465 | 4.93e-03 | 1.53e-02 | 9.03e-03 | 22 |
| hsa04260112 | Oral cavity | EOLP | Cardiac muscle contraction | 22/1218 | 87/8465 | 4.93e-03 | 1.53e-02 | 9.03e-03 | 22 |
| hsa0426027 | Oral cavity | NEOLP | Cardiac muscle contraction | 23/1112 | 87/8465 | 6.36e-04 | 3.43e-03 | 2.16e-03 | 23 |
| hsa048145 | Oral cavity | NEOLP | Motor proteins | 37/1112 | 193/8465 | 1.06e-02 | 3.54e-02 | 2.22e-02 | 37 |
| hsa0426035 | Oral cavity | NEOLP | Cardiac muscle contraction | 23/1112 | 87/8465 | 6.36e-04 | 3.43e-03 | 2.16e-03 | 23 |
| hsa0481412 | Oral cavity | NEOLP | Motor proteins | 37/1112 | 193/8465 | 1.06e-02 | 3.54e-02 | 2.22e-02 | 37 |
| Page: 1 |
Top |
Cell-cell communication analysis |
| Identification of potential cell-cell interactions between two cell types and their ligand-receptor pairs for different disease states |
| Ligand | Receptor | LRpair | Pathway | Tissue | Disease Stage |
| Page: 1 |
Top |
Single-cell gene regulatory network inference analysis |
| Find out the significant the regulons (TFs) and the target genes of each regulon across cell types for different disease states |
| TF | Cell Type | Tissue | Disease Stage | Target Gene | RSS | Regulon Activity |
| ∗The dot plots of a searched regulon are shown for all cell subpopulations in each disease state of each tissue based on the regulon specific score inferred using pySCENIC and by calculating the average expression. |
| Page: 1 |
Top |
Somatic mutation of malignant transformation related genes |
| Annotation of somatic variants for genes involved in malignant transformation |
| Hugo Symbol | Variant Class | Variant Classification | dbSNP RS | HGVSc | HGVSp | HGVSp Short | SWISSPROT | BIOTYPE | SIFT | PolyPhen | Tumor Sample Barcode | Tissue | Histology | Sex | Age | Stage | Therapy Types | Drugs | Outcome |
| TPM2 | SNV | Missense_Mutation | c.740C>T | p.Ala247Val | p.A247V | P07951 | protein_coding | tolerated(0.08) | benign(0.081) | TCGA-A8-A09Z-01 | Breast | breast invasive carcinoma | Female | >=65 | I/II | Unknown | Unknown | SD | |
| TPM2 | SNV | Missense_Mutation | c.272N>A | p.Arg91His | p.R91H | P07951 | protein_coding | deleterious(0.03) | benign(0.121) | TCGA-AN-A046-01 | Breast | breast invasive carcinoma | Female | >=65 | I/II | Unknown | Unknown | SD | |
| TPM2 | SNV | Missense_Mutation | c.521G>A | p.Gly174Glu | p.G174E | P07951 | protein_coding | deleterious(0.01) | possibly_damaging(0.766) | TCGA-DS-A0VK-01 | Cervix | cervical & endocervical cancer | Female | <65 | I/II | Chemotherapy | carboplatin | PD | |
| TPM2 | SNV | Missense_Mutation | c.391G>A | p.Glu131Lys | p.E131K | P07951 | protein_coding | deleterious(0.01) | probably_damaging(0.992) | TCGA-FU-A3HZ-01 | Cervix | cervical & endocervical cancer | Female | <65 | I/II | Chemotherapy | cisplatin | CR | |
| TPM2 | SNV | Missense_Mutation | novel | c.250N>T | p.Asp84Tyr | p.D84Y | P07951 | protein_coding | deleterious(0) | possibly_damaging(0.819) | TCGA-VS-A8QF-01 | Cervix | cervical & endocervical cancer | Female | <65 | I/II | Chemotherapy | cisplatin | CR |
| TPM2 | SNV | Missense_Mutation | novel | c.466N>A | p.Glu156Lys | p.E156K | P07951 | protein_coding | deleterious(0) | probably_damaging(0.935) | TCGA-VS-A9U7-01 | Cervix | cervical & endocervical cancer | Female | <65 | I/II | Chemotherapy | cisplatin | CR |
| TPM2 | SNV | Missense_Mutation | c.67N>A | p.Glu23Lys | p.E23K | P07951 | protein_coding | deleterious(0.02) | possibly_damaging(0.9) | TCGA-AA-3864-01 | Colorectum | colon adenocarcinoma | Male | >=65 | I/II | Unknown | Unknown | SD | |
| TPM2 | SNV | Missense_Mutation | rs1059780 | c.593G>A | p.Arg198Gln | p.R198Q | P07951 | protein_coding | deleterious(0.04) | benign(0.156) | TCGA-AA-3984-01 | Colorectum | colon adenocarcinoma | Female | <65 | I/II | Unknown | Unknown | SD |
| TPM2 | SNV | Missense_Mutation | rs1059780 | c.593G>A | p.Arg198Gln | p.R198Q | P07951 | protein_coding | deleterious(0.04) | benign(0.156) | TCGA-AA-A00N-01 | Colorectum | colon adenocarcinoma | Male | >=65 | I/II | Unknown | Unknown | PD |
| TPM2 | SNV | Missense_Mutation | c.269G>A | p.Arg90His | p.R90H | P07951 | protein_coding | deleterious(0) | probably_damaging(0.997) | TCGA-AA-A010-01 | Colorectum | colon adenocarcinoma | Female | <65 | I/II | Chemotherapy | folinic | CR |
| Page: 1 2 3 4 |
Top |
Related drugs of malignant transformation related genes |
| Identification of chemicals and drugs interact with genes involved in malignant transfromation |
| (DGIdb 4.0) |
| Entrez ID | Symbol | Category | Interaction Types | Drug Claim Name | Drug Name | PMIDs |
| Page: 1 |

Copyright 2023-Present -The University of Texas Health Science Center at Houston |