
|
|||||
|
 | |
| |
| |
| |
| |
| |
|
Gene: TPGS2 |
Gene summary for TPGS2 |
| Gene information | Species | Human | Gene symbol | TPGS2 | Gene ID | 25941 |
| Gene name | tubulin polyglutamylase complex subunit 2 | |
| Gene Alias | C18orf10 | |
| Cytomap | 18q12.2 | |
| Gene Type | protein-coding | GO ID | GO:0006464 | UniProtAcc | Q68CL5 |
Top |
Malignant transformation analysis |
| Identification of the aberrant gene expression in precancerous and cancerous lesions by comparing the gene expression of stem-like cells in diseased tissues with normal stem cells |
| Entrez ID | Symbol | Replicates | Species | Organ | Tissue | Adj P-value | Log2FC | Malignancy |
| 25941 | TPGS2 | GSM4909281 | Human | Breast | IDC | 1.74e-35 | 7.32e-01 | 0.21 |
| 25941 | TPGS2 | GSM4909282 | Human | Breast | IDC | 5.36e-20 | 6.42e-01 | -0.0288 |
| 25941 | TPGS2 | GSM4909285 | Human | Breast | IDC | 7.45e-07 | 3.03e-01 | 0.21 |
| 25941 | TPGS2 | GSM4909286 | Human | Breast | IDC | 2.59e-11 | 3.72e-01 | 0.1081 |
| 25941 | TPGS2 | GSM4909311 | Human | Breast | IDC | 1.69e-06 | -1.64e-01 | 0.1534 |
| 25941 | TPGS2 | GSM4909319 | Human | Breast | IDC | 9.76e-11 | -3.73e-02 | 0.1563 |
| 25941 | TPGS2 | GSM4909321 | Human | Breast | IDC | 3.30e-02 | 8.32e-02 | 0.1559 |
| 25941 | TPGS2 | P1 | Human | Breast | IDC | 2.80e-04 | -7.10e-02 | 0.1527 |
| 25941 | TPGS2 | DCIS2 | Human | Breast | DCIS | 1.68e-35 | 6.53e-02 | 0.0085 |
| 25941 | TPGS2 | LZE2D | Human | Esophagus | HGIN | 3.31e-03 | 3.37e-01 | 0.0642 |
| 25941 | TPGS2 | LZE4T | Human | Esophagus | ESCC | 1.79e-22 | 6.02e-01 | 0.0811 |
| 25941 | TPGS2 | LZE7T | Human | Esophagus | ESCC | 3.70e-14 | 1.48e+00 | 0.0667 |
| 25941 | TPGS2 | LZE8T | Human | Esophagus | ESCC | 2.38e-05 | 1.79e-01 | 0.067 |
| 25941 | TPGS2 | LZE20T | Human | Esophagus | ESCC | 5.40e-03 | 1.84e-01 | 0.0662 |
| 25941 | TPGS2 | LZE22T | Human | Esophagus | ESCC | 4.84e-03 | 5.68e-01 | 0.068 |
| 25941 | TPGS2 | LZE24T | Human | Esophagus | ESCC | 1.01e-21 | 6.40e-01 | 0.0596 |
| 25941 | TPGS2 | LZE6T | Human | Esophagus | ESCC | 1.40e-04 | 2.89e-01 | 0.0845 |
| 25941 | TPGS2 | P1T-E | Human | Esophagus | ESCC | 6.09e-08 | 4.66e-01 | 0.0875 |
| 25941 | TPGS2 | P2T-E | Human | Esophagus | ESCC | 1.56e-49 | 1.06e+00 | 0.1177 |
| 25941 | TPGS2 | P4T-E | Human | Esophagus | ESCC | 2.50e-61 | 1.50e+00 | 0.1323 |
| Page: 1 2 3 4 5 6 7 |
| Tissue | Expression Dynamics | Abbreviation |
| Breast |  | IDC: Invasive ductal carcinoma |
| DCIS: Ductal carcinoma in situ | ||
| Precancer(BRCA1-mut): Precancerous lesion from BRCA1 mutation carriers | ||
| Esophagus | 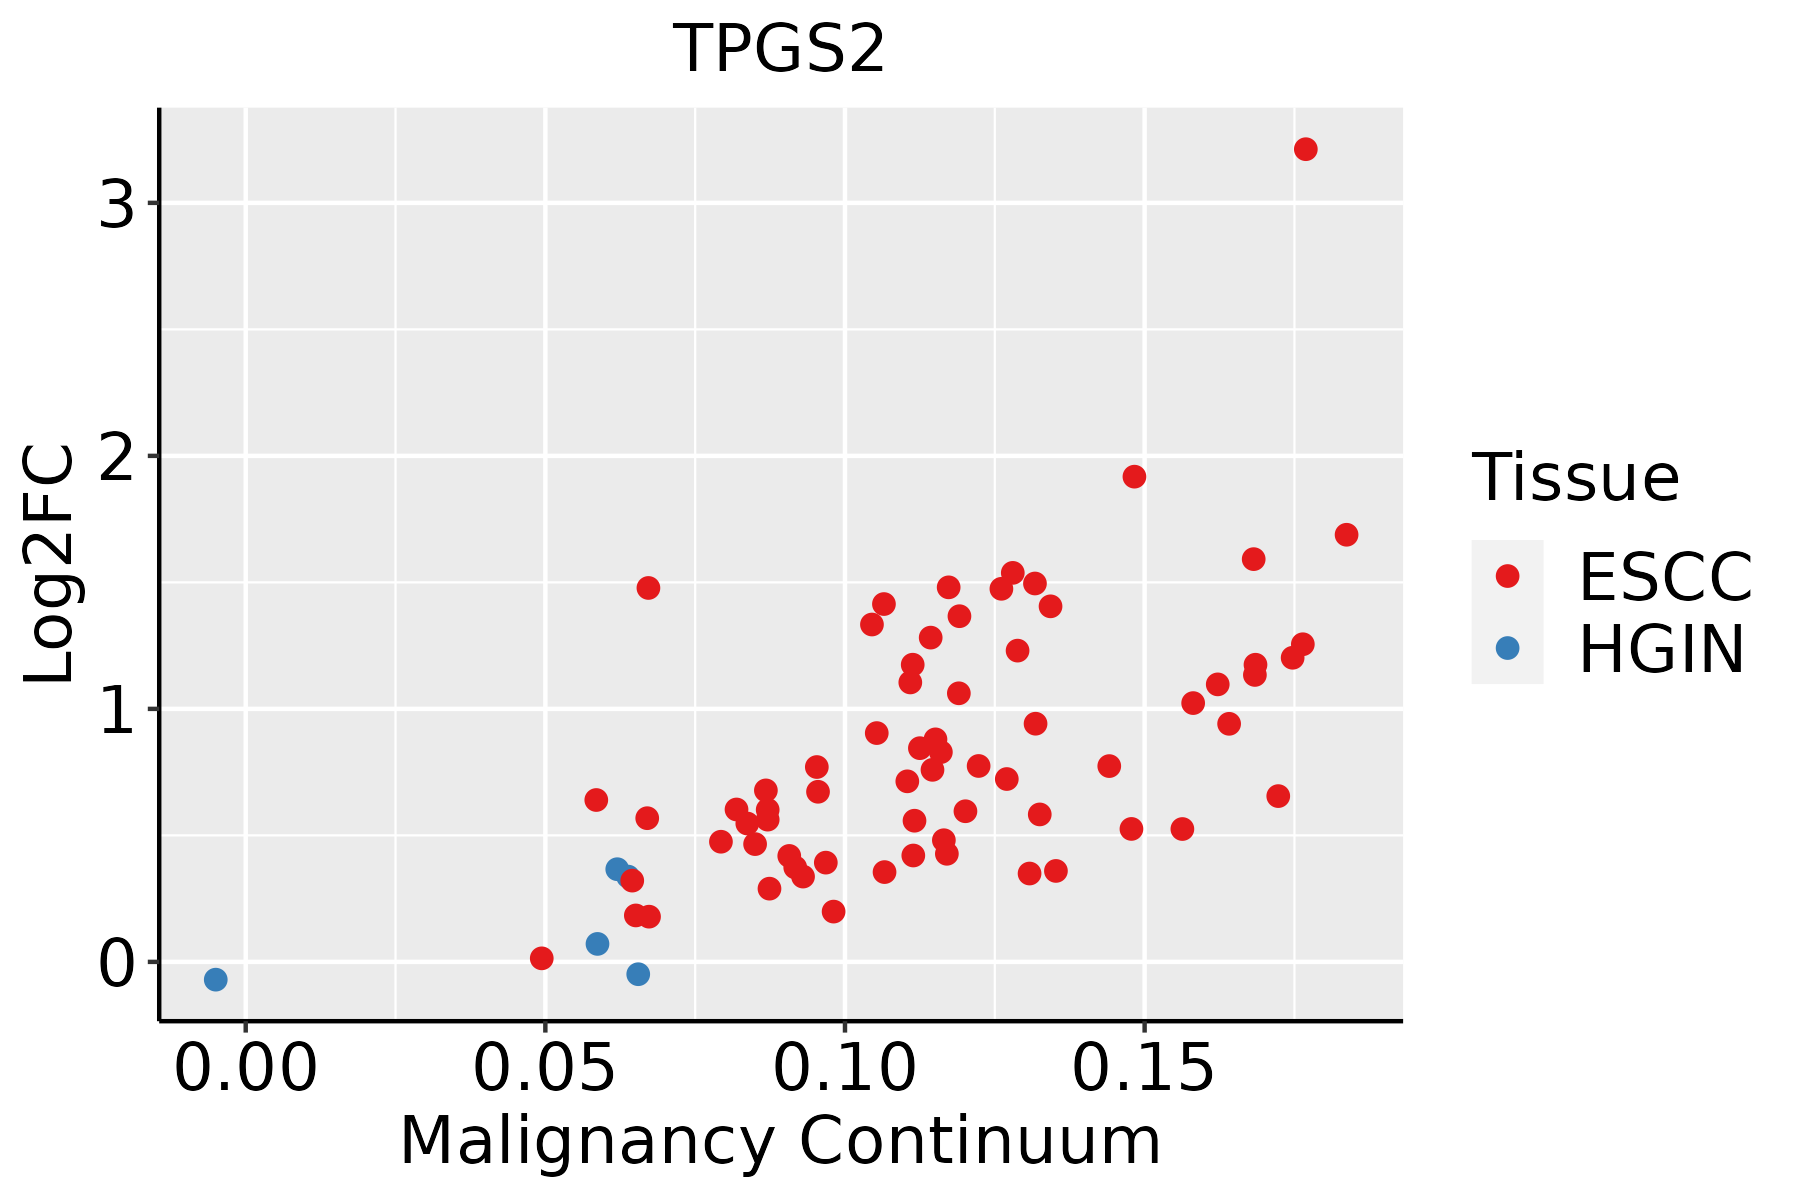 | ESCC: Esophageal squamous cell carcinoma |
| HGIN: High-grade intraepithelial neoplasias | ||
| LGIN: Low-grade intraepithelial neoplasias | ||
| Liver |  | HCC: Hepatocellular carcinoma |
| NAFLD: Non-alcoholic fatty liver disease | ||
| Oral Cavity | 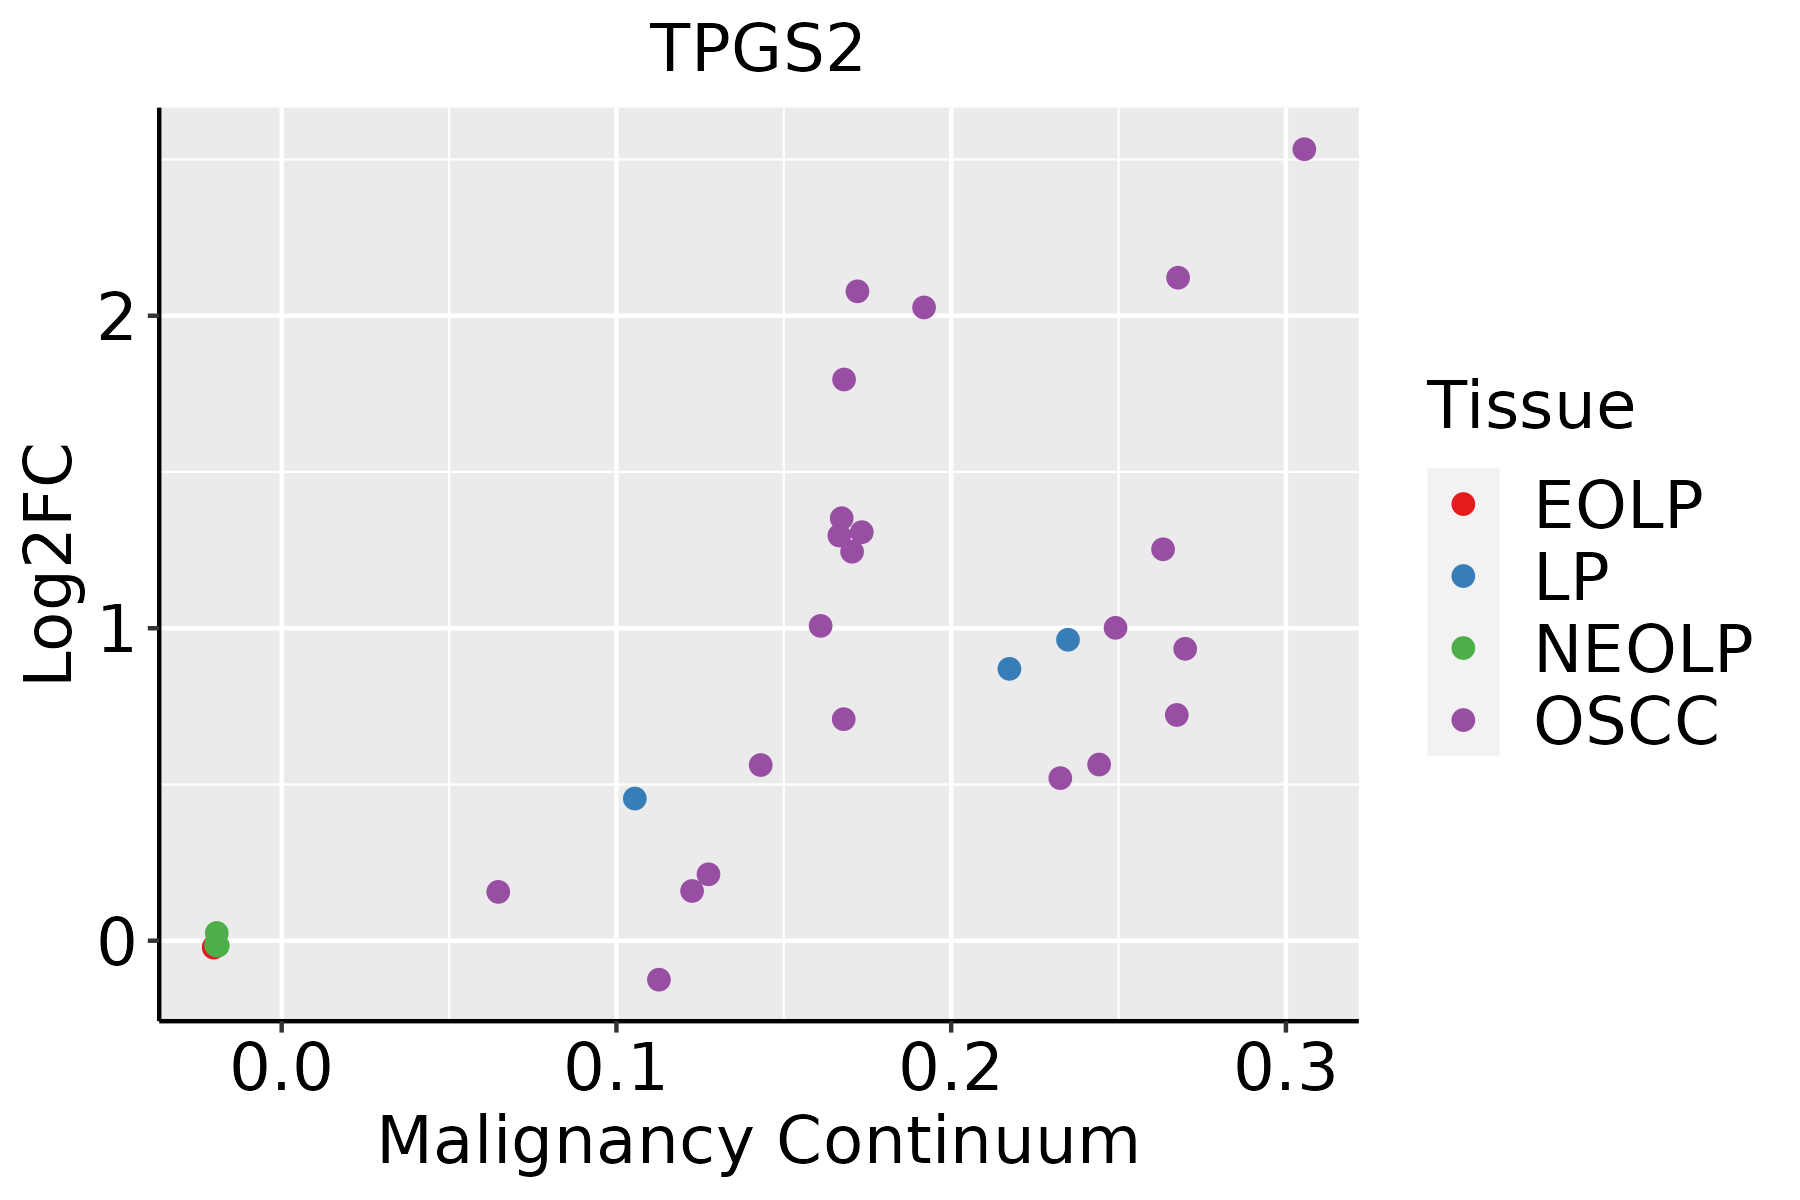 | EOLP: Erosive Oral lichen planus |
| LP: leukoplakia | ||
| NEOLP: Non-erosive oral lichen planus | ||
| OSCC: Oral squamous cell carcinoma | ||
| Skin | 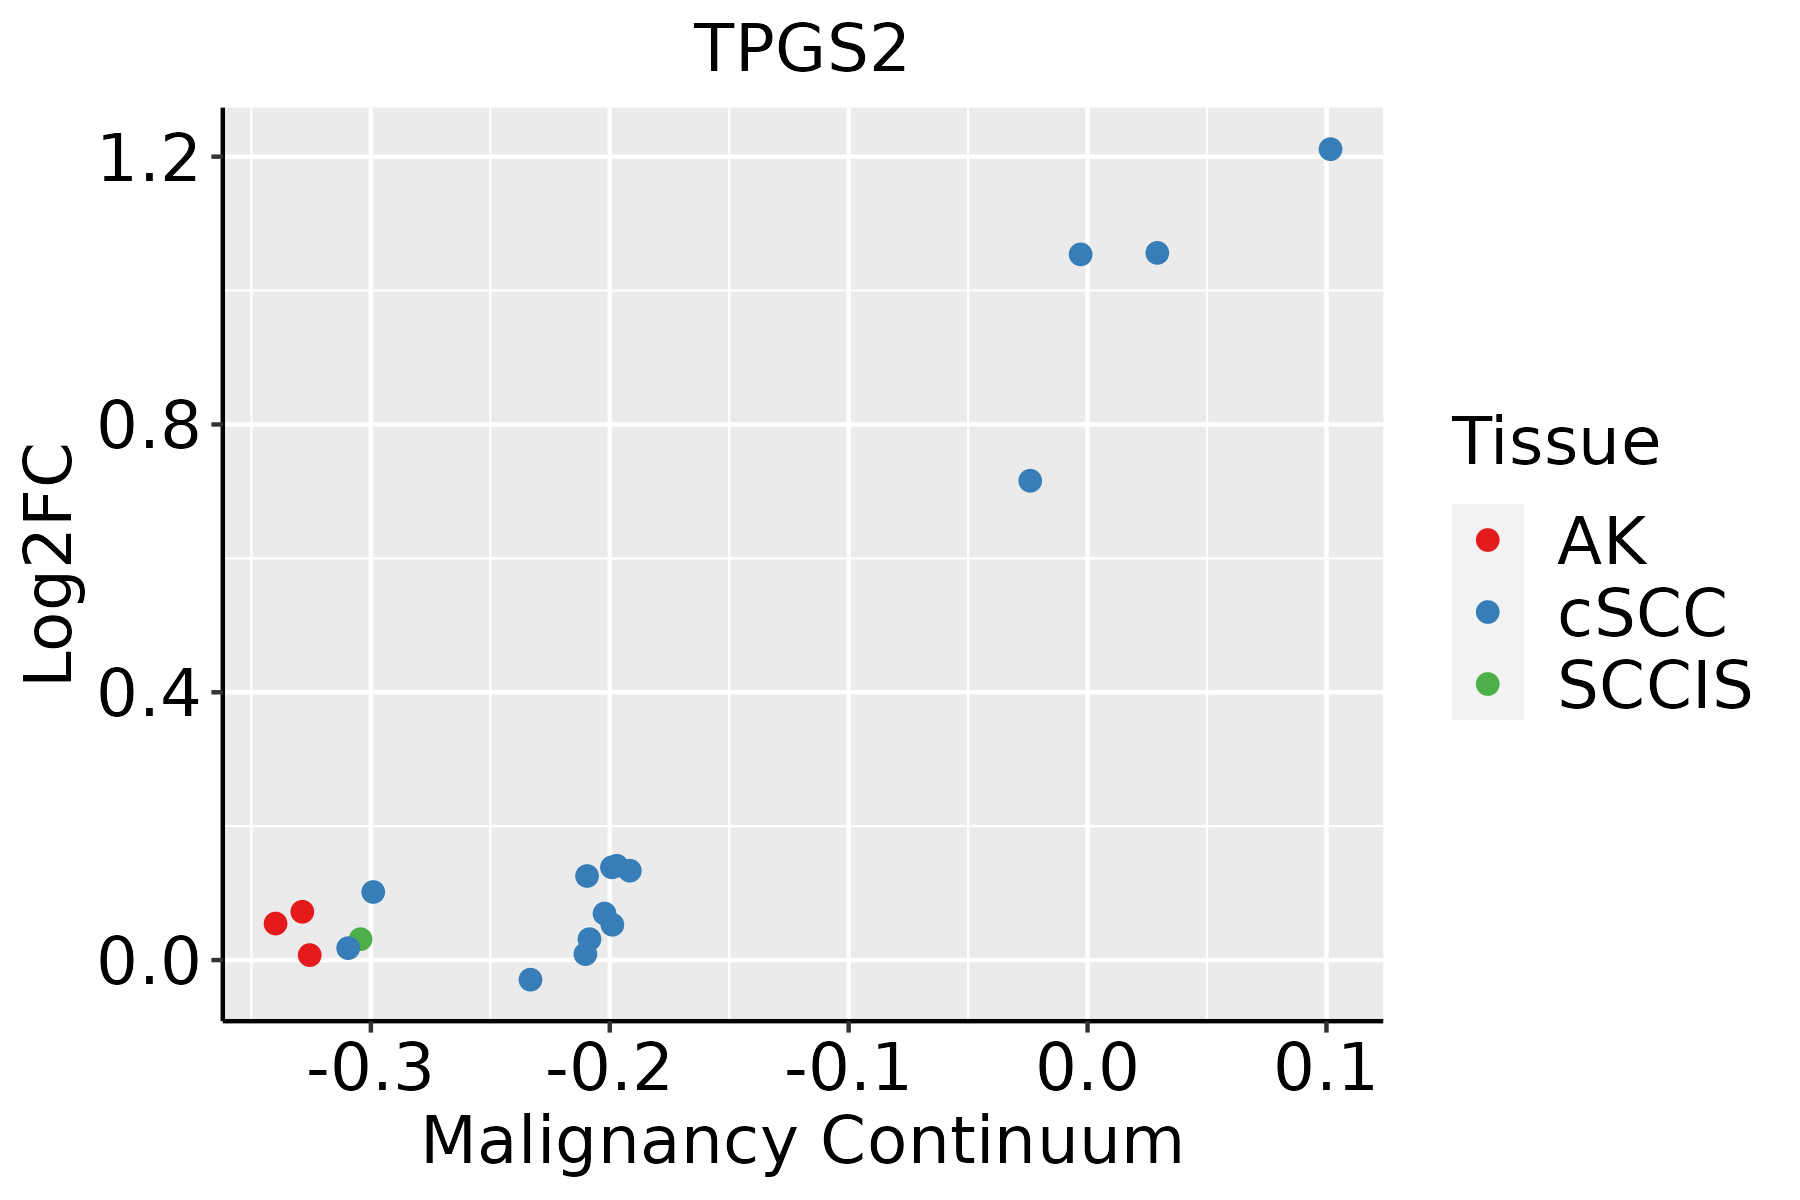 | AK: Actinic keratosis |
| cSCC: Cutaneous squamous cell carcinoma | ||
| SCCIS:squamous cell carcinoma in situ | ||
| Thyroid | 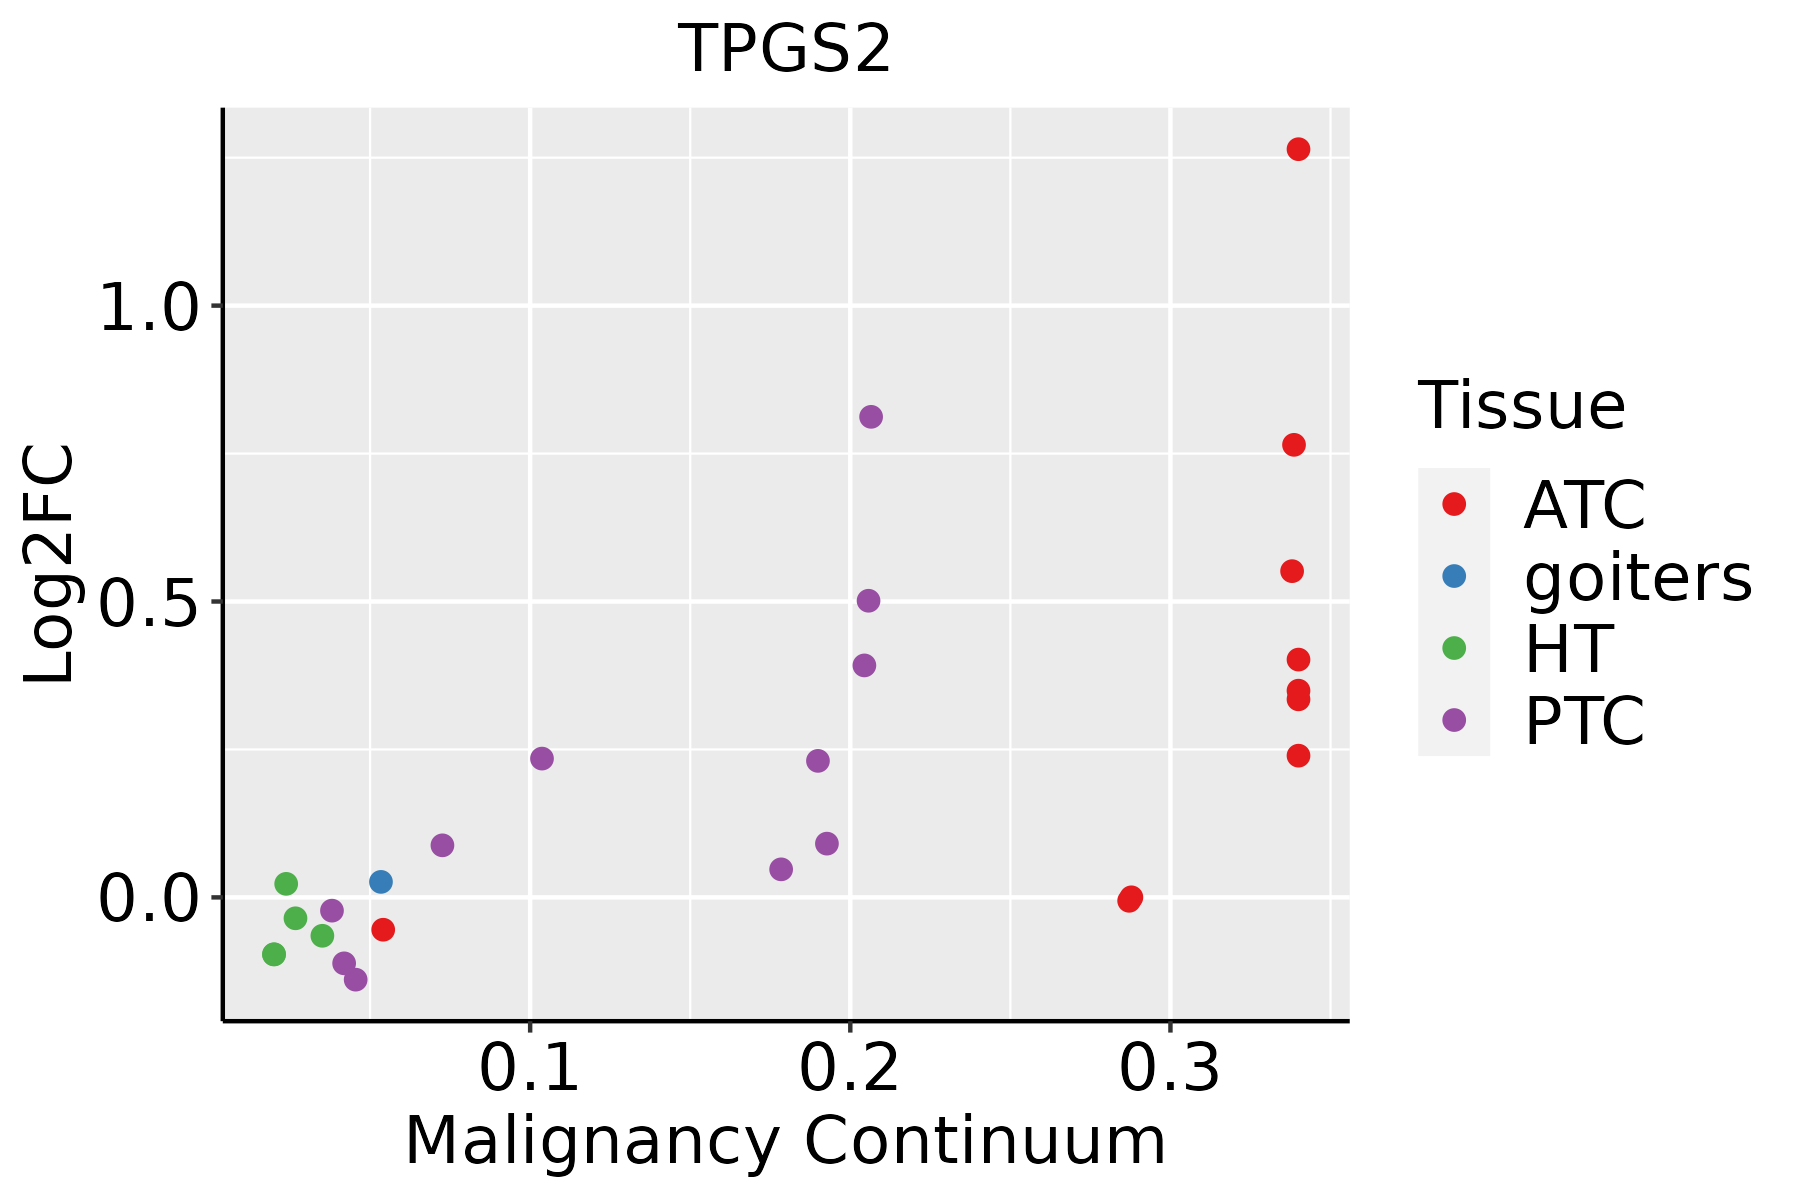 | ATC: Anaplastic thyroid cancer |
| HT: Hashimoto's thyroiditis | ||
| PTC: Papillary thyroid cancer |
| ∗log2FC in expression of this searched gene in stem-like cells from each diseased tissue sample relative to stem-like cells in normal samples in each tissue plotted against the malignancy continuum. Samples are colored based on if they are from different disease stage. |
Top |
Malignant transformation related pathway analysis |
| Find out the enriched GO biological processes and KEGG pathways involved in transition from healthy to precancer to cancer |
| Tissue | Disease Stage | Enriched GO biological Processes |
| Colorectum | AD |  |
| Colorectum | SER |  |
| Colorectum | MSS |  |
| Colorectum | MSI-H |  |
| Colorectum | FAP |  |
| ∗Top 15 enriched GO BP terms are showed in the bar plot of each disease state in each tissue. Each row represents a significant GO biological process which is colored according to the -log10(p.adjust). |
| Page: 1 2 3 4 5 6 7 8 9 |
| GO ID | Tissue | Disease Stage | Description | Gene Ratio | Bg Ratio | pvalue | p.adjust | Count |
| Page: 1 |
| Pathway ID | Tissue | Disease Stage | Description | Gene Ratio | Bg Ratio | pvalue | p.adjust | qvalue | Count |
| Page: 1 |
Top |
Cell-cell communication analysis |
| Identification of potential cell-cell interactions between two cell types and their ligand-receptor pairs for different disease states |
| Ligand | Receptor | LRpair | Pathway | Tissue | Disease Stage |
| Page: 1 |
Top |
Single-cell gene regulatory network inference analysis |
| Find out the significant the regulons (TFs) and the target genes of each regulon across cell types for different disease states |
| TF | Cell Type | Tissue | Disease Stage | Target Gene | RSS | Regulon Activity |
| ∗The dot plots of a searched regulon are shown for all cell subpopulations in each disease state of each tissue based on the regulon specific score inferred using pySCENIC and by calculating the average expression. |
| Page: 1 |
Top |
Somatic mutation of malignant transformation related genes |
| Annotation of somatic variants for genes involved in malignant transformation |
| Hugo Symbol | Variant Class | Variant Classification | dbSNP RS | HGVSc | HGVSp | HGVSp Short | SWISSPROT | BIOTYPE | SIFT | PolyPhen | Tumor Sample Barcode | Tissue | Histology | Sex | Age | Stage | Therapy Types | Drugs | Outcome |
| TPGS2 | SNV | Missense_Mutation | novel | c.256N>A | p.His86Asn | p.H86N | Q68CL5 | protein_coding | tolerated(0.34) | benign(0.006) | TCGA-A7-A3IZ-01 | Breast | breast invasive carcinoma | Female | <65 | I/II | Chemotherapy | cytoxan | SD |
| TPGS2 | SNV | Missense_Mutation | c.409C>G | p.His137Asp | p.H137D | Q68CL5 | protein_coding | deleterious(0.03) | possibly_damaging(0.503) | TCGA-BH-A0AW-01 | Breast | breast invasive carcinoma | Female | <65 | I/II | Chemotherapy | carboplatin | SD | |
| TPGS2 | SNV | Missense_Mutation | c.183G>A | p.Met61Ile | p.M61I | Q68CL5 | protein_coding | deleterious(0.01) | benign(0.022) | TCGA-LP-A4AW-01 | Cervix | cervical & endocervical cancer | Female | <65 | I/II | Unknown | Unknown | SD | |
| TPGS2 | SNV | Missense_Mutation | c.338N>T | p.Pro113Leu | p.P113L | Q68CL5 | protein_coding | deleterious(0.04) | possibly_damaging(0.879) | TCGA-CM-4743-01 | Colorectum | colon adenocarcinoma | Male | >=65 | I/II | Chemotherapy | capecitabine | SD | |
| TPGS2 | SNV | Missense_Mutation | c.196N>G | p.Lys66Glu | p.K66E | Q68CL5 | protein_coding | deleterious(0) | possibly_damaging(0.885) | TCGA-QG-A5Z2-01 | Colorectum | colon adenocarcinoma | Male | <65 | I/II | Unknown | Unknown | SD | |
| TPGS2 | SNV | Missense_Mutation | rs745585594 | c.92C>T | p.Ser31Phe | p.S31F | Q68CL5 | protein_coding | tolerated(0.73) | benign(0.176) | TCGA-A5-A0G2-01 | Endometrium | uterine corpus endometrioid carcinoma | Female | <65 | III/IV | Unknown | Unknown | SD |
| TPGS2 | SNV | Missense_Mutation | c.128N>A | p.Pro43His | p.P43H | Q68CL5 | protein_coding | tolerated(0.08) | possibly_damaging(0.77) | TCGA-AP-A051-01 | Endometrium | uterine corpus endometrioid carcinoma | Female | >=65 | I/II | Unknown | Unknown | SD | |
| TPGS2 | SNV | Missense_Mutation | novel | c.417N>A | p.Asp139Glu | p.D139E | Q68CL5 | protein_coding | deleterious(0.05) | benign(0.234) | TCGA-AP-A1DV-01 | Endometrium | uterine corpus endometrioid carcinoma | Female | <65 | I/II | Unknown | Unknown | SD |
| TPGS2 | SNV | Missense_Mutation | novel | c.184N>T | p.Pro62Ser | p.P62S | Q68CL5 | protein_coding | deleterious(0.02) | probably_damaging(0.977) | TCGA-BG-A220-01 | Endometrium | uterine corpus endometrioid carcinoma | Female | >=65 | I/II | Unknown | Unknown | SD |
| TPGS2 | SNV | Missense_Mutation | novel | c.895N>G | p.Thr299Ala | p.T299A | Q68CL5 | protein_coding | deleterious_low_confidence(0) | benign(0.017) | TCGA-DF-A2KN-01 | Endometrium | uterine corpus endometrioid carcinoma | Female | Unknown | I/II | Unknown | Unknown | SD |
| Page: 1 2 |
Top |
Related drugs of malignant transformation related genes |
| Identification of chemicals and drugs interact with genes involved in malignant transfromation |
| (DGIdb 4.0) |
| Entrez ID | Symbol | Category | Interaction Types | Drug Claim Name | Drug Name | PMIDs |
| Page: 1 |

Copyright 2023-Present -The University of Texas Health Science Center at Houston |