
|
|||||
|
 | |
| |
| |
| |
| |
| |
|
Gene: TPGS1 |
Gene summary for TPGS1 |
| Gene information | Species | Human | Gene symbol | TPGS1 | Gene ID | 91978 |
| Gene name | tubulin polyglutamylase complex subunit 1 | |
| Gene Alias | C19orf20 | |
| Cytomap | 19p13.3 | |
| Gene Type | protein-coding | GO ID | GO:0000003 | UniProtAcc | Q6ZTW0 |
Top |
Malignant transformation analysis |
| Identification of the aberrant gene expression in precancerous and cancerous lesions by comparing the gene expression of stem-like cells in diseased tissues with normal stem cells |
| Entrez ID | Symbol | Replicates | Species | Organ | Tissue | Adj P-value | Log2FC | Malignancy |
| 91978 | TPGS1 | LZE20T | Human | Esophagus | ESCC | 2.20e-02 | 1.87e-01 | 0.0662 |
| 91978 | TPGS1 | LZE21D1 | Human | Esophagus | HGIN | 3.12e-02 | 3.84e-01 | 0.0632 |
| 91978 | TPGS1 | LZE22T | Human | Esophagus | ESCC | 1.36e-03 | 3.25e-01 | 0.068 |
| 91978 | TPGS1 | LZE24T | Human | Esophagus | ESCC | 1.06e-22 | 5.61e-01 | 0.0596 |
| 91978 | TPGS1 | LZE21T | Human | Esophagus | ESCC | 6.44e-13 | 5.75e-01 | 0.0655 |
| 91978 | TPGS1 | P1T-E | Human | Esophagus | ESCC | 3.89e-15 | 6.60e-01 | 0.0875 |
| 91978 | TPGS1 | P2T-E | Human | Esophagus | ESCC | 1.59e-30 | 5.07e-01 | 0.1177 |
| 91978 | TPGS1 | P4T-E | Human | Esophagus | ESCC | 1.70e-37 | 7.36e-01 | 0.1323 |
| 91978 | TPGS1 | P5T-E | Human | Esophagus | ESCC | 4.12e-11 | 2.15e-01 | 0.1327 |
| 91978 | TPGS1 | P8T-E | Human | Esophagus | ESCC | 4.19e-25 | 4.14e-01 | 0.0889 |
| 91978 | TPGS1 | P9T-E | Human | Esophagus | ESCC | 1.73e-38 | 7.59e-01 | 0.1131 |
| 91978 | TPGS1 | P10T-E | Human | Esophagus | ESCC | 3.02e-26 | 4.35e-01 | 0.116 |
| 91978 | TPGS1 | P11T-E | Human | Esophagus | ESCC | 4.23e-37 | 1.06e+00 | 0.1426 |
| 91978 | TPGS1 | P12T-E | Human | Esophagus | ESCC | 7.74e-41 | 6.49e-01 | 0.1122 |
| 91978 | TPGS1 | P15T-E | Human | Esophagus | ESCC | 2.57e-43 | 8.13e-01 | 0.1149 |
| 91978 | TPGS1 | P16T-E | Human | Esophagus | ESCC | 3.60e-13 | 1.66e-01 | 0.1153 |
| 91978 | TPGS1 | P17T-E | Human | Esophagus | ESCC | 4.13e-19 | 7.04e-01 | 0.1278 |
| 91978 | TPGS1 | P19T-E | Human | Esophagus | ESCC | 8.16e-13 | 7.34e-01 | 0.1662 |
| 91978 | TPGS1 | P20T-E | Human | Esophagus | ESCC | 1.01e-27 | 5.65e-01 | 0.1124 |
| 91978 | TPGS1 | P21T-E | Human | Esophagus | ESCC | 6.62e-20 | 3.76e-01 | 0.1617 |
| Page: 1 2 3 4 5 6 |
| Tissue | Expression Dynamics | Abbreviation |
| Esophagus |  | ESCC: Esophageal squamous cell carcinoma |
| HGIN: High-grade intraepithelial neoplasias | ||
| LGIN: Low-grade intraepithelial neoplasias | ||
| Liver |  | HCC: Hepatocellular carcinoma |
| NAFLD: Non-alcoholic fatty liver disease | ||
| Oral Cavity | 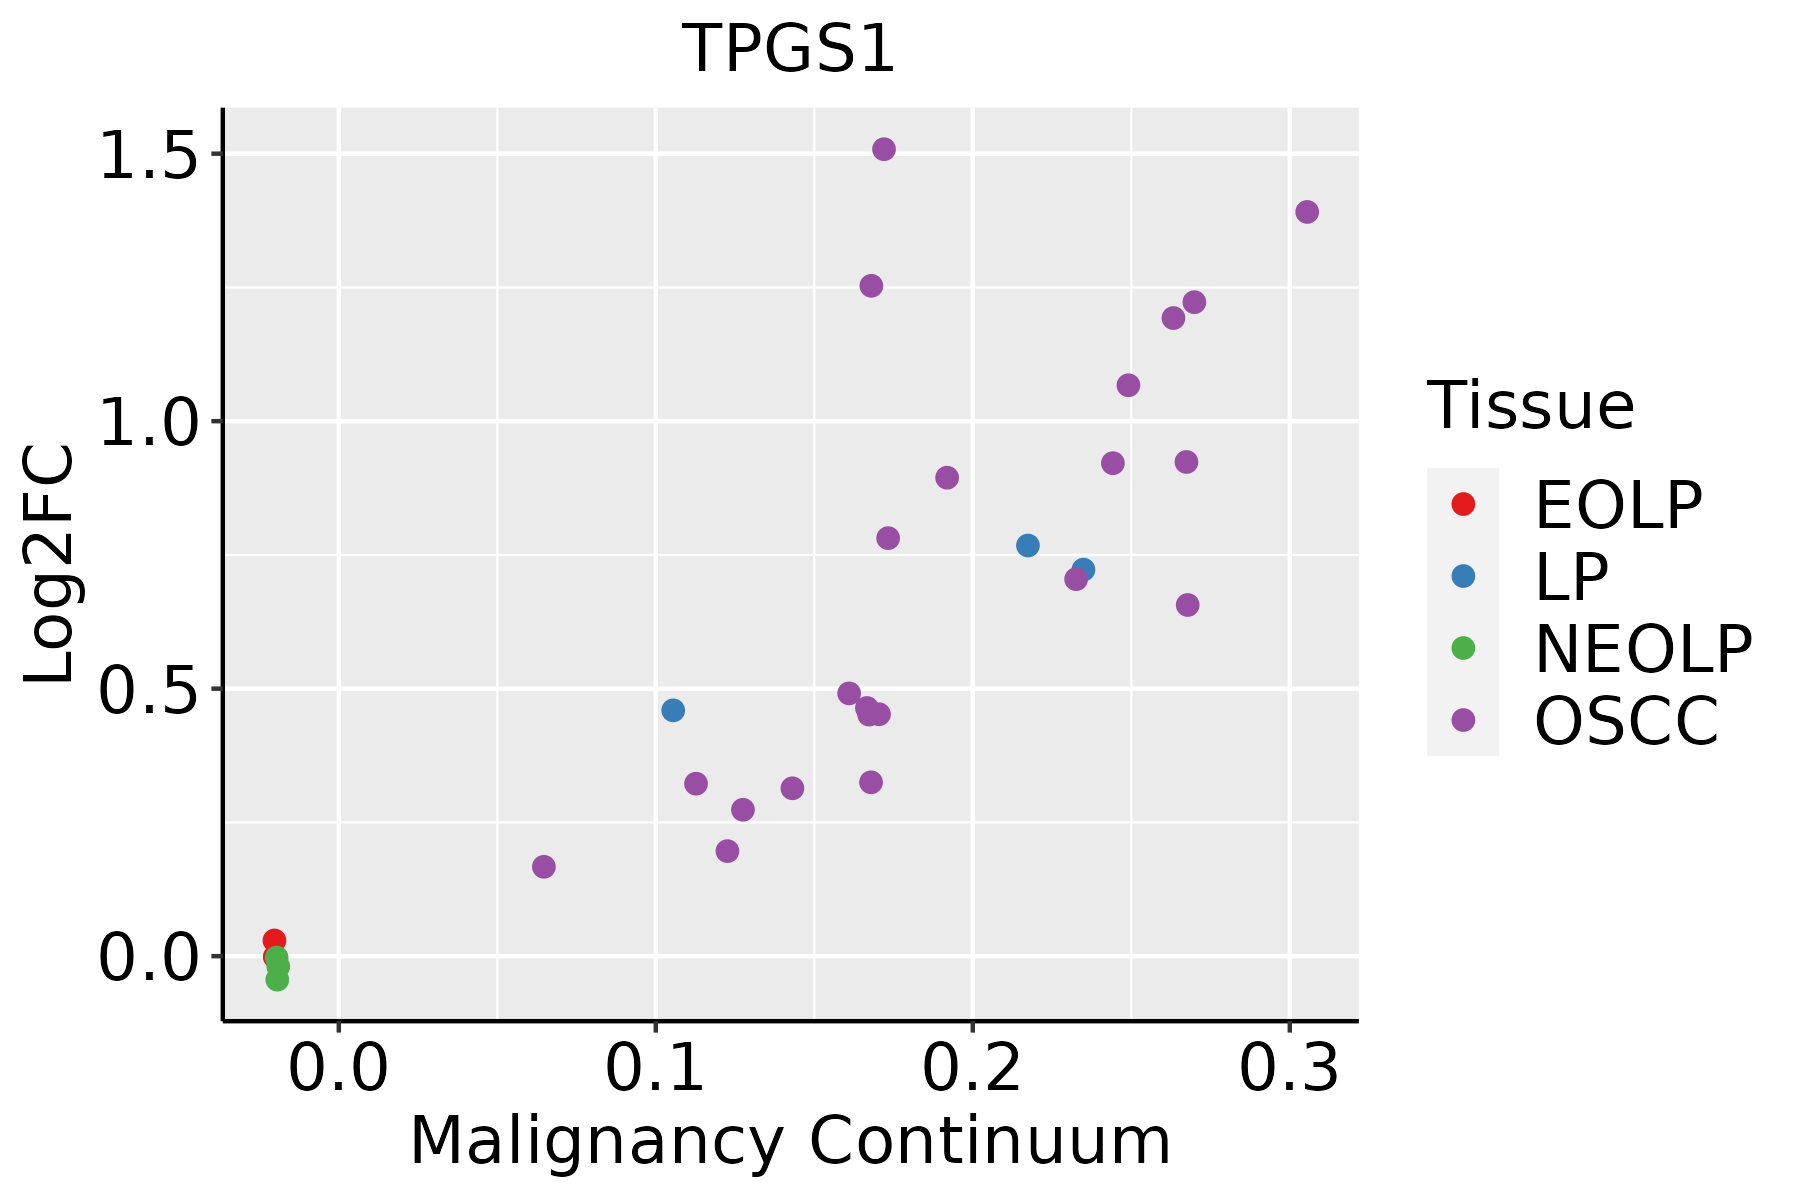 | EOLP: Erosive Oral lichen planus |
| LP: leukoplakia | ||
| NEOLP: Non-erosive oral lichen planus | ||
| OSCC: Oral squamous cell carcinoma | ||
| Skin | 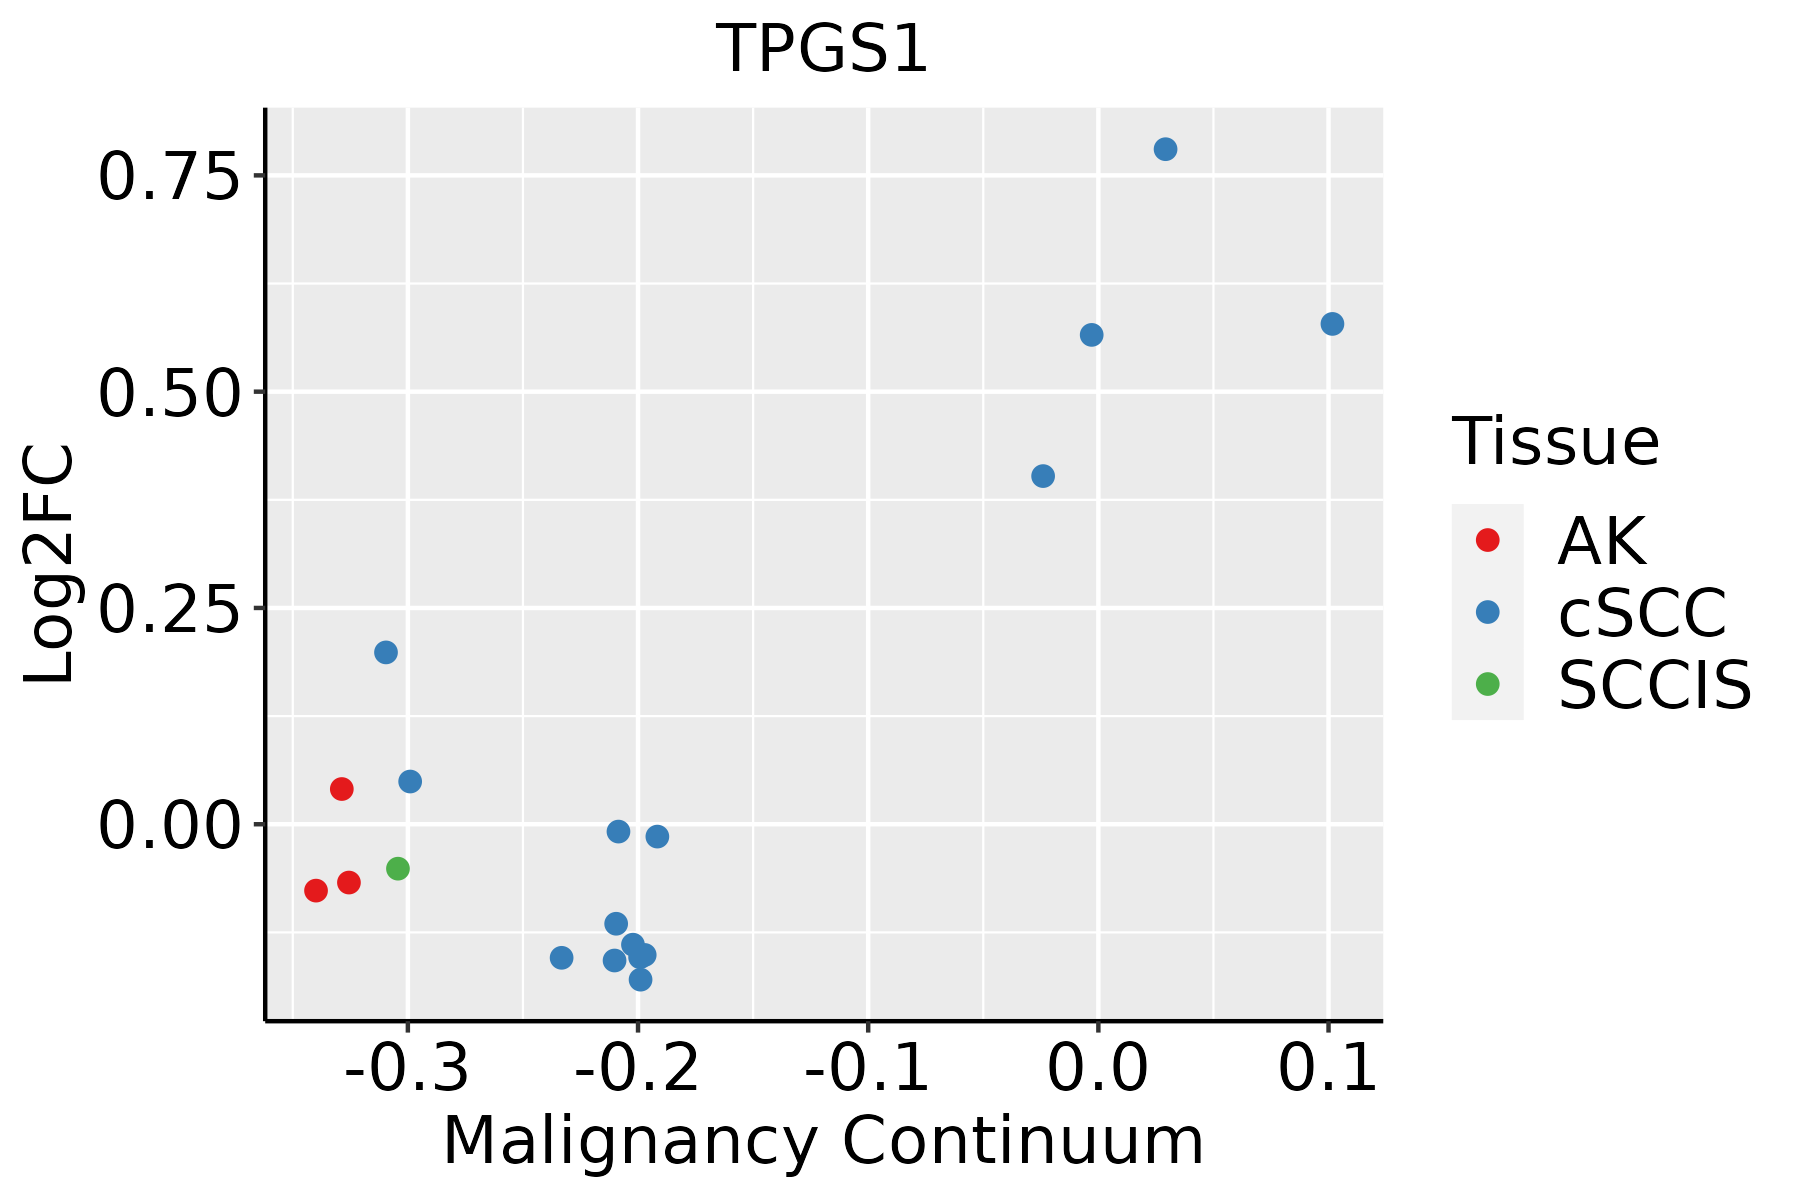 | AK: Actinic keratosis |
| cSCC: Cutaneous squamous cell carcinoma | ||
| SCCIS:squamous cell carcinoma in situ | ||
| Thyroid | 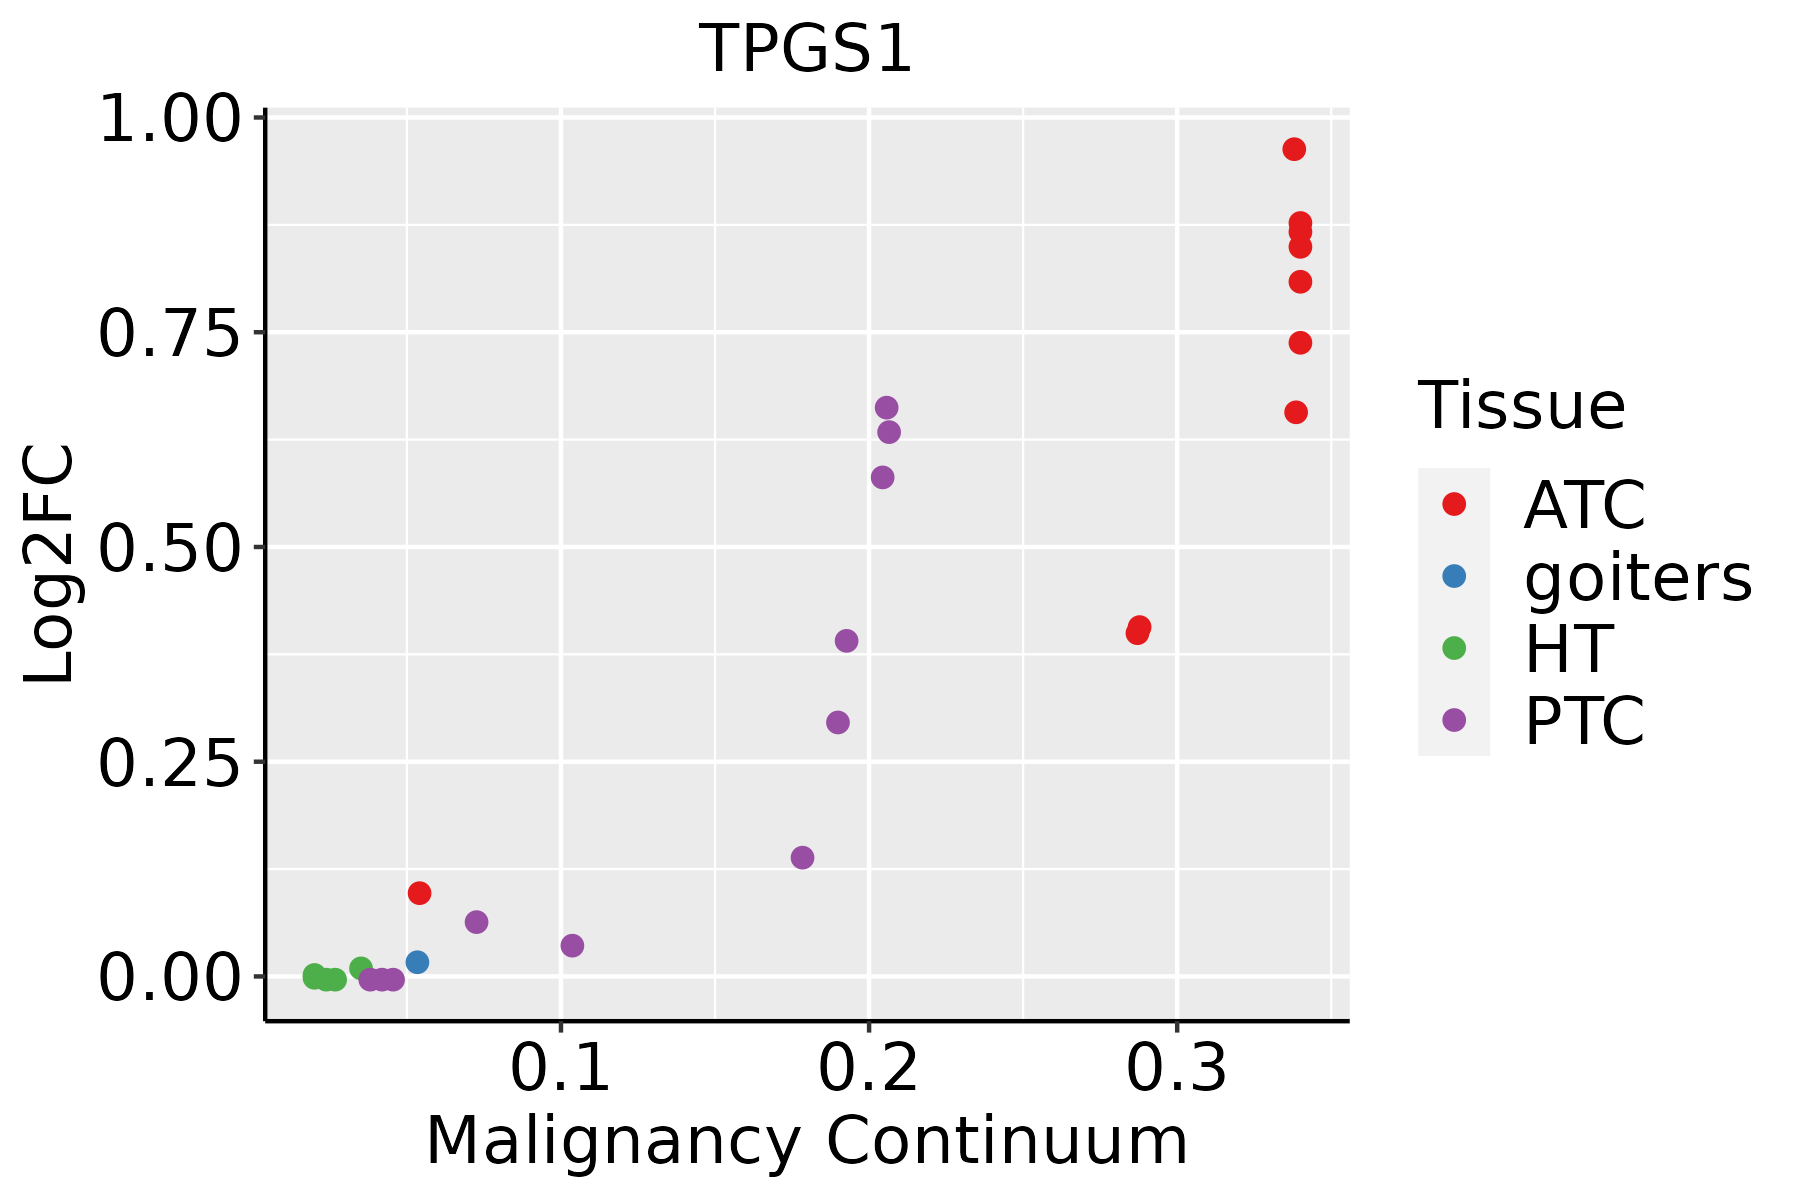 | ATC: Anaplastic thyroid cancer |
| HT: Hashimoto's thyroiditis | ||
| PTC: Papillary thyroid cancer |
| ∗log2FC in expression of this searched gene in stem-like cells from each diseased tissue sample relative to stem-like cells in normal samples in each tissue plotted against the malignancy continuum. Samples are colored based on if they are from different disease stage. |
Top |
Malignant transformation related pathway analysis |
| Find out the enriched GO biological processes and KEGG pathways involved in transition from healthy to precancer to cancer |
| Tissue | Disease Stage | Enriched GO biological Processes |
| Colorectum | AD |  |
| Colorectum | SER |  |
| Colorectum | MSS |  |
| Colorectum | MSI-H |  |
| Colorectum | FAP |  |
| ∗Top 15 enriched GO BP terms are showed in the bar plot of each disease state in each tissue. Each row represents a significant GO biological process which is colored according to the -log10(p.adjust). |
| Page: 1 2 3 4 5 6 7 8 9 |
| GO ID | Tissue | Disease Stage | Description | Gene Ratio | Bg Ratio | pvalue | p.adjust | Count |
| GO:005164810 | Esophagus | HGIN | vesicle localization | 37/2587 | 177/18723 | 6.03e-03 | 4.87e-02 | 37 |
| GO:005164815 | Esophagus | ESCC | vesicle localization | 119/8552 | 177/18723 | 5.16e-09 | 1.08e-07 | 119 |
| GO:005164811 | Liver | Cirrhotic | vesicle localization | 62/4634 | 177/18723 | 1.37e-03 | 9.18e-03 | 62 |
| GO:005164821 | Liver | HCC | vesicle localization | 107/7958 | 177/18723 | 1.05e-06 | 1.57e-05 | 107 |
| GO:00516489 | Oral cavity | OSCC | vesicle localization | 105/7305 | 177/18723 | 3.30e-08 | 6.30e-07 | 105 |
| GO:005164814 | Oral cavity | LP | vesicle localization | 66/4623 | 177/18723 | 1.25e-04 | 1.46e-03 | 66 |
| GO:005164816 | Skin | cSCC | vesicle localization | 73/4864 | 177/18723 | 6.36e-06 | 8.92e-05 | 73 |
| GO:005164817 | Thyroid | PTC | vesicle localization | 94/5968 | 177/18723 | 3.54e-09 | 9.45e-08 | 94 |
| GO:005164818 | Thyroid | ATC | vesicle localization | 91/6293 | 177/18723 | 7.21e-07 | 9.64e-06 | 91 |
| Page: 1 |
| Pathway ID | Tissue | Disease Stage | Description | Gene Ratio | Bg Ratio | pvalue | p.adjust | qvalue | Count |
| Page: 1 |
Top |
Cell-cell communication analysis |
| Identification of potential cell-cell interactions between two cell types and their ligand-receptor pairs for different disease states |
| Ligand | Receptor | LRpair | Pathway | Tissue | Disease Stage |
| Page: 1 |
Top |
Single-cell gene regulatory network inference analysis |
| Find out the significant the regulons (TFs) and the target genes of each regulon across cell types for different disease states |
| TF | Cell Type | Tissue | Disease Stage | Target Gene | RSS | Regulon Activity |
| ∗The dot plots of a searched regulon are shown for all cell subpopulations in each disease state of each tissue based on the regulon specific score inferred using pySCENIC and by calculating the average expression. |
| Page: 1 |
Top |
Somatic mutation of malignant transformation related genes |
| Annotation of somatic variants for genes involved in malignant transformation |
| Hugo Symbol | Variant Class | Variant Classification | dbSNP RS | HGVSc | HGVSp | HGVSp Short | SWISSPROT | BIOTYPE | SIFT | PolyPhen | Tumor Sample Barcode | Tissue | Histology | Sex | Age | Stage | Therapy Types | Drugs | Outcome |
| TPGS1 | deletion | In_Frame_Del | novel | c.12_53delNNNNNNNNNNNNNNNNNNNNNNNNNNNNNNNNNNNNNNNNNN | p.Glu5_Thr18del | p.E5_T18del | Q6ZTW0 | protein_coding | TCGA-AY-A71X-01 | Colorectum | colon adenocarcinoma | Female | <65 | I/II | Unknown | Unknown | SD | ||
| TPGS1 | SNV | Missense_Mutation | novel | c.507N>T | p.Gln169His | p.Q169H | Q6ZTW0 | protein_coding | tolerated(0.44) | benign(0.023) | TCGA-BG-A222-01 | Endometrium | uterine corpus endometrioid carcinoma | Female | <65 | I/II | Unknown | Unknown | SD |
| TPGS1 | SNV | Missense_Mutation | rs537230252 | c.149N>T | p.Ala50Val | p.A50V | Q6ZTW0 | protein_coding | deleterious(0.03) | possibly_damaging(0.795) | TCGA-FI-A2D5-01 | Endometrium | uterine corpus endometrioid carcinoma | Female | <65 | III/IV | Chemotherapy | carboplatinum | PD |
| TPGS1 | SNV | Missense_Mutation | novel | c.475N>A | p.Glu159Lys | p.E159K | Q6ZTW0 | protein_coding | tolerated(0.05) | benign(0.325) | TCGA-DD-AAW3-01 | Liver | liver hepatocellular carcinoma | Male | >=65 | I/II | Unknown | Unknown | SD |
| TPGS1 | SNV | Missense_Mutation | novel | c.398G>T | p.Arg133Met | p.R133M | Q6ZTW0 | protein_coding | deleterious(0.04) | benign(0.26) | TCGA-XK-AAIW-01 | Prostate | prostate adenocarcinoma | Male | >=65 | 9 | Unknown | Unknown | PD |
| Page: 1 |
Top |
Related drugs of malignant transformation related genes |
| Identification of chemicals and drugs interact with genes involved in malignant transfromation |
| (DGIdb 4.0) |
| Entrez ID | Symbol | Category | Interaction Types | Drug Claim Name | Drug Name | PMIDs |
| Page: 1 |

Copyright 2023-Present -The University of Texas Health Science Center at Houston |