
|
|||||
|
 | |
| |
| |
| |
| |
| |
|
Gene: TPD52L1 |
Gene summary for TPD52L1 |
| Gene information | Species | Human | Gene symbol | TPD52L1 | Gene ID | 7164 |
| Gene name | TPD52 like 1 | |
| Gene Alias | D53 | |
| Cytomap | 6q22.31 | |
| Gene Type | protein-coding | GO ID | GO:0000086 | UniProtAcc | Q15730 |
Top |
Malignant transformation analysis |
| Identification of the aberrant gene expression in precancerous and cancerous lesions by comparing the gene expression of stem-like cells in diseased tissues with normal stem cells |
| Entrez ID | Symbol | Replicates | Species | Organ | Tissue | Adj P-value | Log2FC | Malignancy |
| 7164 | TPD52L1 | GSM4909281 | Human | Breast | IDC | 1.40e-02 | -2.37e-01 | 0.21 |
| 7164 | TPD52L1 | GSM4909286 | Human | Breast | IDC | 1.36e-06 | -3.13e-01 | 0.1081 |
| 7164 | TPD52L1 | GSM4909294 | Human | Breast | IDC | 3.71e-04 | -2.29e-01 | 0.2022 |
| 7164 | TPD52L1 | GSM4909296 | Human | Breast | IDC | 1.28e-11 | -3.70e-01 | 0.1524 |
| 7164 | TPD52L1 | GSM4909297 | Human | Breast | IDC | 7.69e-20 | -4.62e-01 | 0.1517 |
| 7164 | TPD52L1 | GSM4909301 | Human | Breast | IDC | 1.75e-15 | -4.22e-01 | 0.1577 |
| 7164 | TPD52L1 | GSM4909302 | Human | Breast | IDC | 2.71e-09 | -3.92e-01 | 0.1545 |
| 7164 | TPD52L1 | GSM4909308 | Human | Breast | IDC | 9.69e-09 | -3.58e-01 | 0.158 |
| 7164 | TPD52L1 | GSM4909311 | Human | Breast | IDC | 1.28e-28 | -4.35e-01 | 0.1534 |
| 7164 | TPD52L1 | GSM4909312 | Human | Breast | IDC | 2.76e-13 | -4.10e-01 | 0.1552 |
| 7164 | TPD52L1 | GSM4909315 | Human | Breast | IDC | 1.24e-04 | -3.36e-01 | 0.21 |
| 7164 | TPD52L1 | GSM4909319 | Human | Breast | IDC | 1.31e-32 | -5.60e-01 | 0.1563 |
| 7164 | TPD52L1 | GSM4909320 | Human | Breast | IDC | 4.60e-11 | -5.56e-01 | 0.1575 |
| 7164 | TPD52L1 | GSM4909321 | Human | Breast | IDC | 5.86e-20 | -4.06e-01 | 0.1559 |
| 7164 | TPD52L1 | ctrl6 | Human | Breast | Precancer | 4.30e-10 | -5.40e-01 | -0.0061 |
| 7164 | TPD52L1 | brca1 | Human | Breast | Precancer | 1.69e-07 | 3.41e-01 | -0.0338 |
| 7164 | TPD52L1 | brca10 | Human | Breast | Precancer | 1.99e-13 | -4.69e-01 | -0.0029 |
| 7164 | TPD52L1 | NCCBC14 | Human | Breast | DCIS | 8.85e-08 | -1.09e-01 | 0.2021 |
| 7164 | TPD52L1 | NCCBC2 | Human | Breast | DCIS | 1.15e-02 | -3.19e-01 | 0.1554 |
| 7164 | TPD52L1 | NCCBC3 | Human | Breast | DCIS | 3.67e-11 | -4.12e-01 | 0.1198 |
| Page: 1 2 3 4 5 6 7 |
| Tissue | Expression Dynamics | Abbreviation |
| Breast |  | IDC: Invasive ductal carcinoma |
| DCIS: Ductal carcinoma in situ | ||
| Precancer(BRCA1-mut): Precancerous lesion from BRCA1 mutation carriers | ||
| Esophagus | 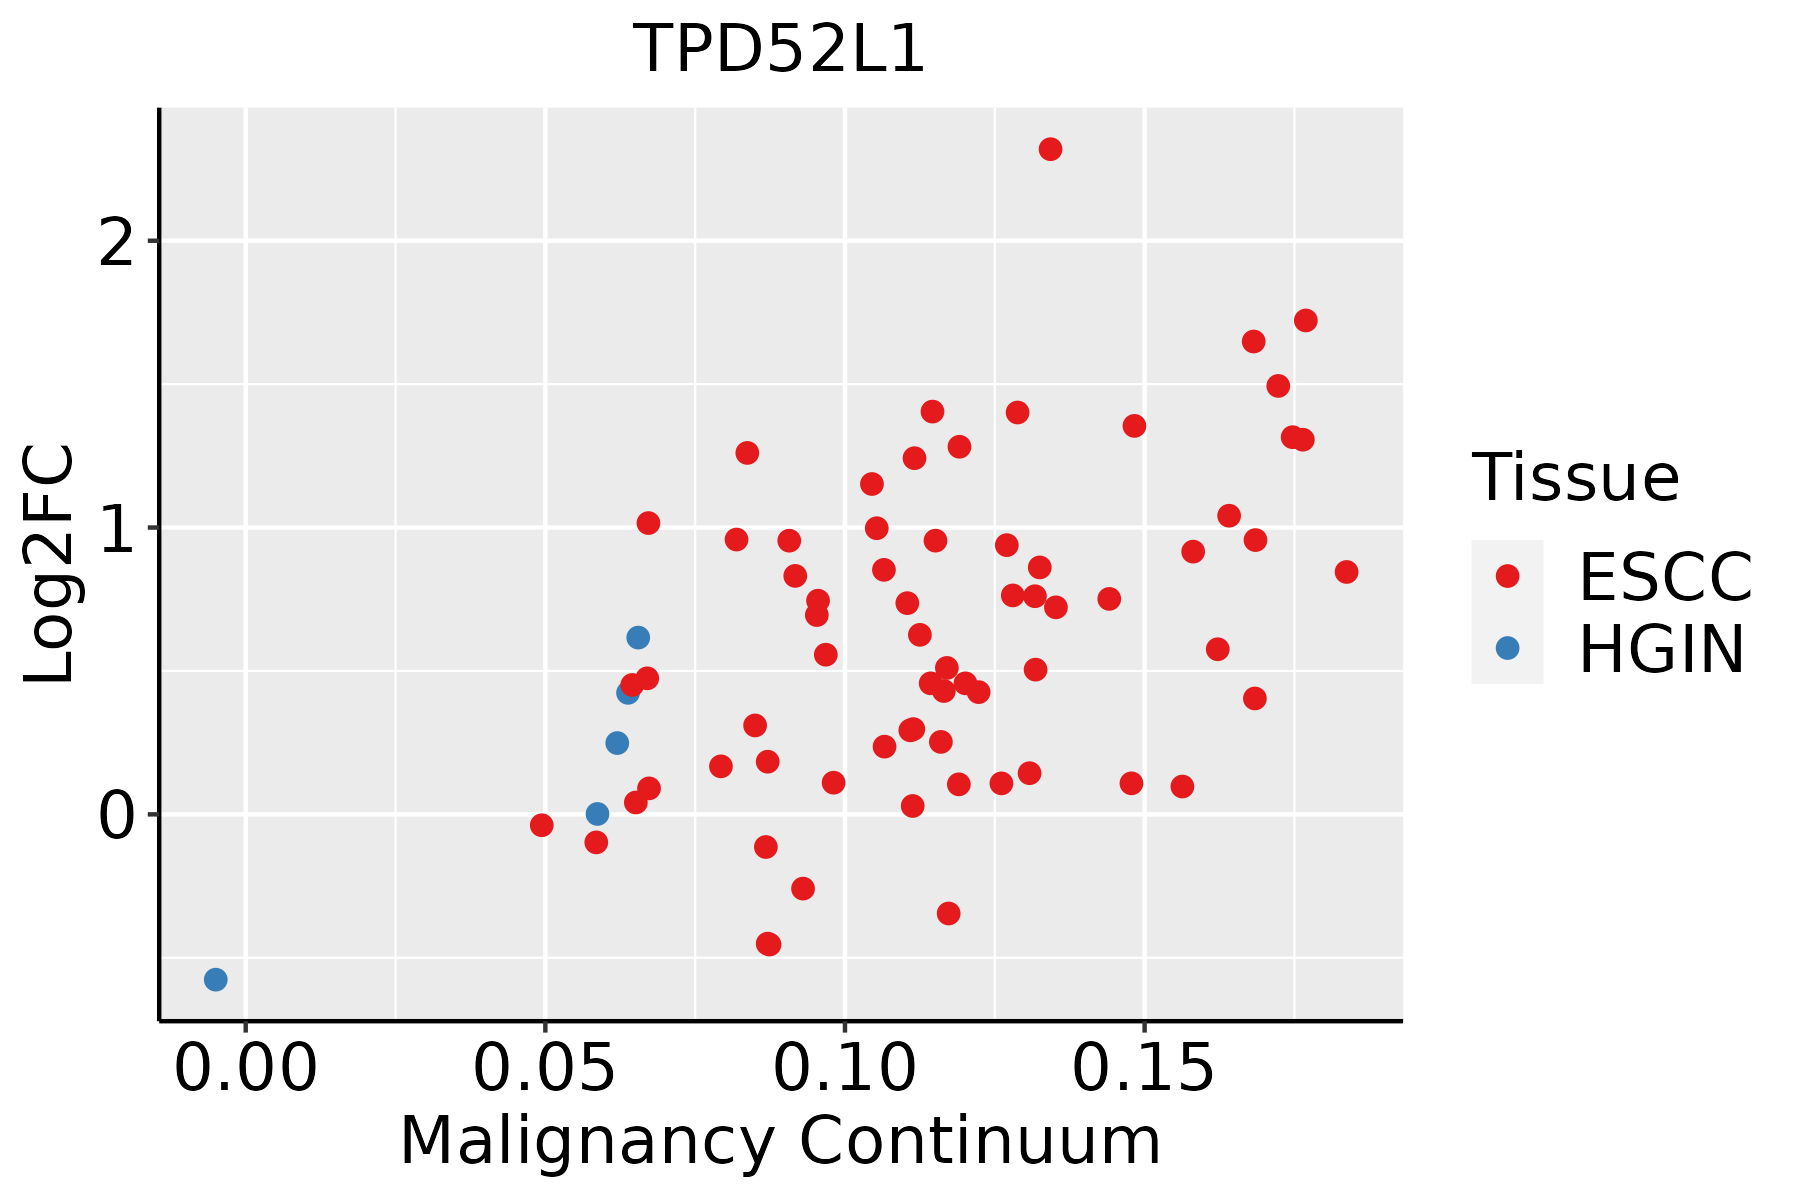 | ESCC: Esophageal squamous cell carcinoma |
| HGIN: High-grade intraepithelial neoplasias | ||
| LGIN: Low-grade intraepithelial neoplasias | ||
| Liver | 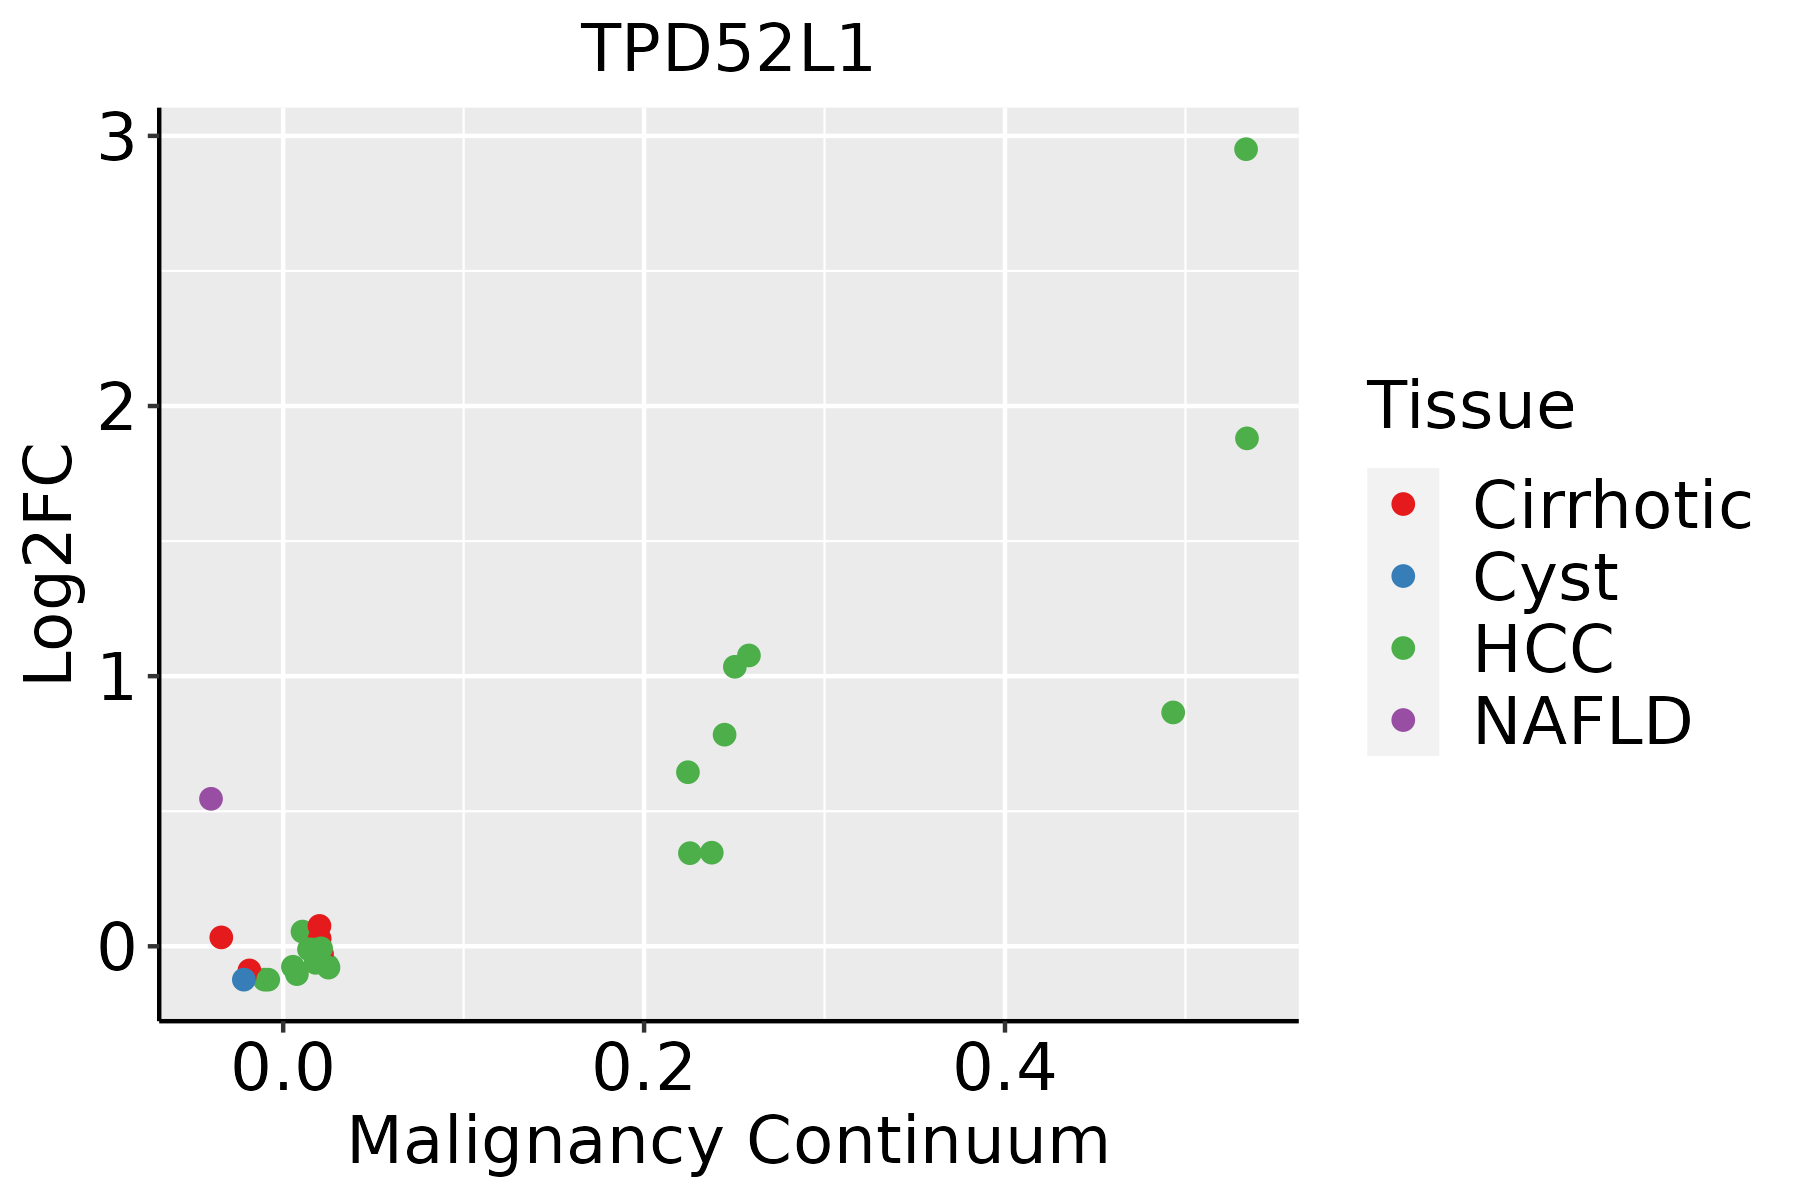 | HCC: Hepatocellular carcinoma |
| NAFLD: Non-alcoholic fatty liver disease | ||
| Oral Cavity | 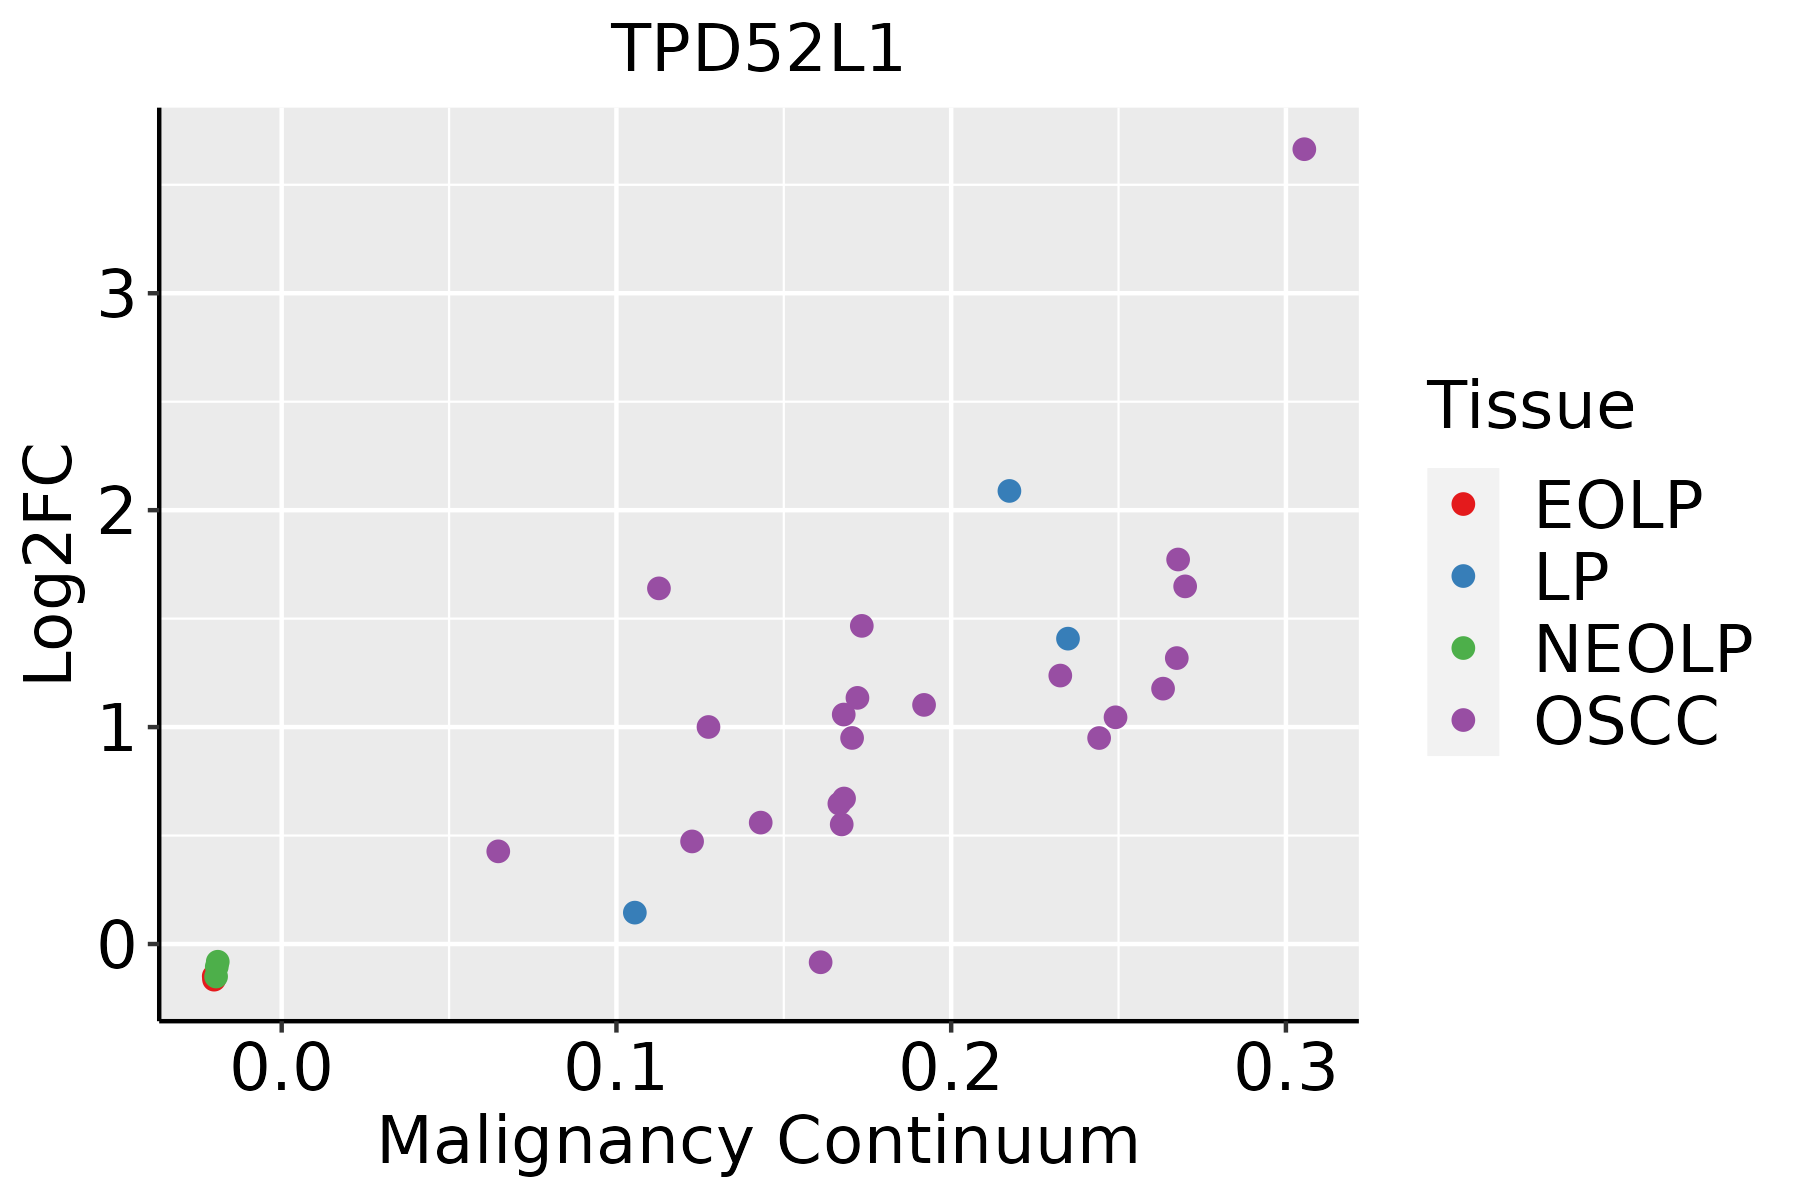 | EOLP: Erosive Oral lichen planus |
| LP: leukoplakia | ||
| NEOLP: Non-erosive oral lichen planus | ||
| OSCC: Oral squamous cell carcinoma | ||
| Prostate | 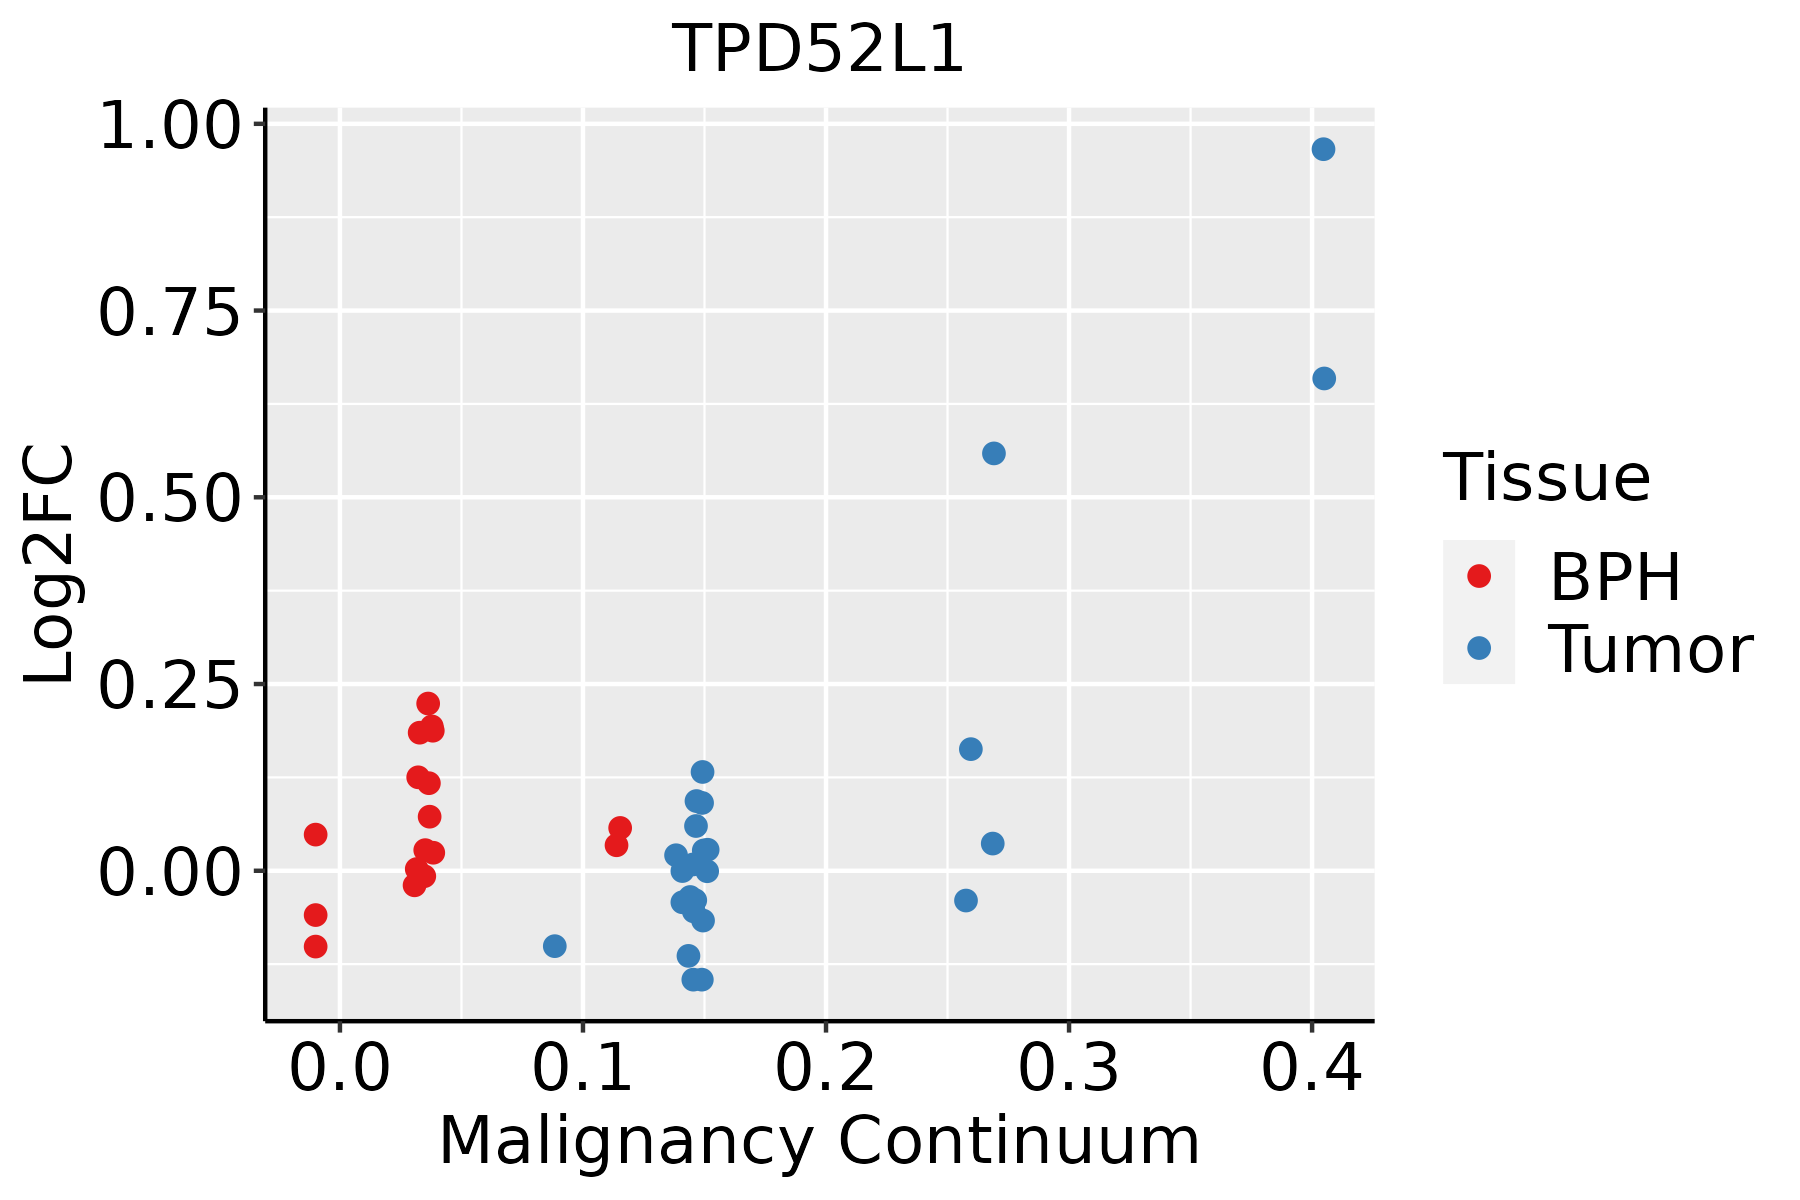 | BPH: Benign Prostatic Hyperplasia |
| Skin |  | AK: Actinic keratosis |
| cSCC: Cutaneous squamous cell carcinoma | ||
| SCCIS:squamous cell carcinoma in situ | ||
| Thyroid |  | ATC: Anaplastic thyroid cancer |
| HT: Hashimoto's thyroiditis | ||
| PTC: Papillary thyroid cancer |
| ∗log2FC in expression of this searched gene in stem-like cells from each diseased tissue sample relative to stem-like cells in normal samples in each tissue plotted against the malignancy continuum. Samples are colored based on if they are from different disease stage. |
Top |
Malignant transformation related pathway analysis |
| Find out the enriched GO biological processes and KEGG pathways involved in transition from healthy to precancer to cancer |
| Tissue | Disease Stage | Enriched GO biological Processes |
| Colorectum | AD |  |
| Colorectum | SER |  |
| Colorectum | MSS |  |
| Colorectum | MSI-H |  |
| Colorectum | FAP |  |
| ∗Top 15 enriched GO BP terms are showed in the bar plot of each disease state in each tissue. Each row represents a significant GO biological process which is colored according to the -log10(p.adjust). |
| Page: 1 2 3 4 5 6 7 8 9 |
| GO ID | Tissue | Disease Stage | Description | Gene Ratio | Bg Ratio | pvalue | p.adjust | Count |
| GO:20012339 | Breast | Precancer | regulation of apoptotic signaling pathway | 65/1080 | 356/18723 | 7.70e-17 | 3.17e-14 | 65 |
| GO:20012356 | Breast | Precancer | positive regulation of apoptotic signaling pathway | 24/1080 | 126/18723 | 1.98e-07 | 1.01e-05 | 24 |
| GO:00336749 | Breast | Precancer | positive regulation of kinase activity | 42/1080 | 467/18723 | 2.94e-03 | 2.54e-02 | 42 |
| GO:200123314 | Breast | IDC | regulation of apoptotic signaling pathway | 82/1434 | 356/18723 | 6.27e-20 | 5.93e-17 | 82 |
| GO:200123514 | Breast | IDC | positive regulation of apoptotic signaling pathway | 31/1434 | 126/18723 | 4.13e-09 | 3.35e-07 | 31 |
| GO:200123324 | Breast | DCIS | regulation of apoptotic signaling pathway | 81/1390 | 356/18723 | 3.51e-20 | 3.31e-17 | 81 |
| GO:200123523 | Breast | DCIS | positive regulation of apoptotic signaling pathway | 31/1390 | 126/18723 | 1.96e-09 | 1.76e-07 | 31 |
| GO:00447724 | Breast | DCIS | mitotic cell cycle phase transition | 46/1390 | 424/18723 | 6.16e-03 | 4.39e-02 | 46 |
| GO:2001233111 | Esophagus | ESCC | regulation of apoptotic signaling pathway | 256/8552 | 356/18723 | 4.11e-24 | 1.04e-21 | 256 |
| GO:004477216 | Esophagus | ESCC | mitotic cell cycle phase transition | 281/8552 | 424/18723 | 4.63e-18 | 4.45e-16 | 281 |
| GO:007190016 | Esophagus | ESCC | regulation of protein serine/threonine kinase activity | 227/8552 | 359/18723 | 1.12e-11 | 4.10e-10 | 227 |
| GO:2001235110 | Esophagus | ESCC | positive regulation of apoptotic signaling pathway | 92/8552 | 126/18723 | 3.91e-10 | 1.05e-08 | 92 |
| GO:00448394 | Esophagus | ESCC | cell cycle G2/M phase transition | 103/8552 | 148/18723 | 3.09e-09 | 6.67e-08 | 103 |
| GO:00000864 | Esophagus | ESCC | G2/M transition of mitotic cell cycle | 96/8552 | 137/18723 | 6.00e-09 | 1.23e-07 | 96 |
| GO:003109818 | Esophagus | ESCC | stress-activated protein kinase signaling cascade | 154/8552 | 247/18723 | 8.53e-08 | 1.44e-06 | 154 |
| GO:005140318 | Esophagus | ESCC | stress-activated MAPK cascade | 147/8552 | 239/18723 | 5.43e-07 | 7.18e-06 | 147 |
| GO:00719029 | Esophagus | ESCC | positive regulation of protein serine/threonine kinase activity | 124/8552 | 200/18723 | 2.27e-06 | 2.61e-05 | 124 |
| GO:004586018 | Esophagus | ESCC | positive regulation of protein kinase activity | 219/8552 | 386/18723 | 6.91e-06 | 6.97e-05 | 219 |
| GO:003367420 | Esophagus | ESCC | positive regulation of kinase activity | 260/8552 | 467/18723 | 7.26e-06 | 7.22e-05 | 260 |
| GO:007030217 | Esophagus | ESCC | regulation of stress-activated protein kinase signaling cascade | 119/8552 | 195/18723 | 1.07e-05 | 1.01e-04 | 119 |
| Page: 1 2 3 4 5 6 7 8 9 |
| Pathway ID | Tissue | Disease Stage | Description | Gene Ratio | Bg Ratio | pvalue | p.adjust | qvalue | Count |
| Page: 1 |
Top |
Cell-cell communication analysis |
| Identification of potential cell-cell interactions between two cell types and their ligand-receptor pairs for different disease states |
| Ligand | Receptor | LRpair | Pathway | Tissue | Disease Stage |
| Page: 1 |
Top |
Single-cell gene regulatory network inference analysis |
| Find out the significant the regulons (TFs) and the target genes of each regulon across cell types for different disease states |
| TF | Cell Type | Tissue | Disease Stage | Target Gene | RSS | Regulon Activity |
| ∗The dot plots of a searched regulon are shown for all cell subpopulations in each disease state of each tissue based on the regulon specific score inferred using pySCENIC and by calculating the average expression. |
| Page: 1 |
Top |
Somatic mutation of malignant transformation related genes |
| Annotation of somatic variants for genes involved in malignant transformation |
| Hugo Symbol | Variant Class | Variant Classification | dbSNP RS | HGVSc | HGVSp | HGVSp Short | SWISSPROT | BIOTYPE | SIFT | PolyPhen | Tumor Sample Barcode | Tissue | Histology | Sex | Age | Stage | Therapy Types | Drugs | Outcome |
| TPD52L1 | SNV | Missense_Mutation | novel | c.368A>G | p.Lys123Arg | p.K123R | protein_coding | tolerated(1) | benign(0.007) | TCGA-D8-A147-01 | Breast | breast invasive carcinoma | Female | <65 | I/II | Chemotherapy | doxorubicine | SD | |
| TPD52L1 | SNV | Missense_Mutation | c.215N>C | p.Gly72Ala | p.G72A | protein_coding | deleterious(0) | probably_damaging(1) | TCGA-A6-2684-01 | Colorectum | colon adenocarcinoma | Female | >=65 | I/II | Unknown | Unknown | PD | ||
| TPD52L1 | SNV | Missense_Mutation | c.446N>A | p.Ser149Tyr | p.S149Y | protein_coding | deleterious(0) | possibly_damaging(0.878) | TCGA-A6-6141-01 | Colorectum | colon adenocarcinoma | Male | <65 | I/II | Chemotherapy | 5-fu | SD | ||
| TPD52L1 | SNV | Missense_Mutation | c.501N>T | p.Lys167Asn | p.K167N | protein_coding | deleterious(0) | probably_damaging(0.999) | TCGA-AA-A010-01 | Colorectum | colon adenocarcinoma | Female | <65 | I/II | Chemotherapy | folinic | CR | ||
| TPD52L1 | SNV | Missense_Mutation | rs761264762 | c.214N>A | p.Gly72Ser | p.G72S | protein_coding | deleterious(0) | probably_damaging(1) | TCGA-AD-6964-01 | Colorectum | colon adenocarcinoma | Male | <65 | III/IV | Chemotherapy | folfox | PD | |
| TPD52L1 | SNV | Missense_Mutation | c.605C>T | p.Thr202Ile | p.T202I | protein_coding | tolerated_low_confidence(0.14) | benign(0.006) | TCGA-DM-A1HB-01 | Colorectum | colon adenocarcinoma | Male | >=65 | III/IV | Unknown | Unknown | SD | ||
| TPD52L1 | SNV | Missense_Mutation | rs375008815 | c.602N>A | p.Arg201Gln | p.R201Q | protein_coding | tolerated_low_confidence(0.47) | benign(0) | TCGA-AG-A00Y-01 | Colorectum | rectum adenocarcinoma | Male | >=65 | I/II | Unknown | Unknown | PD | |
| TPD52L1 | SNV | Missense_Mutation | rs774952793 | c.413G>A | p.Arg138His | p.R138H | protein_coding | deleterious(0) | probably_damaging(0.988) | TCGA-F5-6464-01 | Colorectum | rectum adenocarcinoma | Female | >=65 | III/IV | Unknown | Unknown | SD | |
| TPD52L1 | SNV | Missense_Mutation | novel | c.434N>T | p.Ala145Val | p.A145V | protein_coding | tolerated(0.11) | probably_damaging(0.999) | TCGA-A5-A0G2-01 | Endometrium | uterine corpus endometrioid carcinoma | Female | <65 | III/IV | Unknown | Unknown | SD | |
| TPD52L1 | SNV | Missense_Mutation | c.259N>C | p.Trp87Arg | p.W87R | protein_coding | deleterious(0) | probably_damaging(1) | TCGA-AP-A051-01 | Endometrium | uterine corpus endometrioid carcinoma | Female | >=65 | I/II | Unknown | Unknown | SD |
| Page: 1 2 3 4 |
Top |
Related drugs of malignant transformation related genes |
| Identification of chemicals and drugs interact with genes involved in malignant transfromation |
| (DGIdb 4.0) |
| Entrez ID | Symbol | Category | Interaction Types | Drug Claim Name | Drug Name | PMIDs |
| Page: 1 |

Copyright 2023-Present -The University of Texas Health Science Center at Houston |