
|
|||||
|
 | |
| |
| |
| |
| |
| |
|
Gene: TPD52 |
Gene summary for TPD52 |
| Gene information | Species | Human | Gene symbol | TPD52 | Gene ID | 7163 |
| Gene name | tumor protein D52 | |
| Gene Alias | D52 | |
| Cytomap | 8q21.13 | |
| Gene Type | protein-coding | GO ID | GO:0001775 | UniProtAcc | P55327 |
Top |
Malignant transformation analysis |
| Identification of the aberrant gene expression in precancerous and cancerous lesions by comparing the gene expression of stem-like cells in diseased tissues with normal stem cells |
| Entrez ID | Symbol | Replicates | Species | Organ | Tissue | Adj P-value | Log2FC | Malignancy |
| 7163 | TPD52 | GSM4909281 | Human | Breast | IDC | 2.16e-41 | 8.26e-01 | 0.21 |
| 7163 | TPD52 | GSM4909285 | Human | Breast | IDC | 2.79e-06 | 3.35e-01 | 0.21 |
| 7163 | TPD52 | GSM4909290 | Human | Breast | IDC | 3.69e-03 | 3.56e-01 | 0.2096 |
| 7163 | TPD52 | GSM4909291 | Human | Breast | IDC | 7.83e-40 | 9.14e-01 | 0.1753 |
| 7163 | TPD52 | GSM4909293 | Human | Breast | IDC | 5.14e-08 | 3.07e-01 | 0.1581 |
| 7163 | TPD52 | GSM4909294 | Human | Breast | IDC | 1.99e-10 | 3.99e-01 | 0.2022 |
| 7163 | TPD52 | GSM4909296 | Human | Breast | IDC | 1.07e-05 | -2.04e-01 | 0.1524 |
| 7163 | TPD52 | GSM4909297 | Human | Breast | IDC | 1.13e-13 | 1.37e-01 | 0.1517 |
| 7163 | TPD52 | GSM4909304 | Human | Breast | IDC | 6.63e-18 | 5.34e-01 | 0.1636 |
| 7163 | TPD52 | GSM4909306 | Human | Breast | IDC | 5.07e-13 | 5.19e-01 | 0.1564 |
| 7163 | TPD52 | GSM4909308 | Human | Breast | IDC | 2.31e-06 | 3.52e-01 | 0.158 |
| 7163 | TPD52 | GSM4909311 | Human | Breast | IDC | 5.37e-28 | -1.62e-02 | 0.1534 |
| 7163 | TPD52 | GSM4909312 | Human | Breast | IDC | 1.02e-33 | 6.37e-01 | 0.1552 |
| 7163 | TPD52 | GSM4909319 | Human | Breast | IDC | 1.13e-36 | -9.51e-02 | 0.1563 |
| 7163 | TPD52 | GSM4909320 | Human | Breast | IDC | 1.45e-07 | -5.96e-02 | 0.1575 |
| 7163 | TPD52 | GSM4909321 | Human | Breast | IDC | 3.87e-09 | 5.64e-02 | 0.1559 |
| 7163 | TPD52 | brca3 | Human | Breast | Precancer | 8.69e-05 | 2.56e-01 | -0.0263 |
| 7163 | TPD52 | M5 | Human | Breast | IDC | 3.71e-06 | 6.67e-01 | 0.1598 |
| 7163 | TPD52 | NCCBC14 | Human | Breast | DCIS | 3.91e-06 | 1.36e-01 | 0.2021 |
| 7163 | TPD52 | NCCBC5 | Human | Breast | DCIS | 1.19e-07 | -2.34e-01 | 0.2046 |
| Page: 1 2 3 4 5 6 7 8 9 10 11 |
| Tissue | Expression Dynamics | Abbreviation |
| Breast | 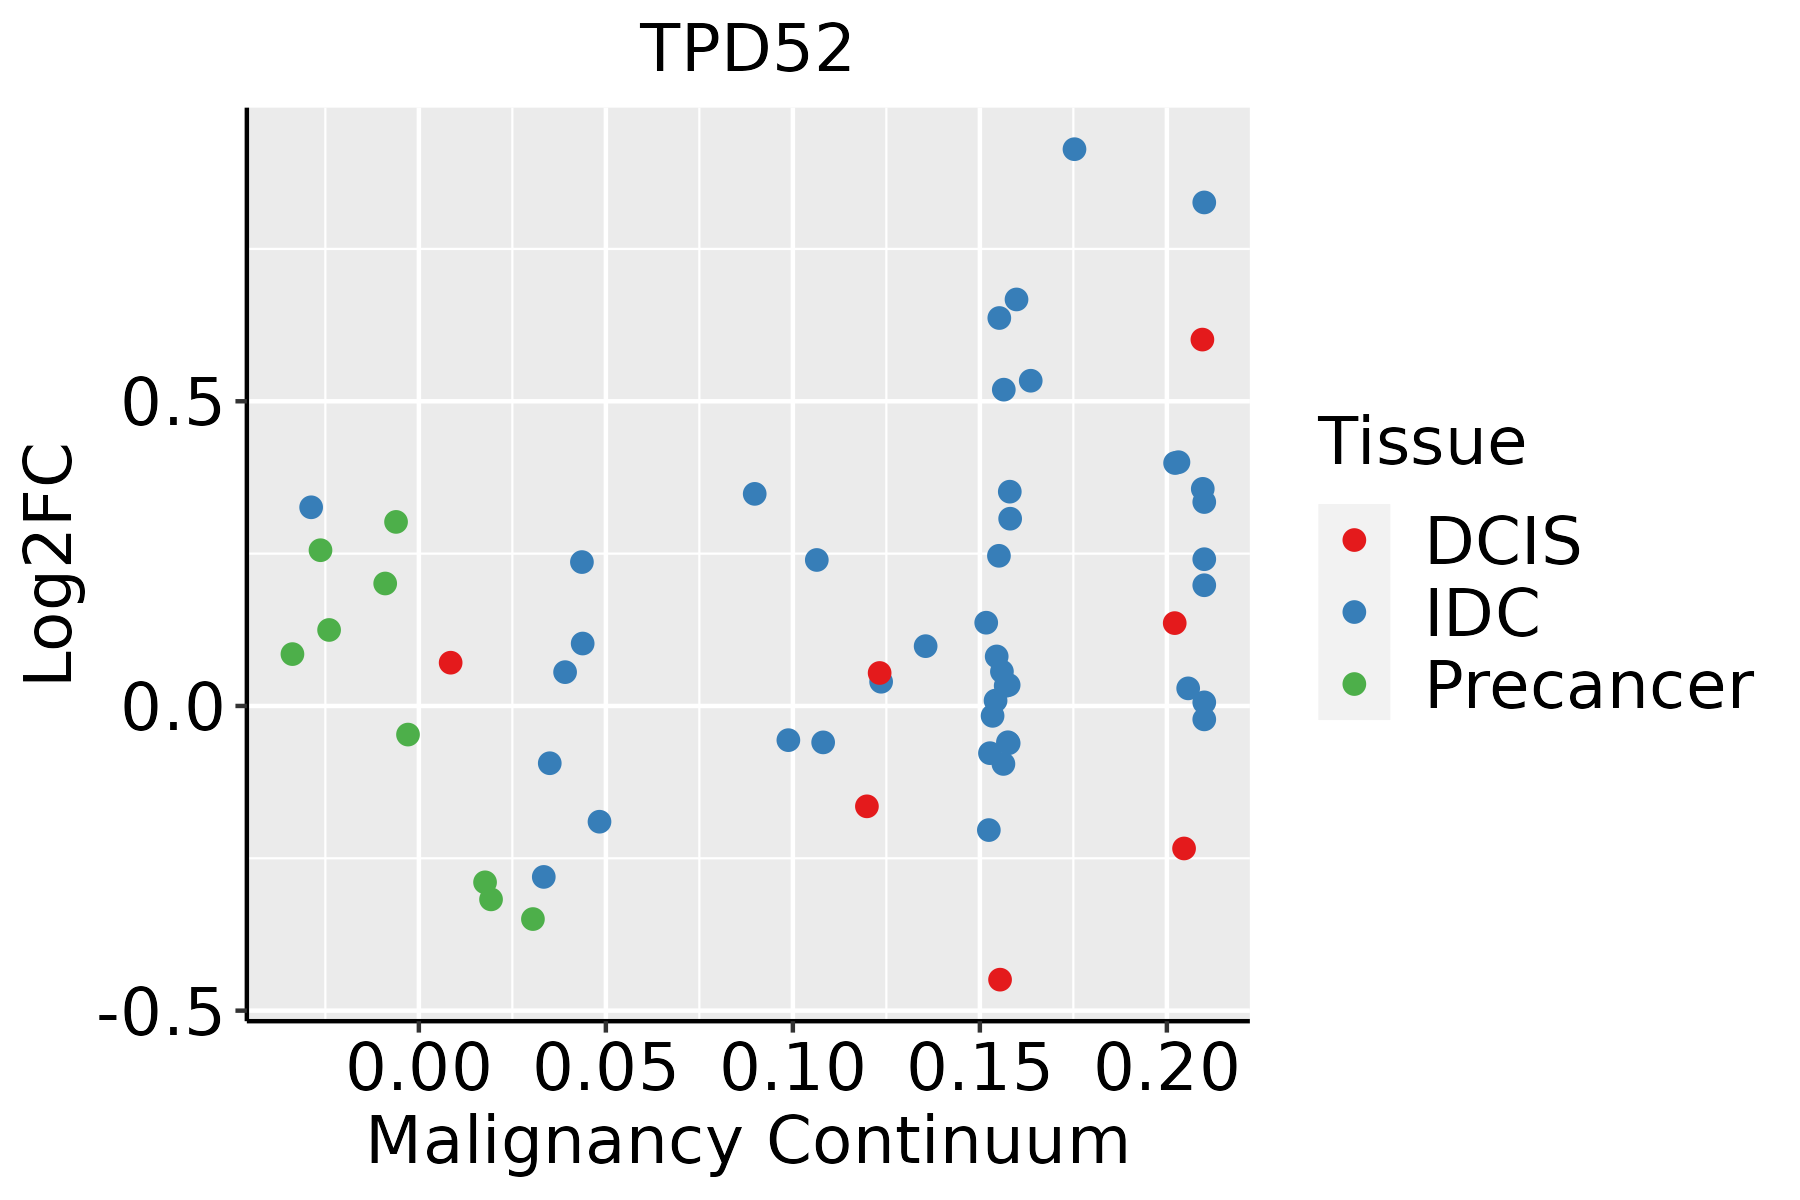 | IDC: Invasive ductal carcinoma |
| DCIS: Ductal carcinoma in situ | ||
| Precancer(BRCA1-mut): Precancerous lesion from BRCA1 mutation carriers | ||
| Cervix | 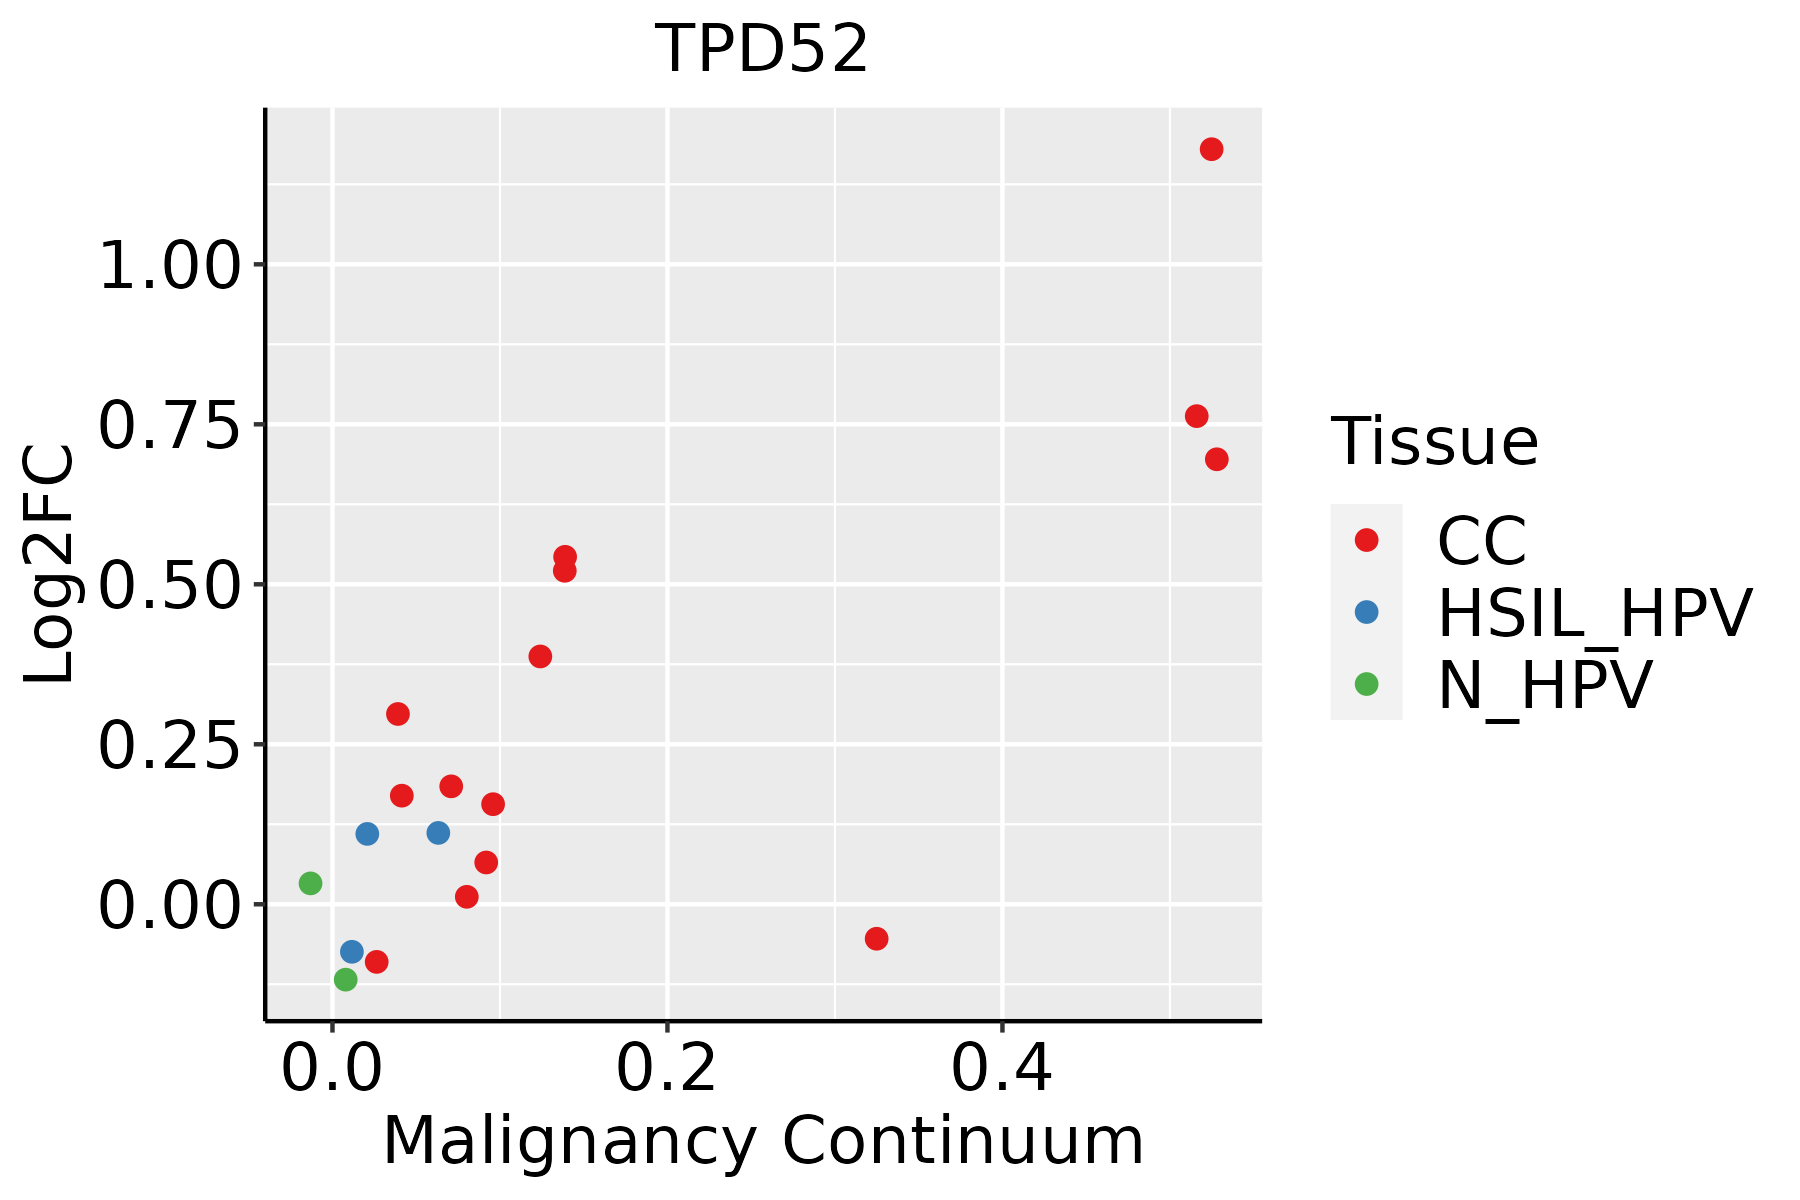 | CC: Cervix cancer |
| HSIL_HPV: HPV-infected high-grade squamous intraepithelial lesions | ||
| N_HPV: HPV-infected normal cervix | ||
| Colorectum (GSE201348) |  | FAP: Familial adenomatous polyposis |
| CRC: Colorectal cancer | ||
| Colorectum (HTA11) |  | AD: Adenomas |
| SER: Sessile serrated lesions | ||
| MSI-H: Microsatellite-high colorectal cancer | ||
| MSS: Microsatellite stable colorectal cancer | ||
| Esophagus | 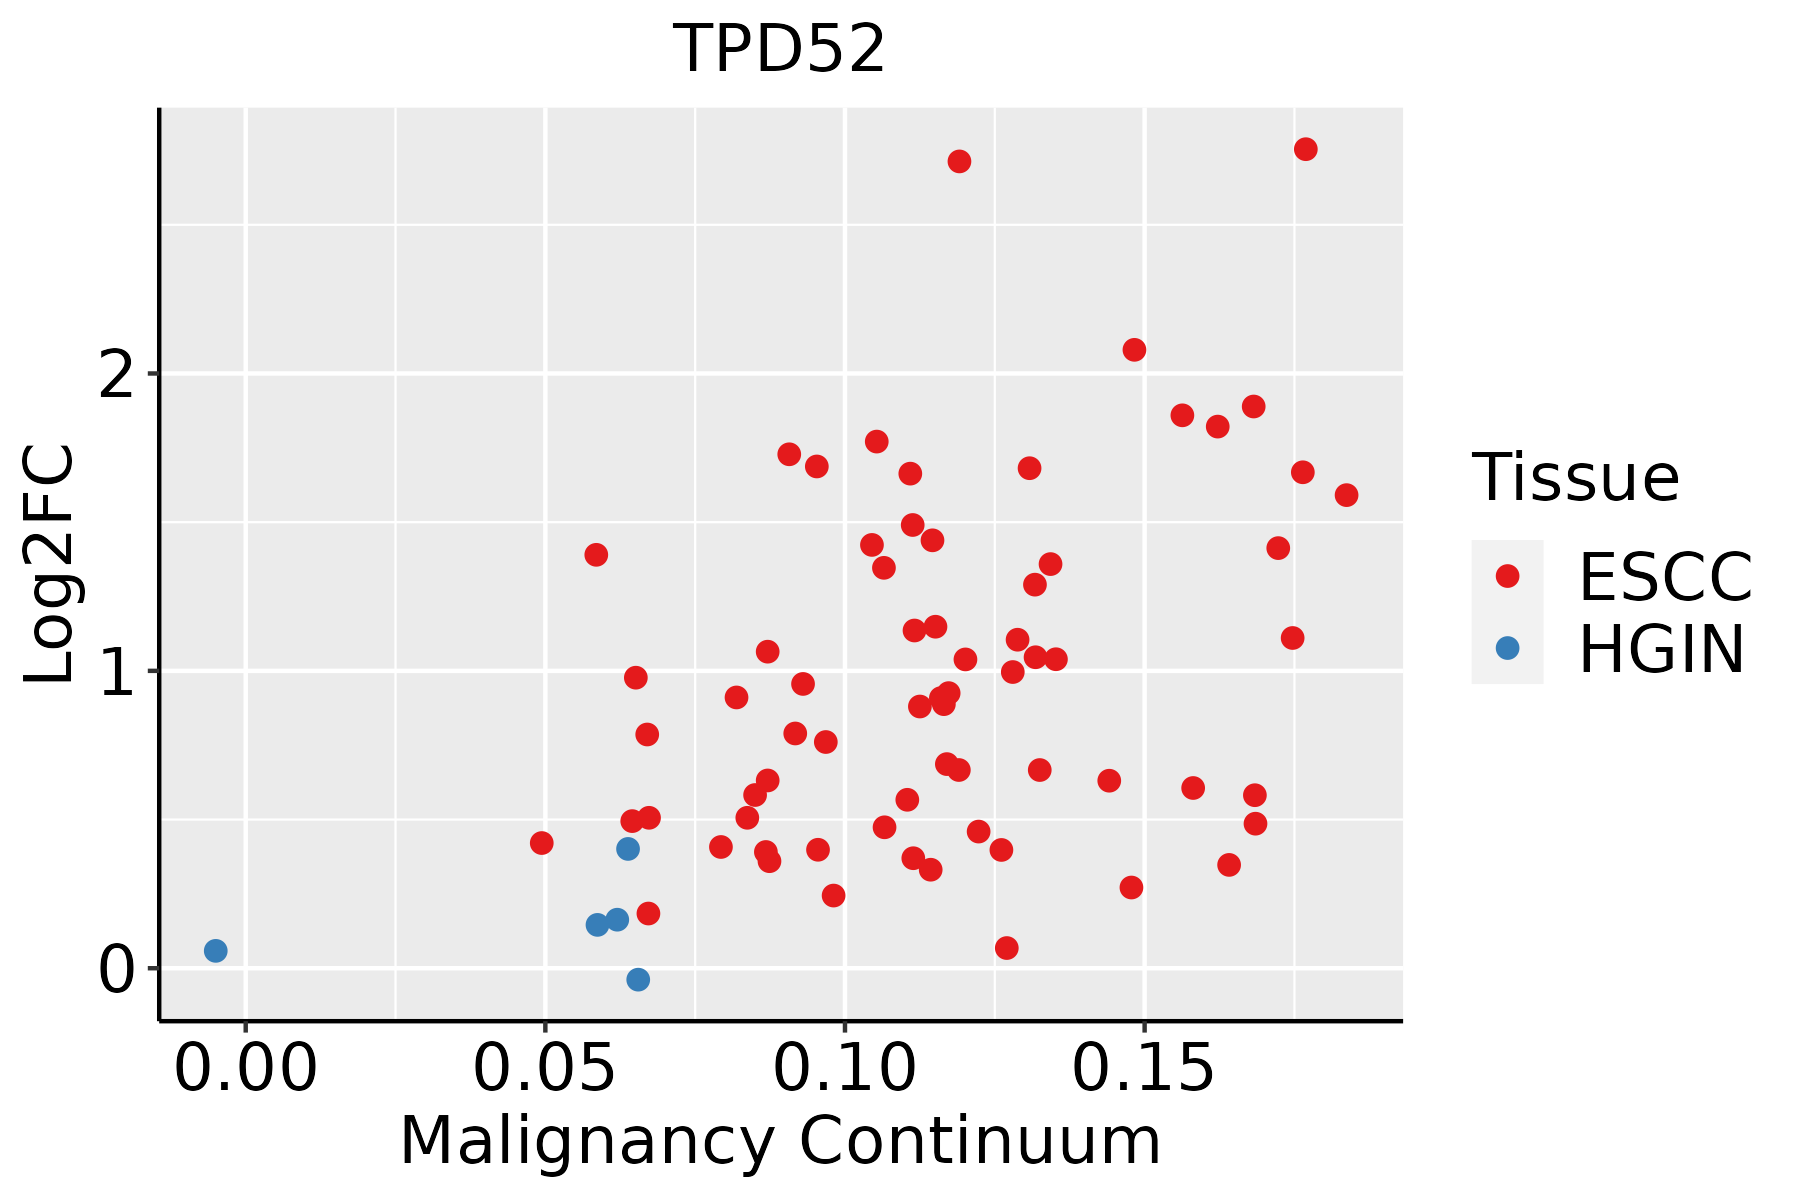 | ESCC: Esophageal squamous cell carcinoma |
| HGIN: High-grade intraepithelial neoplasias | ||
| LGIN: Low-grade intraepithelial neoplasias | ||
| Liver |  | HCC: Hepatocellular carcinoma |
| NAFLD: Non-alcoholic fatty liver disease | ||
| Lung | 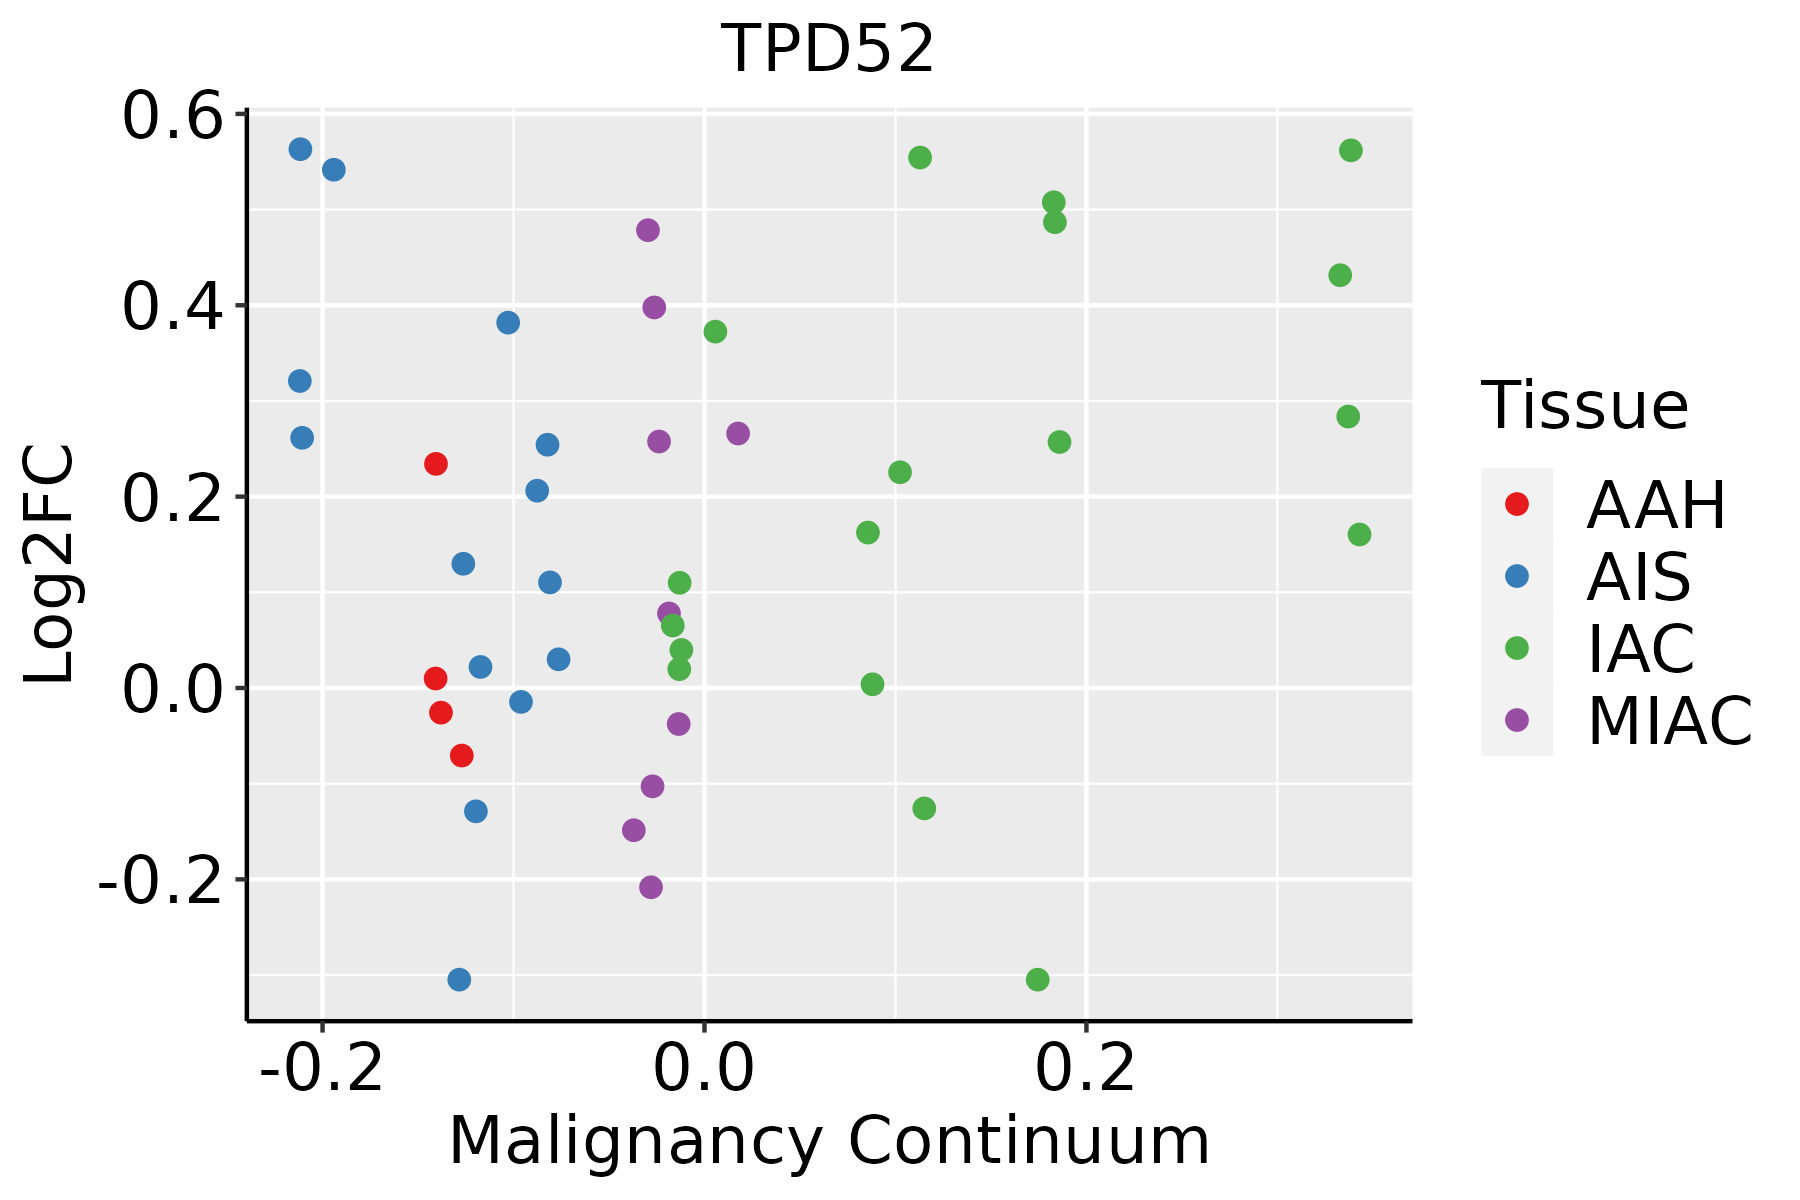 | AAH: Atypical adenomatous hyperplasia |
| AIS: Adenocarcinoma in situ | ||
| IAC: Invasive lung adenocarcinoma | ||
| MIA: Minimally invasive adenocarcinoma | ||
| Oral Cavity | 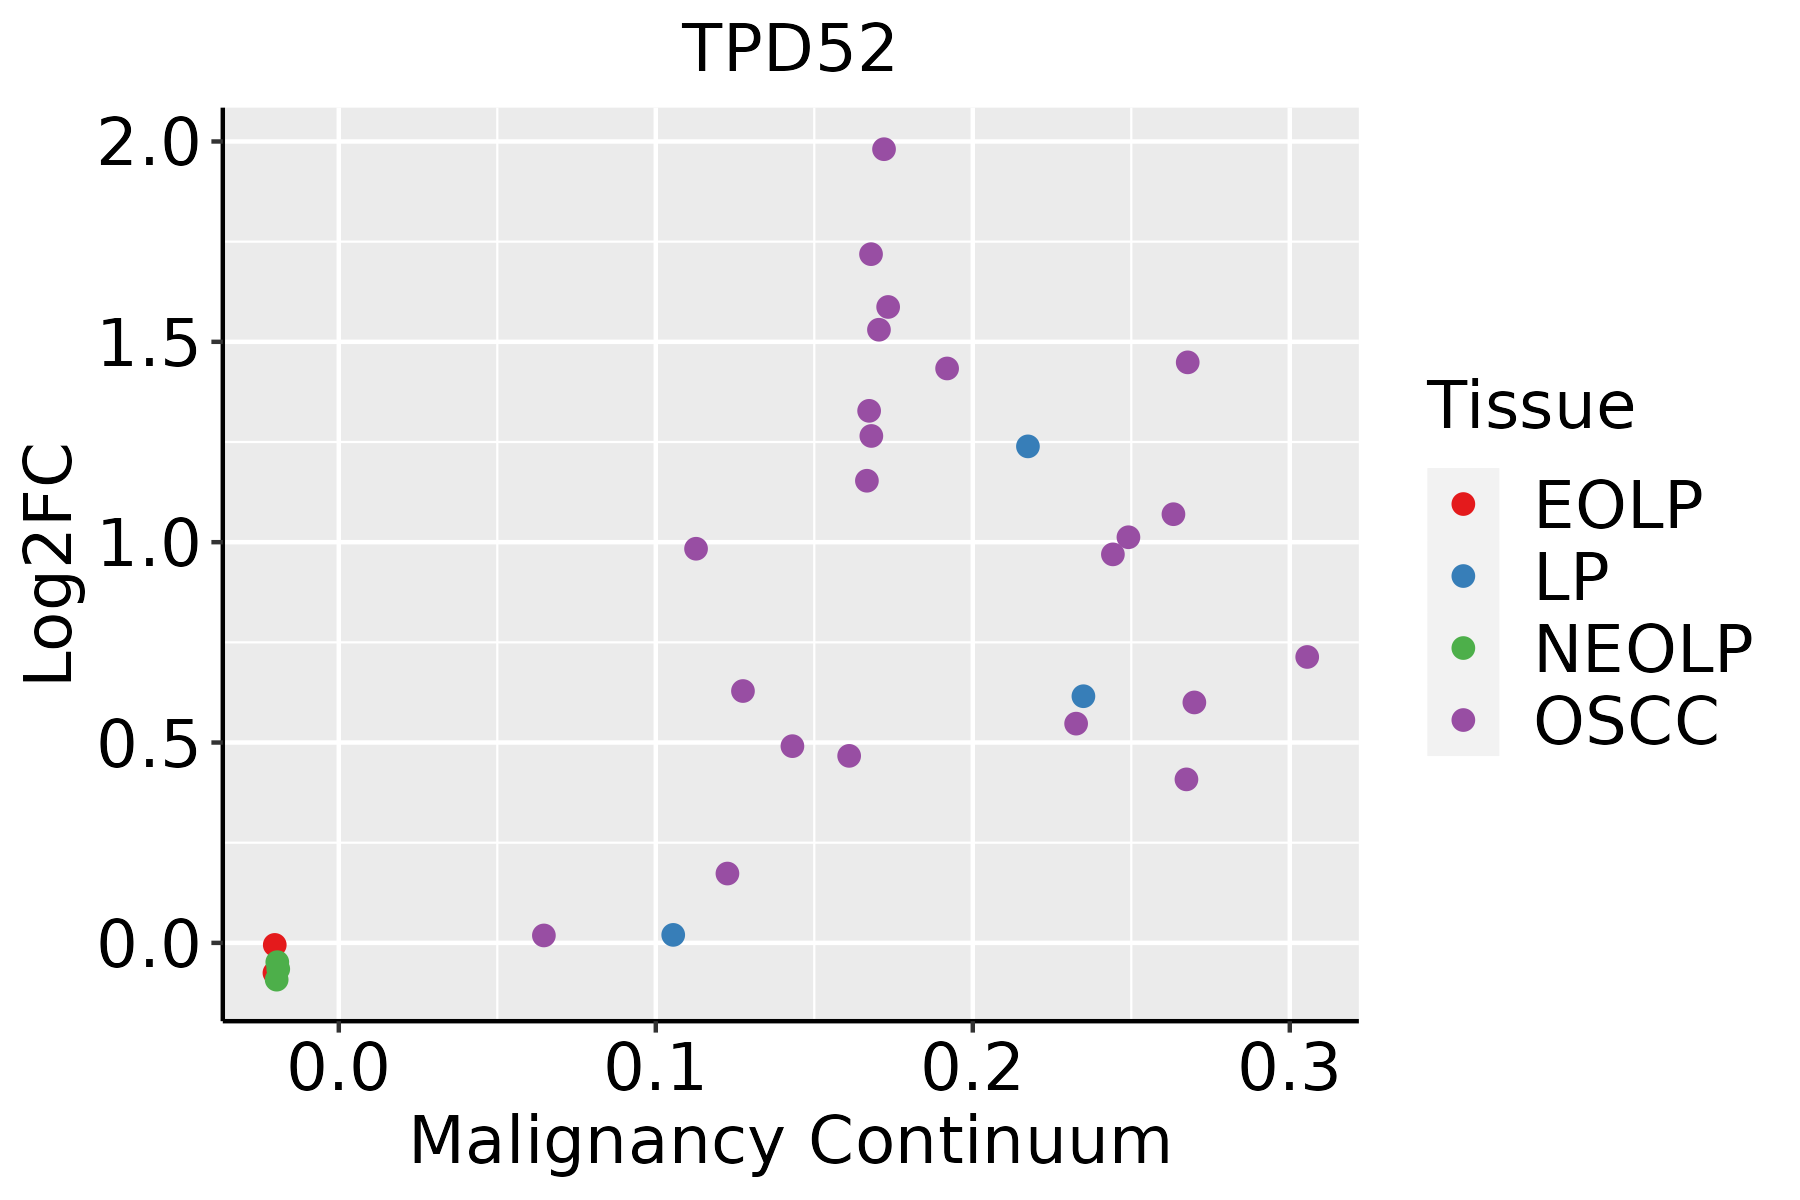 | EOLP: Erosive Oral lichen planus |
| LP: leukoplakia | ||
| NEOLP: Non-erosive oral lichen planus | ||
| OSCC: Oral squamous cell carcinoma | ||
| Prostate | 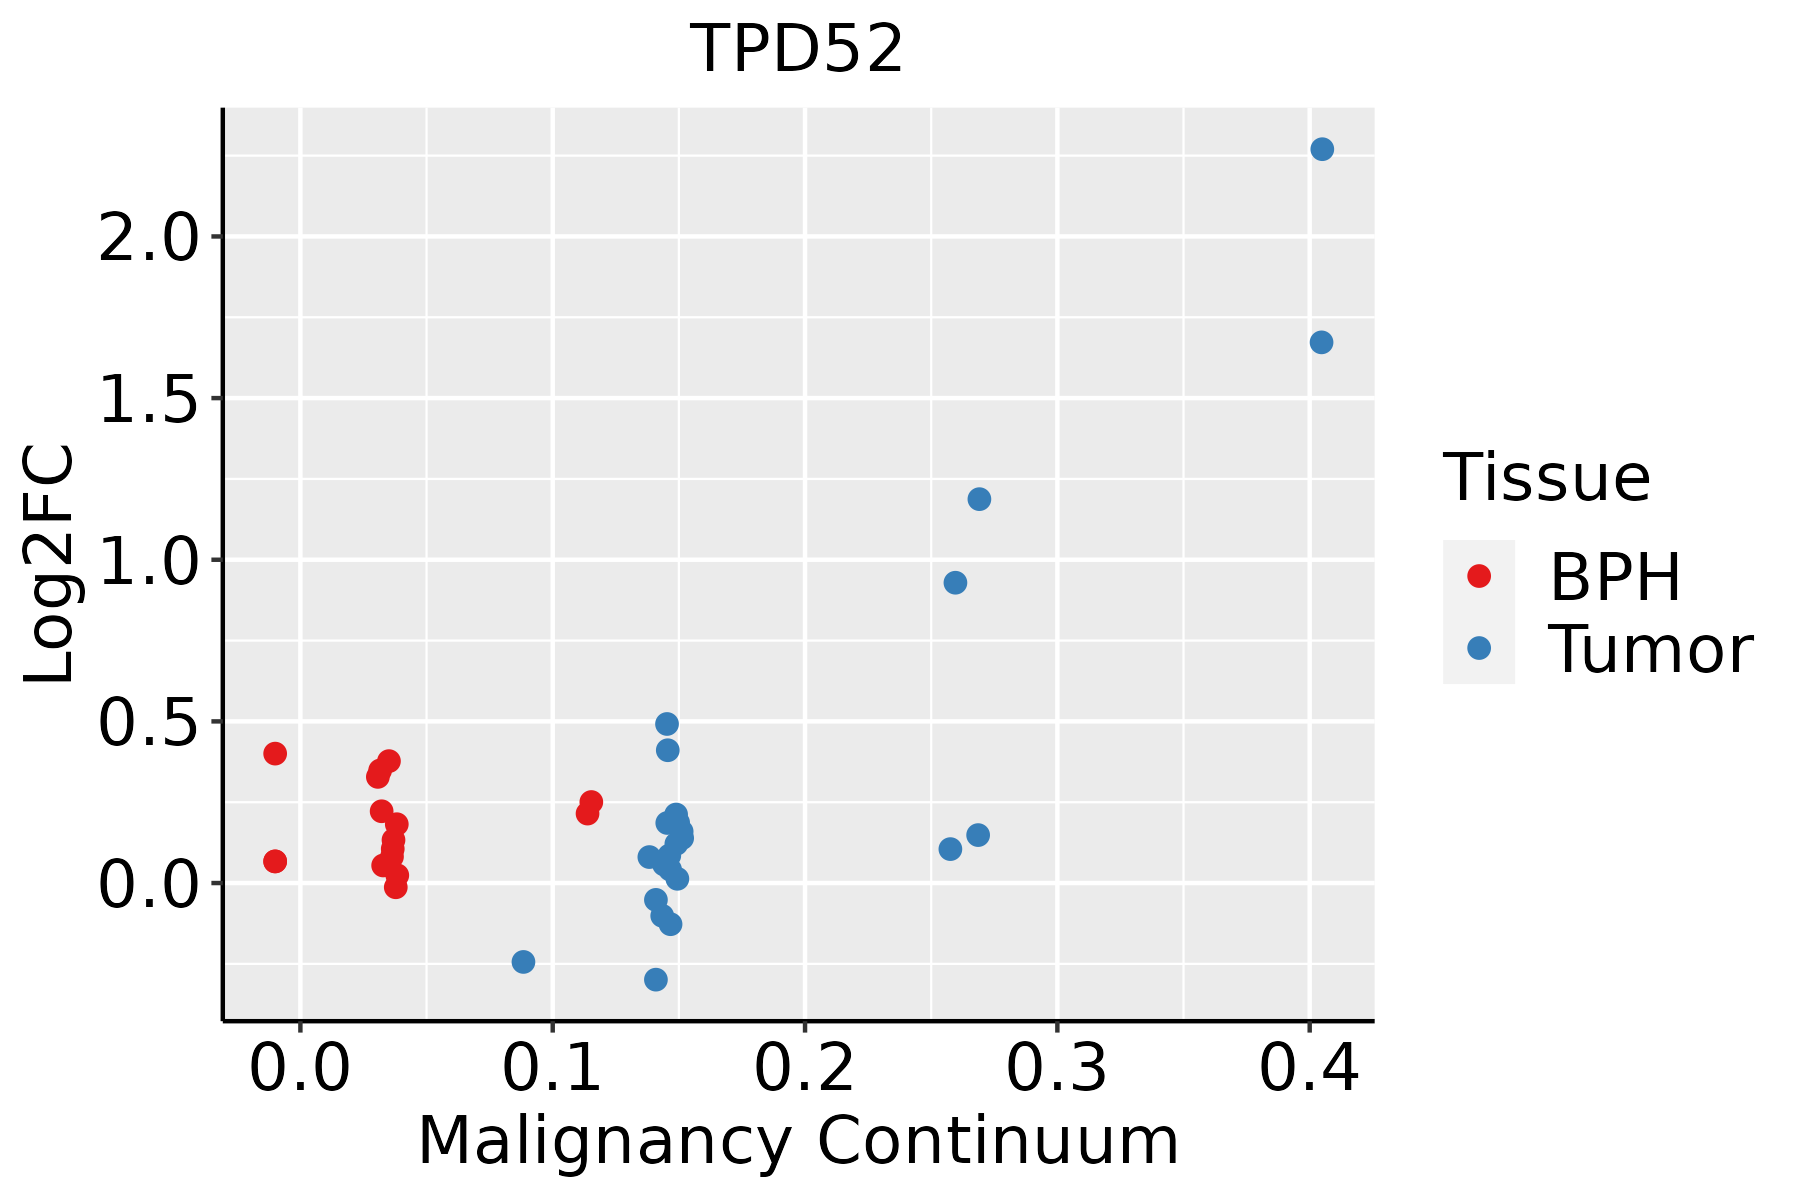 | BPH: Benign Prostatic Hyperplasia |
| Skin | 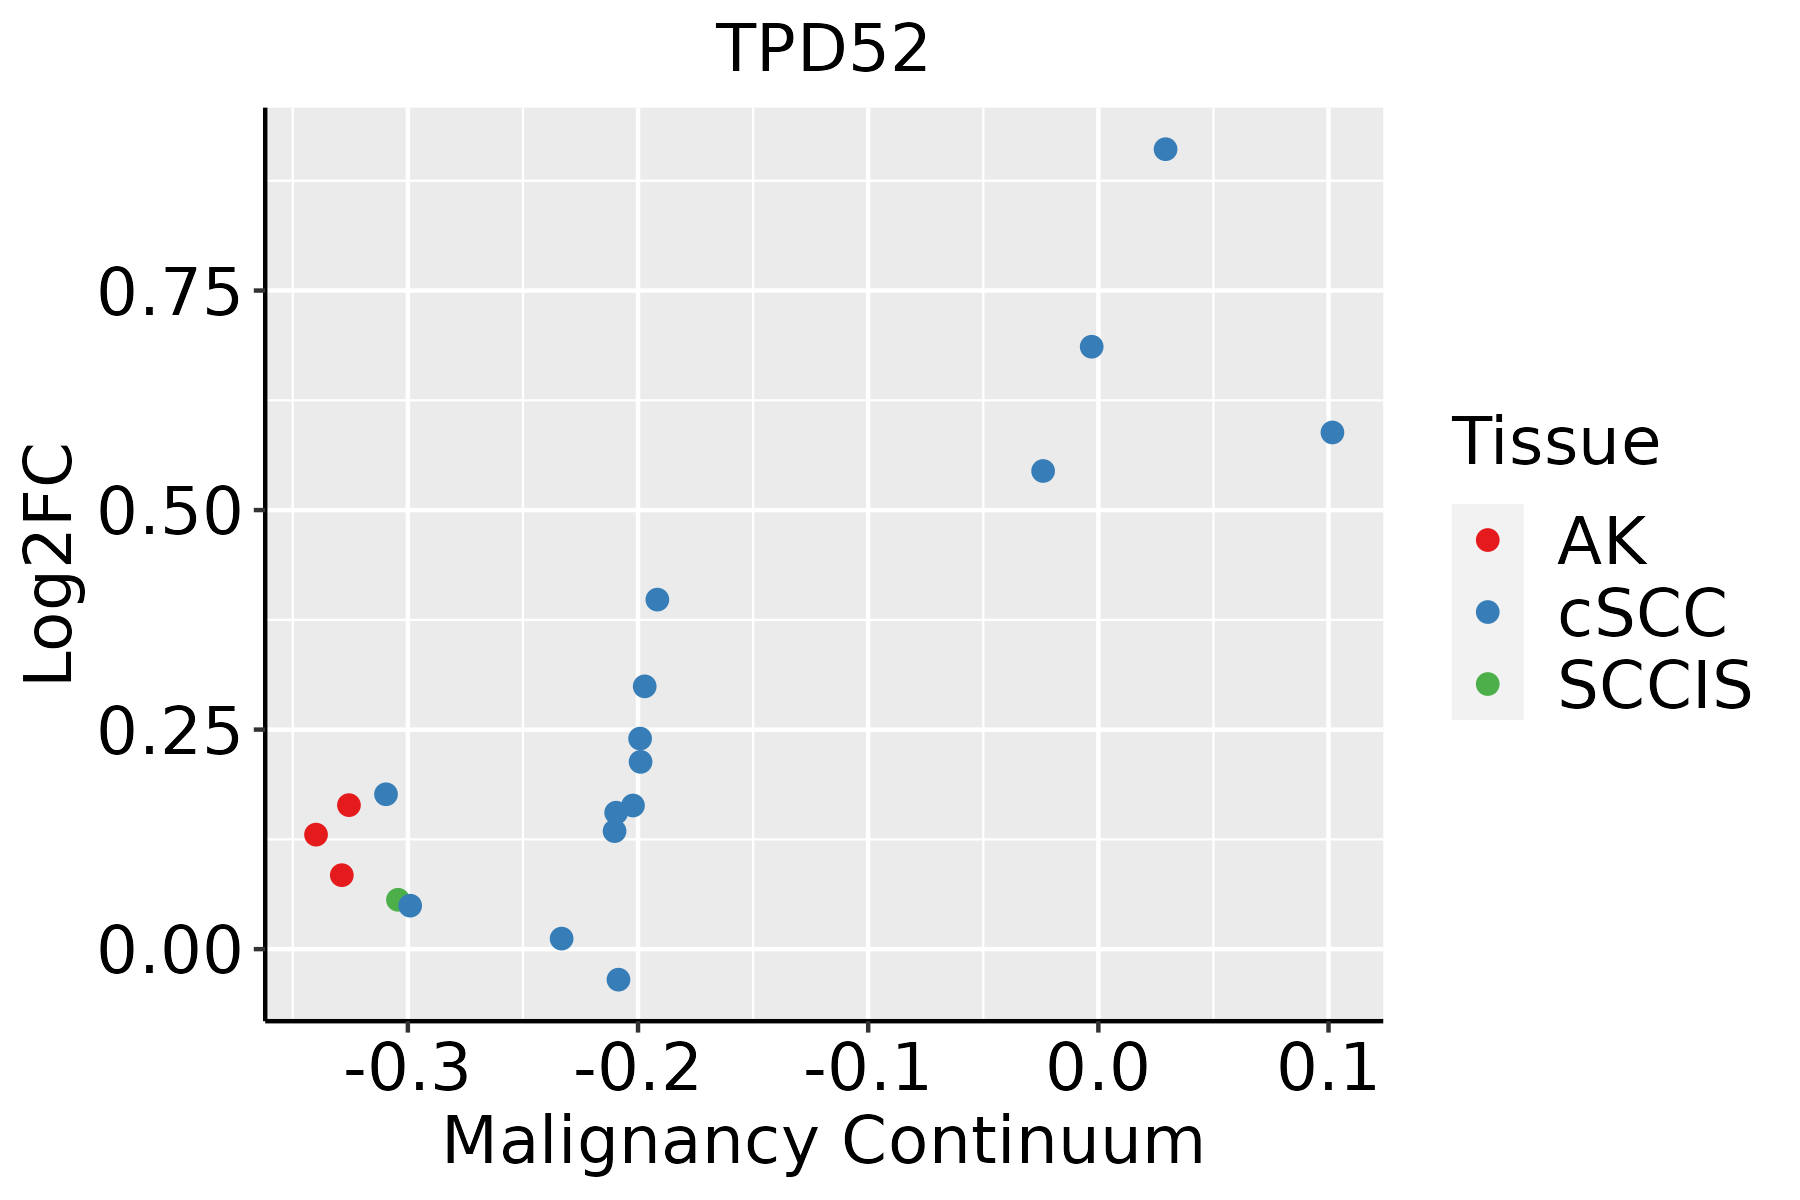 | AK: Actinic keratosis |
| cSCC: Cutaneous squamous cell carcinoma | ||
| SCCIS:squamous cell carcinoma in situ | ||
| Thyroid |  | ATC: Anaplastic thyroid cancer |
| HT: Hashimoto's thyroiditis | ||
| PTC: Papillary thyroid cancer |
| ∗log2FC in expression of this searched gene in stem-like cells from each diseased tissue sample relative to stem-like cells in normal samples in each tissue plotted against the malignancy continuum. Samples are colored based on if they are from different disease stage. |
Top |
Malignant transformation related pathway analysis |
| Find out the enriched GO biological processes and KEGG pathways involved in transition from healthy to precancer to cancer |
| Tissue | Disease Stage | Enriched GO biological Processes |
| Colorectum | AD |  |
| Colorectum | SER |  |
| Colorectum | MSS |  |
| Colorectum | MSI-H |  |
| Colorectum | FAP |  |
| ∗Top 15 enriched GO BP terms are showed in the bar plot of each disease state in each tissue. Each row represents a significant GO biological process which is colored according to the -log10(p.adjust). |
| Page: 1 2 3 4 5 6 7 8 9 |
| GO ID | Tissue | Disease Stage | Description | Gene Ratio | Bg Ratio | pvalue | p.adjust | Count |
| GO:20012339 | Breast | Precancer | regulation of apoptotic signaling pathway | 65/1080 | 356/18723 | 7.70e-17 | 3.17e-14 | 65 |
| GO:20012356 | Breast | Precancer | positive regulation of apoptotic signaling pathway | 24/1080 | 126/18723 | 1.98e-07 | 1.01e-05 | 24 |
| GO:19031313 | Breast | Precancer | mononuclear cell differentiation | 43/1080 | 426/18723 | 2.61e-04 | 3.84e-03 | 43 |
| GO:0030098 | Breast | Precancer | lymphocyte differentiation | 36/1080 | 374/18723 | 1.85e-03 | 1.81e-02 | 36 |
| GO:00336749 | Breast | Precancer | positive regulation of kinase activity | 42/1080 | 467/18723 | 2.94e-03 | 2.54e-02 | 42 |
| GO:200123314 | Breast | IDC | regulation of apoptotic signaling pathway | 82/1434 | 356/18723 | 6.27e-20 | 5.93e-17 | 82 |
| GO:200123514 | Breast | IDC | positive regulation of apoptotic signaling pathway | 31/1434 | 126/18723 | 4.13e-09 | 3.35e-07 | 31 |
| GO:190313111 | Breast | IDC | mononuclear cell differentiation | 51/1434 | 426/18723 | 9.81e-04 | 1.11e-02 | 51 |
| GO:200123324 | Breast | DCIS | regulation of apoptotic signaling pathway | 81/1390 | 356/18723 | 3.51e-20 | 3.31e-17 | 81 |
| GO:200123523 | Breast | DCIS | positive regulation of apoptotic signaling pathway | 31/1390 | 126/18723 | 1.96e-09 | 1.76e-07 | 31 |
| GO:19031312 | Breast | DCIS | mononuclear cell differentiation | 51/1390 | 426/18723 | 4.88e-04 | 6.40e-03 | 51 |
| GO:00447724 | Breast | DCIS | mitotic cell cycle phase transition | 46/1390 | 424/18723 | 6.16e-03 | 4.39e-02 | 46 |
| GO:19031314 | Cervix | CC | mononuclear cell differentiation | 76/2311 | 426/18723 | 5.66e-04 | 5.42e-03 | 76 |
| GO:00300981 | Cervix | CC | lymphocyte differentiation | 63/2311 | 374/18723 | 6.21e-03 | 3.52e-02 | 63 |
| GO:1903131 | Colorectum | FAP | mononuclear cell differentiation | 79/2622 | 426/18723 | 5.00e-03 | 3.33e-02 | 79 |
| GO:2001233111 | Esophagus | ESCC | regulation of apoptotic signaling pathway | 256/8552 | 356/18723 | 4.11e-24 | 1.04e-21 | 256 |
| GO:004477216 | Esophagus | ESCC | mitotic cell cycle phase transition | 281/8552 | 424/18723 | 4.63e-18 | 4.45e-16 | 281 |
| GO:007190016 | Esophagus | ESCC | regulation of protein serine/threonine kinase activity | 227/8552 | 359/18723 | 1.12e-11 | 4.10e-10 | 227 |
| GO:2001235110 | Esophagus | ESCC | positive regulation of apoptotic signaling pathway | 92/8552 | 126/18723 | 3.91e-10 | 1.05e-08 | 92 |
| GO:00448394 | Esophagus | ESCC | cell cycle G2/M phase transition | 103/8552 | 148/18723 | 3.09e-09 | 6.67e-08 | 103 |
| Page: 1 2 3 4 5 6 7 8 9 10 |
| Pathway ID | Tissue | Disease Stage | Description | Gene Ratio | Bg Ratio | pvalue | p.adjust | qvalue | Count |
| Page: 1 |
Top |
Cell-cell communication analysis |
| Identification of potential cell-cell interactions between two cell types and their ligand-receptor pairs for different disease states |
| Ligand | Receptor | LRpair | Pathway | Tissue | Disease Stage |
| Page: 1 |
Top |
Single-cell gene regulatory network inference analysis |
| Find out the significant the regulons (TFs) and the target genes of each regulon across cell types for different disease states |
| TF | Cell Type | Tissue | Disease Stage | Target Gene | RSS | Regulon Activity |
| ∗The dot plots of a searched regulon are shown for all cell subpopulations in each disease state of each tissue based on the regulon specific score inferred using pySCENIC and by calculating the average expression. |
| Page: 1 |
Top |
Somatic mutation of malignant transformation related genes |
| Annotation of somatic variants for genes involved in malignant transformation |
| Hugo Symbol | Variant Class | Variant Classification | dbSNP RS | HGVSc | HGVSp | HGVSp Short | SWISSPROT | BIOTYPE | SIFT | PolyPhen | Tumor Sample Barcode | Tissue | Histology | Sex | Age | Stage | Therapy Types | Drugs | Outcome |
| TPD52 | SNV | Missense_Mutation | novel | c.335N>T | p.Gly112Val | p.G112V | P55327 | protein_coding | deleterious(0.01) | probably_damaging(0.992) | TCGA-AN-A046-01 | Breast | breast invasive carcinoma | Female | >=65 | I/II | Unknown | Unknown | SD |
| TPD52 | SNV | Missense_Mutation | c.283N>G | p.Gln95Glu | p.Q95E | P55327 | protein_coding | deleterious(0) | possibly_damaging(0.858) | TCGA-C8-A1HM-01 | Breast | breast invasive carcinoma | Female | >=65 | I/II | Chemotherapy | doxorubicin | CR | |
| TPD52 | SNV | Missense_Mutation | novel | c.151N>C | p.Thr51Pro | p.T51P | P55327 | protein_coding | tolerated(0.26) | benign(0.029) | TCGA-PE-A5DC-01 | Breast | breast invasive carcinoma | Female | >=65 | III/IV | Unknown | Unknown | SD |
| TPD52 | SNV | Missense_Mutation | c.682G>A | p.Ala228Thr | p.A228T | P55327 | protein_coding | tolerated(1) | benign(0.022) | TCGA-AA-3864-01 | Colorectum | colon adenocarcinoma | Male | >=65 | I/II | Unknown | Unknown | SD | |
| TPD52 | SNV | Missense_Mutation | rs377167805 | c.737N>A | p.Ser246Asn | p.S246N | P55327 | protein_coding | tolerated_low_confidence(0.28) | benign(0.001) | TCGA-AA-3984-01 | Colorectum | colon adenocarcinoma | Female | <65 | I/II | Unknown | Unknown | SD |
| TPD52 | SNV | Missense_Mutation | rs375764073 | c.539G>A | p.Arg180His | p.R180H | P55327 | protein_coding | tolerated(0.36) | probably_damaging(0.973) | TCGA-AA-A010-01 | Colorectum | colon adenocarcinoma | Female | <65 | I/II | Chemotherapy | folinic | CR |
| TPD52 | SNV | Missense_Mutation | c.611N>C | p.Val204Ala | p.V204A | P55327 | protein_coding | deleterious(0.01) | probably_damaging(0.955) | TCGA-G4-6302-01 | Colorectum | colon adenocarcinoma | Female | >=65 | I/II | Unknown | Unknown | SD | |
| TPD52 | SNV | Missense_Mutation | novel | c.253A>C | p.Lys85Gln | p.K85Q | P55327 | protein_coding | tolerated(0.13) | possibly_damaging(0.547) | TCGA-A5-A1OF-01 | Endometrium | uterine corpus endometrioid carcinoma | Female | <65 | I/II | Unknown | Unknown | SD |
| TPD52 | SNV | Missense_Mutation | rs150326619 | c.215C>T | p.Ser72Leu | p.S72L | P55327 | protein_coding | deleterious(0.02) | benign(0.199) | TCGA-AX-A05S-01 | Endometrium | uterine corpus endometrioid carcinoma | Female | >=65 | III/IV | Unspecific | Carboplatin & Paclitaxel | PD |
| TPD52 | SNV | Missense_Mutation | rs778829541 | c.538N>T | p.Arg180Cys | p.R180C | P55327 | protein_coding | tolerated(0.1) | probably_damaging(0.991) | TCGA-AX-A06F-01 | Endometrium | uterine corpus endometrioid carcinoma | Female | <65 | III/IV | Chemotherapy | carboplatin | SD |
| Page: 1 2 3 |
Top |
Related drugs of malignant transformation related genes |
| Identification of chemicals and drugs interact with genes involved in malignant transfromation |
| (DGIdb 4.0) |
| Entrez ID | Symbol | Category | Interaction Types | Drug Claim Name | Drug Name | PMIDs |
| Page: 1 |

Copyright 2023-Present -The University of Texas Health Science Center at Houston |