
|
|||||
|
 | |
| |
| |
| |
| |
| |
|
Gene: TPCN2 |
Gene summary for TPCN2 |
| Gene information | Species | Human | Gene symbol | TPCN2 | Gene ID | 219931 |
| Gene name | two pore segment channel 2 | |
| Gene Alias | SHEP10 | |
| Cytomap | 11q13.3 | |
| Gene Type | protein-coding | GO ID | GO:0003008 | UniProtAcc | Q59G56 |
Top |
Malignant transformation analysis |
| Identification of the aberrant gene expression in precancerous and cancerous lesions by comparing the gene expression of stem-like cells in diseased tissues with normal stem cells |
| Entrez ID | Symbol | Replicates | Species | Organ | Tissue | Adj P-value | Log2FC | Malignancy |
| 219931 | TPCN2 | LZE4T | Human | Esophagus | ESCC | 1.10e-03 | 2.07e-01 | 0.0811 |
| 219931 | TPCN2 | LZE8T | Human | Esophagus | ESCC | 8.59e-21 | 6.28e-01 | 0.067 |
| 219931 | TPCN2 | LZE20T | Human | Esophagus | ESCC | 2.13e-04 | 1.82e-01 | 0.0662 |
| 219931 | TPCN2 | LZE21D1 | Human | Esophagus | HGIN | 2.41e-05 | 6.37e-01 | 0.0632 |
| 219931 | TPCN2 | LZE22T | Human | Esophagus | ESCC | 1.43e-04 | 3.74e-01 | 0.068 |
| 219931 | TPCN2 | LZE21T | Human | Esophagus | ESCC | 5.02e-11 | 4.94e-01 | 0.0655 |
| 219931 | TPCN2 | P1T-E | Human | Esophagus | ESCC | 6.35e-10 | 4.48e-01 | 0.0875 |
| 219931 | TPCN2 | P2T-E | Human | Esophagus | ESCC | 9.20e-06 | 1.13e-01 | 0.1177 |
| 219931 | TPCN2 | P5T-E | Human | Esophagus | ESCC | 4.44e-08 | 1.57e-01 | 0.1327 |
| 219931 | TPCN2 | P8T-E | Human | Esophagus | ESCC | 4.17e-05 | 9.77e-02 | 0.0889 |
| 219931 | TPCN2 | P10T-E | Human | Esophagus | ESCC | 8.84e-05 | 8.26e-02 | 0.116 |
| 219931 | TPCN2 | P12T-E | Human | Esophagus | ESCC | 4.31e-06 | 1.41e-01 | 0.1122 |
| 219931 | TPCN2 | P15T-E | Human | Esophagus | ESCC | 2.69e-07 | 1.93e-01 | 0.1149 |
| 219931 | TPCN2 | P16T-E | Human | Esophagus | ESCC | 4.41e-07 | 1.50e-01 | 0.1153 |
| 219931 | TPCN2 | P17T-E | Human | Esophagus | ESCC | 4.54e-05 | 2.54e-01 | 0.1278 |
| 219931 | TPCN2 | P20T-E | Human | Esophagus | ESCC | 1.55e-05 | 1.81e-01 | 0.1124 |
| 219931 | TPCN2 | P21T-E | Human | Esophagus | ESCC | 4.40e-09 | 1.87e-01 | 0.1617 |
| 219931 | TPCN2 | P22T-E | Human | Esophagus | ESCC | 1.59e-30 | 4.86e-01 | 0.1236 |
| 219931 | TPCN2 | P24T-E | Human | Esophagus | ESCC | 6.57e-06 | 1.18e-01 | 0.1287 |
| 219931 | TPCN2 | P26T-E | Human | Esophagus | ESCC | 5.57e-40 | 5.91e-01 | 0.1276 |
| Page: 1 2 3 |
| Tissue | Expression Dynamics | Abbreviation |
| Esophagus | 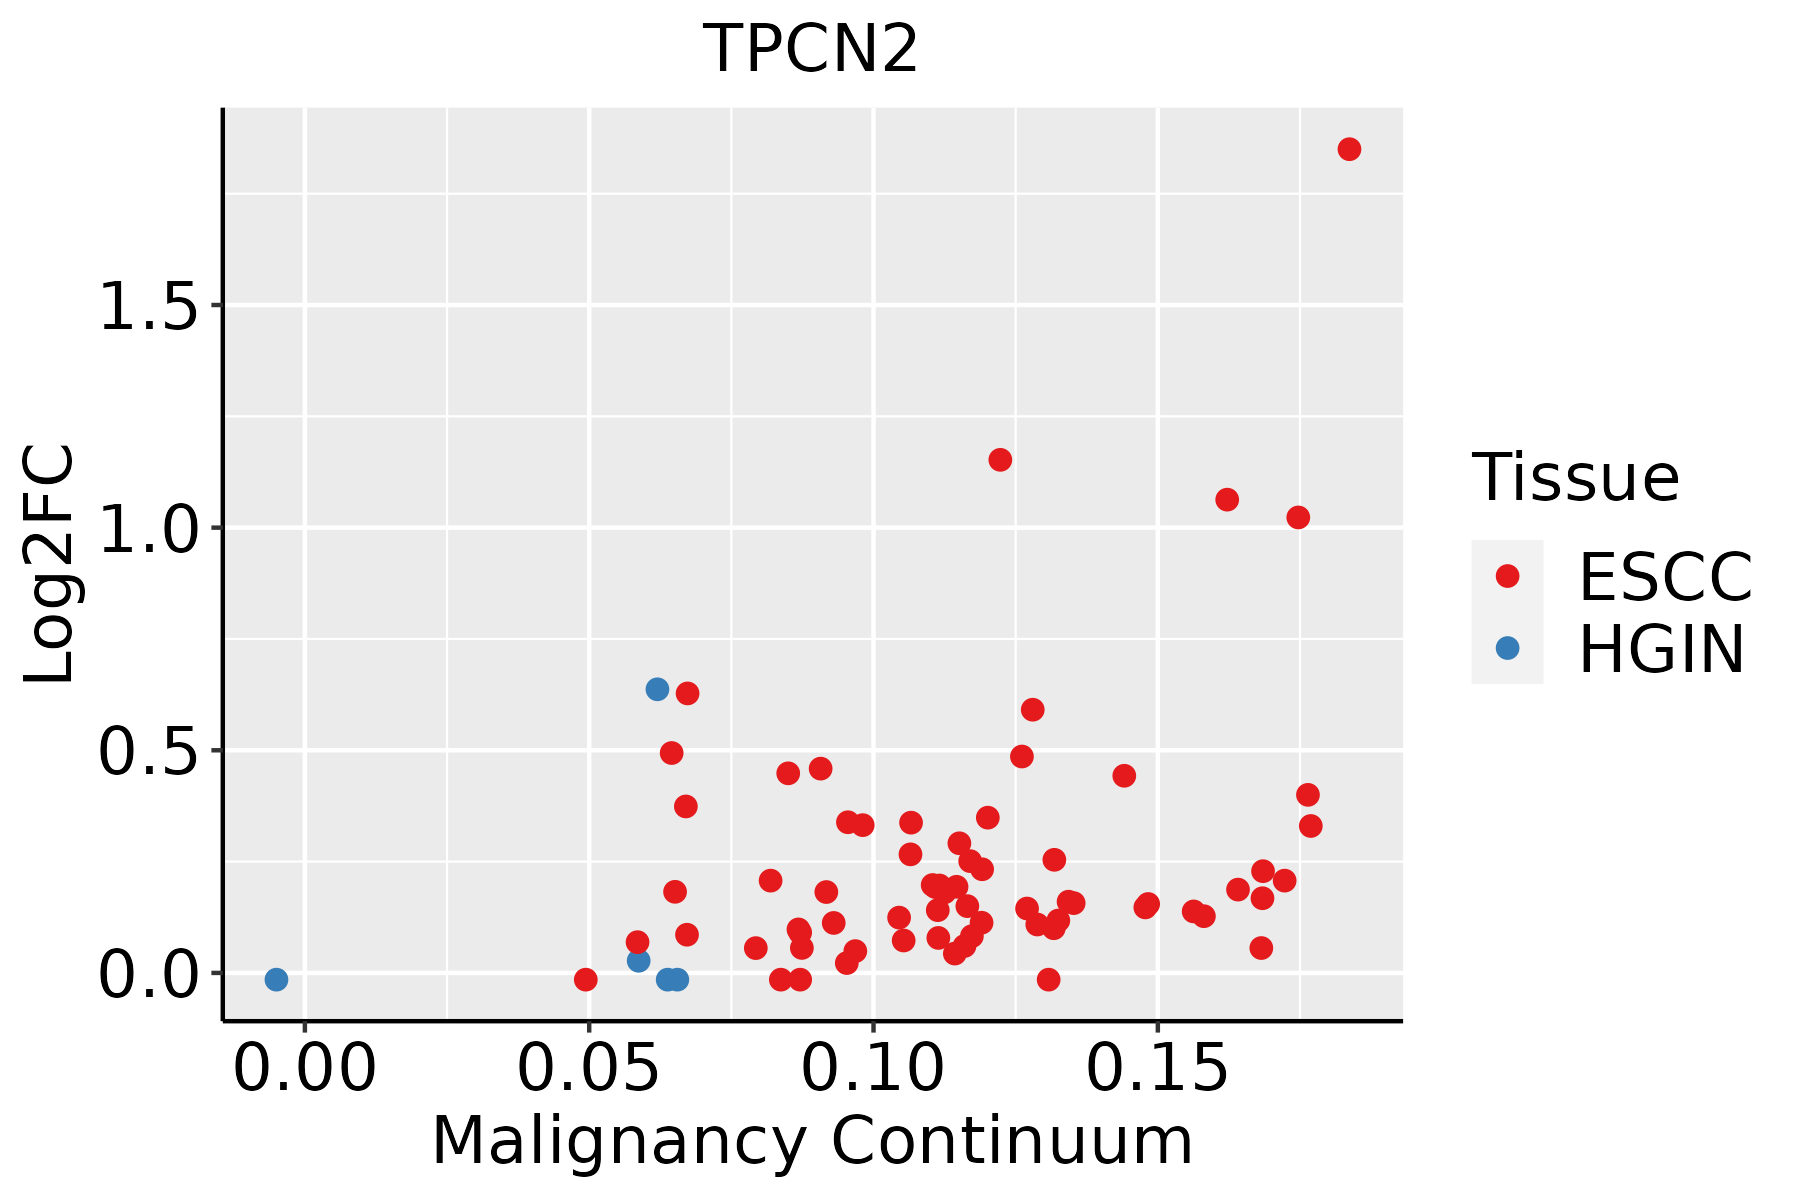 | ESCC: Esophageal squamous cell carcinoma |
| HGIN: High-grade intraepithelial neoplasias | ||
| LGIN: Low-grade intraepithelial neoplasias | ||
| Oral Cavity |  | EOLP: Erosive Oral lichen planus |
| LP: leukoplakia | ||
| NEOLP: Non-erosive oral lichen planus | ||
| OSCC: Oral squamous cell carcinoma |
| ∗log2FC in expression of this searched gene in stem-like cells from each diseased tissue sample relative to stem-like cells in normal samples in each tissue plotted against the malignancy continuum. Samples are colored based on if they are from different disease stage. |
Top |
Malignant transformation related pathway analysis |
| Find out the enriched GO biological processes and KEGG pathways involved in transition from healthy to precancer to cancer |
| Tissue | Disease Stage | Enriched GO biological Processes |
| Colorectum | AD |  |
| Colorectum | SER |  |
| Colorectum | MSS |  |
| Colorectum | MSI-H |  |
| Colorectum | FAP |  |
| ∗Top 15 enriched GO BP terms are showed in the bar plot of each disease state in each tissue. Each row represents a significant GO biological process which is colored according to the -log10(p.adjust). |
| Page: 1 2 3 4 5 6 7 8 9 |
| GO ID | Tissue | Disease Stage | Description | Gene Ratio | Bg Ratio | pvalue | p.adjust | Count |
| GO:001603227 | Esophagus | HGIN | viral process | 118/2587 | 415/18723 | 3.01e-15 | 6.22e-13 | 118 |
| GO:001905827 | Esophagus | HGIN | viral life cycle | 93/2587 | 317/18723 | 3.66e-13 | 5.63e-11 | 93 |
| GO:001050616 | Esophagus | HGIN | regulation of autophagy | 84/2587 | 317/18723 | 1.39e-09 | 1.08e-07 | 84 |
| GO:004440326 | Esophagus | HGIN | biological process involved in symbiotic interaction | 71/2587 | 290/18723 | 7.09e-07 | 3.00e-05 | 71 |
| GO:005170127 | Esophagus | HGIN | biological process involved in interaction with host | 51/2587 | 203/18723 | 1.16e-05 | 3.29e-04 | 51 |
| GO:005165126 | Esophagus | HGIN | maintenance of location in cell | 53/2587 | 214/18723 | 1.22e-05 | 3.45e-04 | 53 |
| GO:005123520 | Esophagus | HGIN | maintenance of location | 73/2587 | 327/18723 | 1.73e-05 | 4.71e-04 | 73 |
| GO:00070336 | Esophagus | HGIN | vacuole organization | 44/2587 | 180/18723 | 8.97e-05 | 1.96e-03 | 44 |
| GO:005212627 | Esophagus | HGIN | movement in host environment | 43/2587 | 175/18723 | 9.45e-05 | 2.03e-03 | 43 |
| GO:004440927 | Esophagus | HGIN | entry into host | 34/2587 | 151/18723 | 2.43e-03 | 2.43e-02 | 34 |
| GO:000703416 | Esophagus | HGIN | vacuolar transport | 35/2587 | 157/18723 | 2.52e-03 | 2.51e-02 | 35 |
| GO:0016032111 | Esophagus | ESCC | viral process | 301/8552 | 415/18723 | 3.34e-29 | 1.32e-26 | 301 |
| GO:0019058111 | Esophagus | ESCC | viral life cycle | 226/8552 | 317/18723 | 1.17e-20 | 1.76e-18 | 226 |
| GO:001050617 | Esophagus | ESCC | regulation of autophagy | 220/8552 | 317/18723 | 6.72e-18 | 6.36e-16 | 220 |
| GO:000703417 | Esophagus | ESCC | vacuolar transport | 119/8552 | 157/18723 | 1.16e-14 | 6.30e-13 | 119 |
| GO:001648210 | Esophagus | ESCC | cytosolic transport | 124/8552 | 168/18723 | 9.69e-14 | 4.69e-12 | 124 |
| GO:000703314 | Esophagus | ESCC | vacuole organization | 127/8552 | 180/18723 | 1.04e-11 | 3.85e-10 | 127 |
| GO:0044403111 | Esophagus | ESCC | biological process involved in symbiotic interaction | 186/8552 | 290/18723 | 1.43e-10 | 4.16e-09 | 186 |
| GO:0051701111 | Esophagus | ESCC | biological process involved in interaction with host | 135/8552 | 203/18723 | 1.49e-09 | 3.49e-08 | 135 |
| GO:00070419 | Esophagus | ESCC | lysosomal transport | 83/8552 | 114/18723 | 3.52e-09 | 7.41e-08 | 83 |
| Page: 1 2 3 |
| Pathway ID | Tissue | Disease Stage | Description | Gene Ratio | Bg Ratio | pvalue | p.adjust | qvalue | Count |
| Page: 1 |
Top |
Cell-cell communication analysis |
| Identification of potential cell-cell interactions between two cell types and their ligand-receptor pairs for different disease states |
| Ligand | Receptor | LRpair | Pathway | Tissue | Disease Stage |
| Page: 1 |
Top |
Single-cell gene regulatory network inference analysis |
| Find out the significant the regulons (TFs) and the target genes of each regulon across cell types for different disease states |
| TF | Cell Type | Tissue | Disease Stage | Target Gene | RSS | Regulon Activity |
| ∗The dot plots of a searched regulon are shown for all cell subpopulations in each disease state of each tissue based on the regulon specific score inferred using pySCENIC and by calculating the average expression. |
| Page: 1 |
Top |
Somatic mutation of malignant transformation related genes |
| Annotation of somatic variants for genes involved in malignant transformation |
| Hugo Symbol | Variant Class | Variant Classification | dbSNP RS | HGVSc | HGVSp | HGVSp Short | SWISSPROT | BIOTYPE | SIFT | PolyPhen | Tumor Sample Barcode | Tissue | Histology | Sex | Age | Stage | Therapy Types | Drugs | Outcome |
| TPCN2 | SNV | Missense_Mutation | c.1246G>A | p.Glu416Lys | p.E416K | Q8NHX9 | protein_coding | tolerated(0.08) | benign(0.037) | TCGA-A7-A426-01 | Breast | breast invasive carcinoma | Female | <65 | III/IV | Chemotherapy | adriamycin | SD | |
| TPCN2 | SNV | Missense_Mutation | c.1269G>C | p.Gln423His | p.Q423H | Q8NHX9 | protein_coding | deleterious(0.01) | possibly_damaging(0.646) | TCGA-AC-A23H-01 | Breast | breast invasive carcinoma | Female | >=65 | I/II | Unknown | Unknown | PD | |
| TPCN2 | SNV | Missense_Mutation | c.446N>C | p.Trp149Ser | p.W149S | Q8NHX9 | protein_coding | deleterious(0.03) | benign(0.438) | TCGA-E2-A15S-01 | Breast | breast invasive carcinoma | Female | <65 | I/II | Chemotherapy | doxorubicin | SD | |
| TPCN2 | insertion | Nonsense_Mutation | novel | c.324_325insTGAGACACCTCTGACA | p.Ala109Ter | p.A109* | Q8NHX9 | protein_coding | TCGA-A2-A04P-01 | Breast | breast invasive carcinoma | Female | <65 | III/IV | Chemotherapy | taxol | PD | ||
| TPCN2 | insertion | Nonsense_Mutation | novel | c.326_327insTCTCACATGTAGTTGTTAGTAATAGCACAAAGGAGGGGGT | p.Asp110LeufsTer6 | p.D110Lfs*6 | Q8NHX9 | protein_coding | TCGA-A2-A04P-01 | Breast | breast invasive carcinoma | Female | <65 | III/IV | Chemotherapy | taxol | PD | ||
| TPCN2 | deletion | Frame_Shift_Del | novel | c.2238delG | p.His747ThrfsTer50 | p.H747Tfs*50 | Q8NHX9 | protein_coding | TCGA-EW-A2FV-01 | Breast | breast invasive carcinoma | Female | <65 | III/IV | Chemotherapy | docetaxel | SD | ||
| TPCN2 | SNV | Missense_Mutation | c.701N>A | p.Gly234Glu | p.G234E | Q8NHX9 | protein_coding | deleterious(0) | probably_damaging(0.918) | TCGA-DR-A0ZM-01 | Cervix | cervical & endocervical cancer | Female | <65 | III/IV | Unspecific | Cisplatin | SD | |
| TPCN2 | SNV | Missense_Mutation | rs755078998 | c.2237C>T | p.Pro746Leu | p.P746L | Q8NHX9 | protein_coding | deleterious(0.02) | probably_damaging(0.963) | TCGA-JW-A5VI-01 | Cervix | cervical & endocervical cancer | Female | <65 | I/II | Chemotherapy | topotecan | PD |
| TPCN2 | SNV | Missense_Mutation | novel | c.2077N>G | p.Ile693Val | p.I693V | Q8NHX9 | protein_coding | tolerated(0.16) | benign(0.348) | TCGA-AA-3672-01 | Colorectum | colon adenocarcinoma | Female | >=65 | III/IV | Unknown | Unknown | SD |
| TPCN2 | SNV | Missense_Mutation | novel | c.163G>T | p.Asp55Tyr | p.D55Y | Q8NHX9 | protein_coding | deleterious(0) | possibly_damaging(0.865) | TCGA-AZ-4315-01 | Colorectum | colon adenocarcinoma | Male | <65 | I/II | Unknown | Unknown | SD |
| Page: 1 2 3 4 5 6 |
Top |
Related drugs of malignant transformation related genes |
| Identification of chemicals and drugs interact with genes involved in malignant transfromation |
| (DGIdb 4.0) |
| Entrez ID | Symbol | Category | Interaction Types | Drug Claim Name | Drug Name | PMIDs |
| 219931 | TPCN2 | ION CHANNEL, DRUGGABLE GENOME | blocker | 135651305 | VERAPAMIL | |
| 219931 | TPCN2 | ION CHANNEL, DRUGGABLE GENOME | activator | 178100233 |
| Page: 1 |

Copyright 2023-Present -The University of Texas Health Science Center at Houston |