
|
|||||
|
 | |
| |
| |
| |
| |
| |
|
Gene: TP73 |
Gene summary for TP73 |
| Gene information | Species | Human | Gene symbol | TP73 | Gene ID | 7161 |
| Gene name | tumor protein p73 | |
| Gene Alias | CILD47 | |
| Cytomap | 1p36.32 | |
| Gene Type | protein-coding | GO ID | GO:0000278 | UniProtAcc | O15350 |
Top |
Malignant transformation analysis |
| Identification of the aberrant gene expression in precancerous and cancerous lesions by comparing the gene expression of stem-like cells in diseased tissues with normal stem cells |
| Entrez ID | Symbol | Replicates | Species | Organ | Tissue | Adj P-value | Log2FC | Malignancy |
| 7161 | TP73 | LZE4T | Human | Esophagus | ESCC | 7.69e-05 | 1.98e-01 | 0.0811 |
| 7161 | TP73 | P2T-E | Human | Esophagus | ESCC | 5.54e-24 | 5.31e-01 | 0.1177 |
| 7161 | TP73 | P8T-E | Human | Esophagus | ESCC | 1.26e-05 | 1.51e-01 | 0.0889 |
| 7161 | TP73 | P10T-E | Human | Esophagus | ESCC | 2.98e-22 | 3.92e-01 | 0.116 |
| 7161 | TP73 | P11T-E | Human | Esophagus | ESCC | 1.16e-02 | 2.27e-01 | 0.1426 |
| 7161 | TP73 | P12T-E | Human | Esophagus | ESCC | 5.45e-18 | 4.62e-01 | 0.1122 |
| 7161 | TP73 | P15T-E | Human | Esophagus | ESCC | 1.01e-11 | 2.71e-01 | 0.1149 |
| 7161 | TP73 | P16T-E | Human | Esophagus | ESCC | 5.28e-14 | 2.14e-01 | 0.1153 |
| 7161 | TP73 | P21T-E | Human | Esophagus | ESCC | 4.43e-18 | 3.78e-01 | 0.1617 |
| 7161 | TP73 | P22T-E | Human | Esophagus | ESCC | 2.48e-03 | 9.52e-02 | 0.1236 |
| 7161 | TP73 | P26T-E | Human | Esophagus | ESCC | 1.08e-16 | 3.20e-01 | 0.1276 |
| 7161 | TP73 | P27T-E | Human | Esophagus | ESCC | 9.21e-19 | 4.58e-01 | 0.1055 |
| 7161 | TP73 | P28T-E | Human | Esophagus | ESCC | 9.11e-06 | 8.00e-02 | 0.1149 |
| 7161 | TP73 | P30T-E | Human | Esophagus | ESCC | 7.44e-13 | 4.59e-01 | 0.137 |
| 7161 | TP73 | P31T-E | Human | Esophagus | ESCC | 4.30e-20 | 3.41e-01 | 0.1251 |
| 7161 | TP73 | P32T-E | Human | Esophagus | ESCC | 1.03e-08 | 1.41e-01 | 0.1666 |
| 7161 | TP73 | P37T-E | Human | Esophagus | ESCC | 5.58e-12 | 2.69e-01 | 0.1371 |
| 7161 | TP73 | P40T-E | Human | Esophagus | ESCC | 8.86e-04 | 1.48e-01 | 0.109 |
| 7161 | TP73 | P42T-E | Human | Esophagus | ESCC | 9.74e-12 | 3.55e-01 | 0.1175 |
| 7161 | TP73 | P44T-E | Human | Esophagus | ESCC | 2.18e-06 | 1.49e-01 | 0.1096 |
| Page: 1 2 3 |
| Tissue | Expression Dynamics | Abbreviation |
| Esophagus |  | ESCC: Esophageal squamous cell carcinoma |
| HGIN: High-grade intraepithelial neoplasias | ||
| LGIN: Low-grade intraepithelial neoplasias | ||
| Oral Cavity | 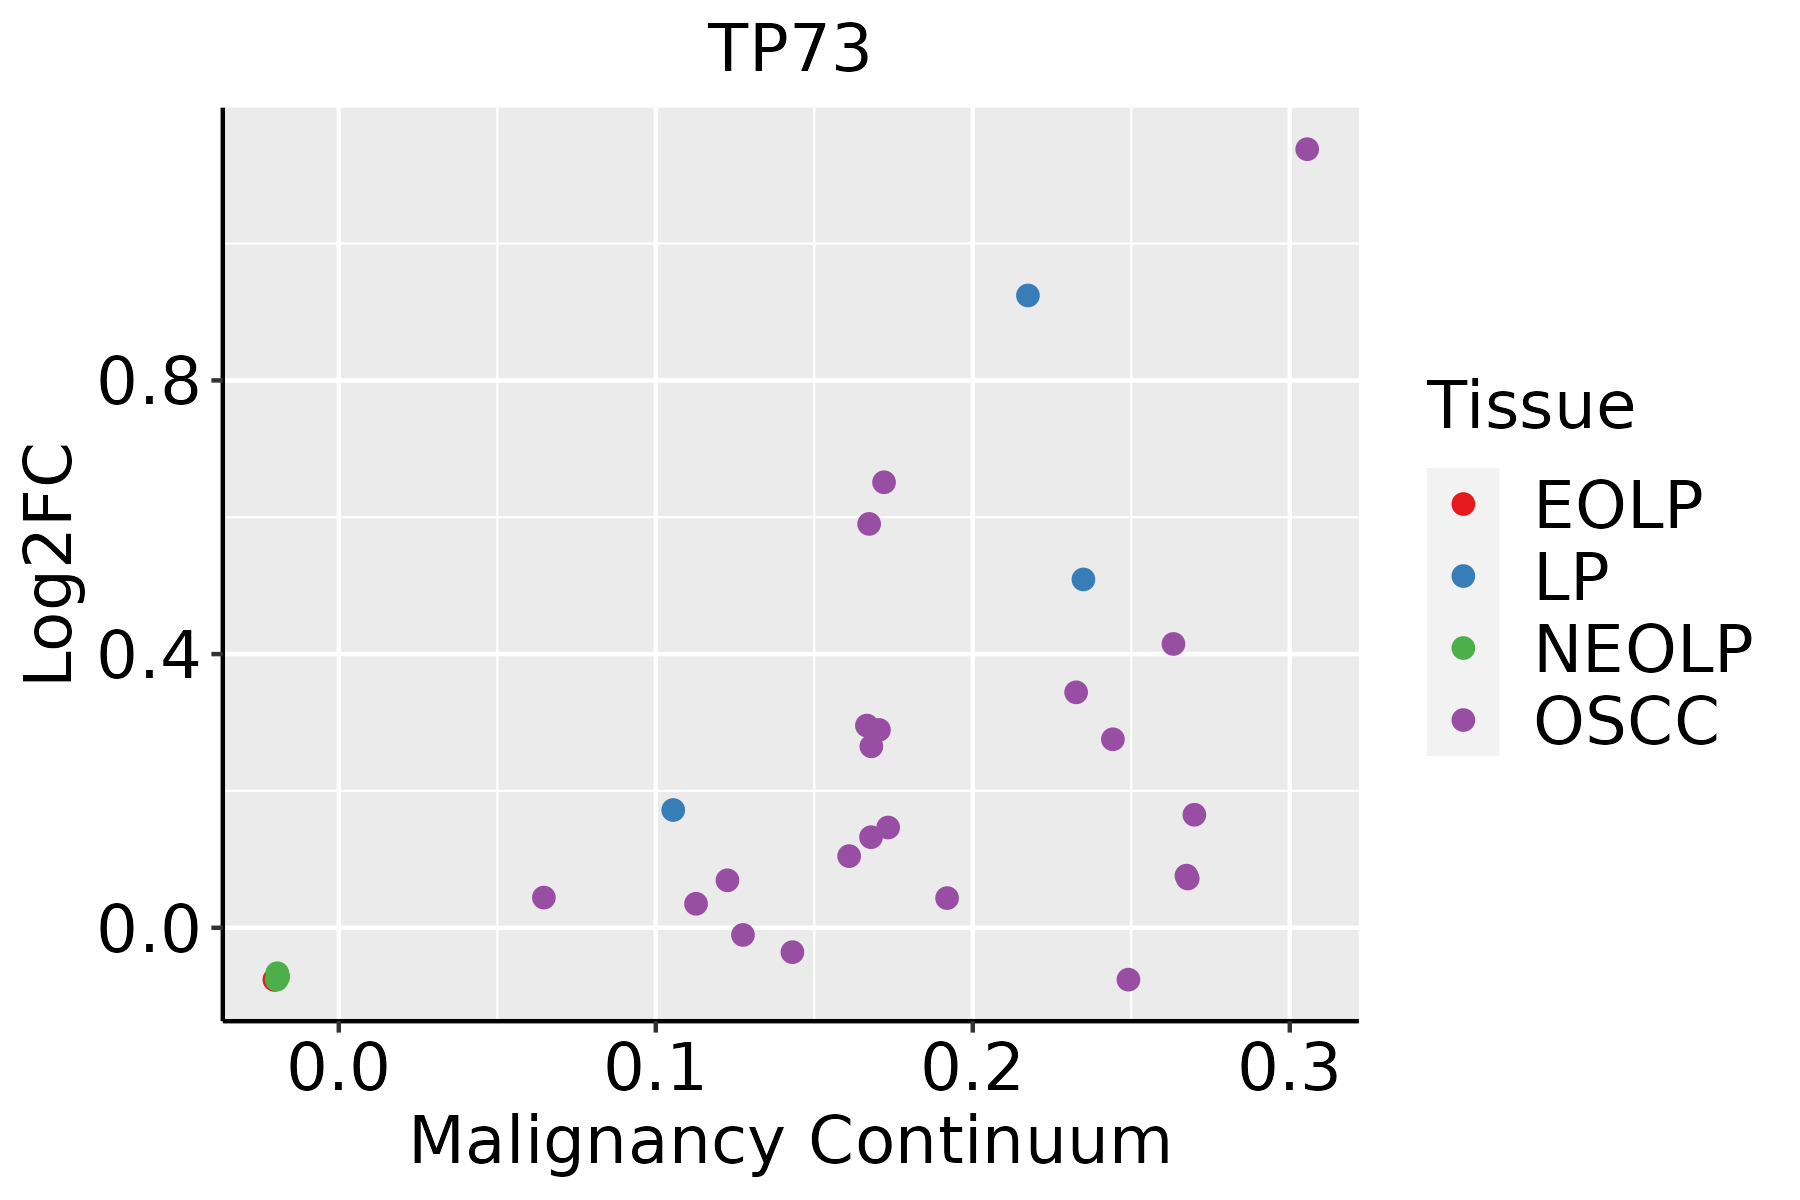 | EOLP: Erosive Oral lichen planus |
| LP: leukoplakia | ||
| NEOLP: Non-erosive oral lichen planus | ||
| OSCC: Oral squamous cell carcinoma | ||
| Skin | 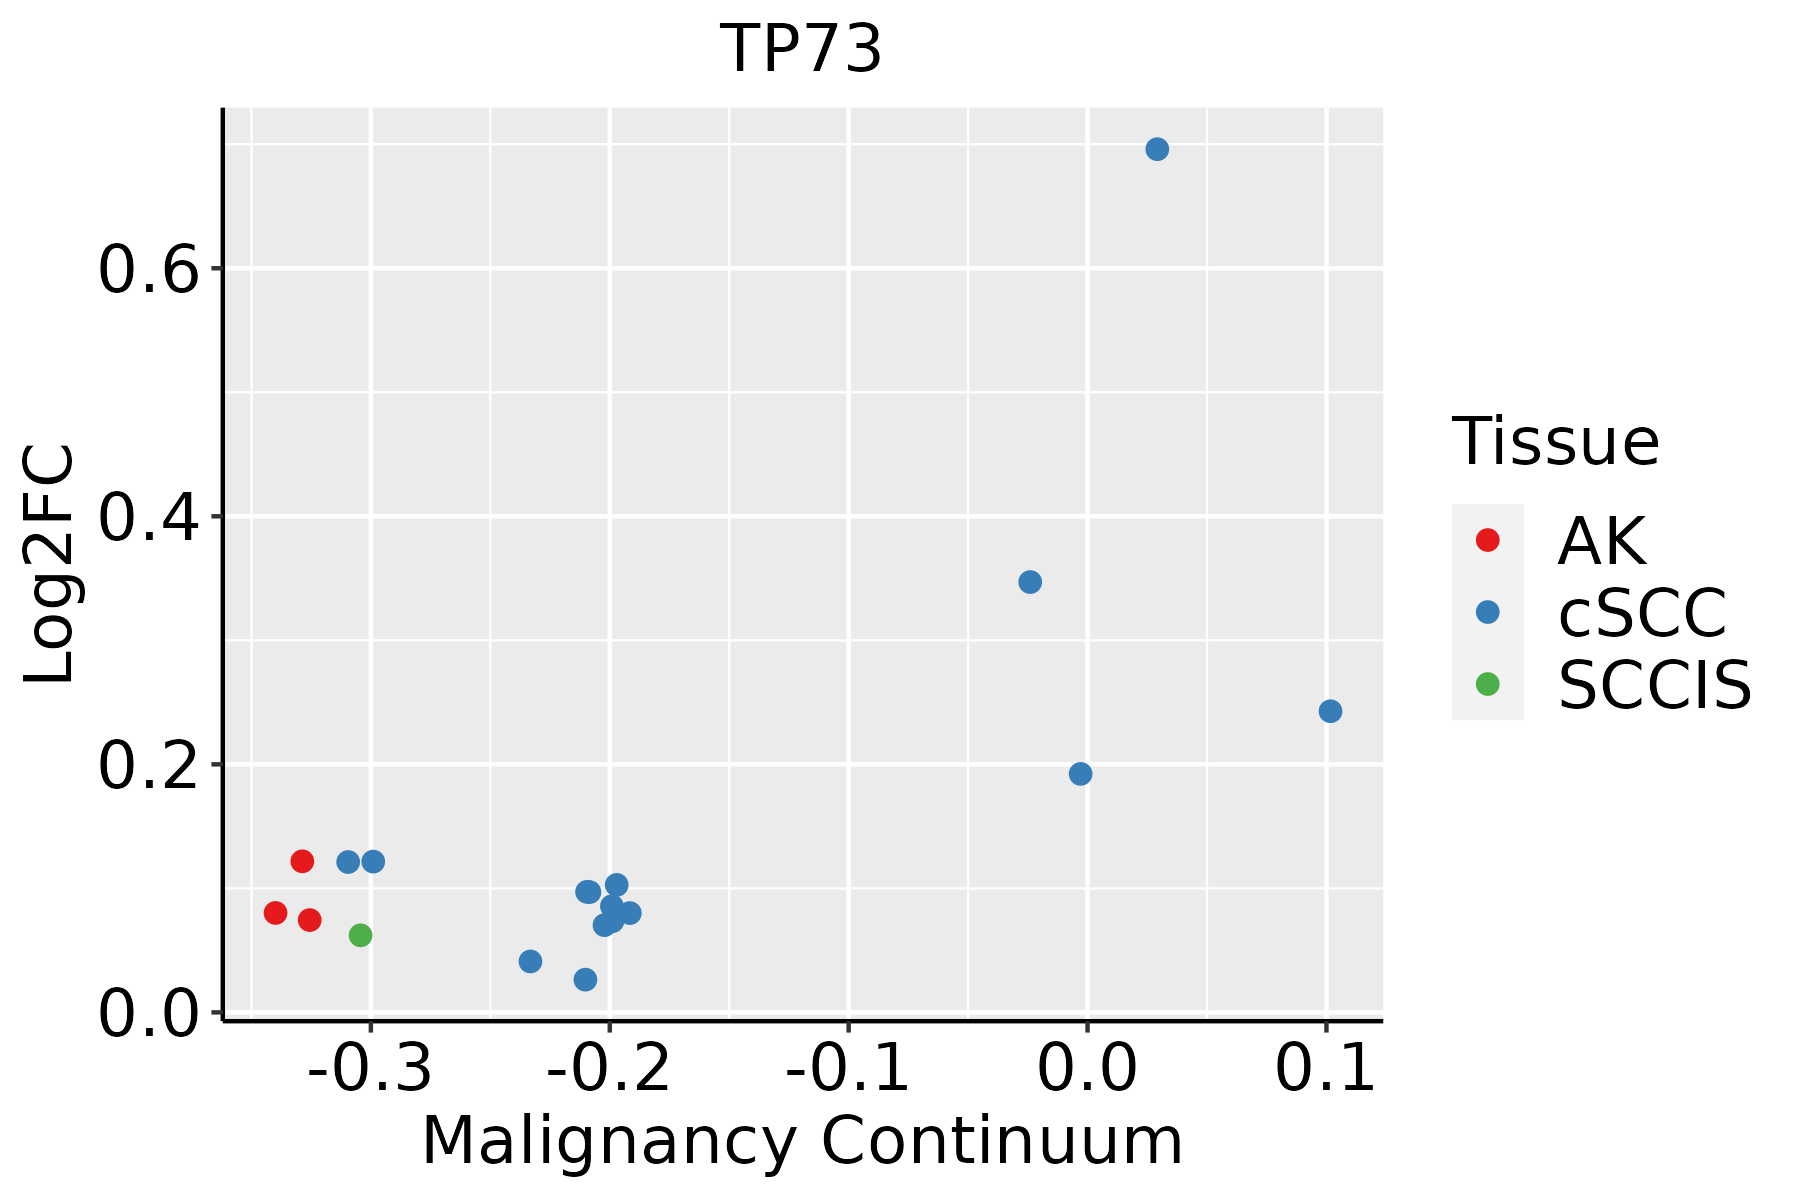 | AK: Actinic keratosis |
| cSCC: Cutaneous squamous cell carcinoma | ||
| SCCIS:squamous cell carcinoma in situ |
| ∗log2FC in expression of this searched gene in stem-like cells from each diseased tissue sample relative to stem-like cells in normal samples in each tissue plotted against the malignancy continuum. Samples are colored based on if they are from different disease stage. |
Top |
Malignant transformation related pathway analysis |
| Find out the enriched GO biological processes and KEGG pathways involved in transition from healthy to precancer to cancer |
| Tissue | Disease Stage | Enriched GO biological Processes |
| Colorectum | AD |  |
| Colorectum | SER |  |
| Colorectum | MSS |  |
| Colorectum | MSI-H |  |
| Colorectum | FAP |  |
| ∗Top 15 enriched GO BP terms are showed in the bar plot of each disease state in each tissue. Each row represents a significant GO biological process which is colored according to the -log10(p.adjust). |
| Page: 1 2 3 4 5 6 7 8 9 |
| GO ID | Tissue | Disease Stage | Description | Gene Ratio | Bg Ratio | pvalue | p.adjust | Count |
| GO:0097193111 | Esophagus | ESCC | intrinsic apoptotic signaling pathway | 222/8552 | 288/18723 | 5.87e-28 | 2.02e-25 | 222 |
| GO:000734615 | Esophagus | ESCC | regulation of mitotic cell cycle | 293/8552 | 457/18723 | 8.00e-16 | 5.64e-14 | 293 |
| GO:0072331111 | Esophagus | ESCC | signal transduction by p53 class mediator | 121/8552 | 163/18723 | 9.61e-14 | 4.69e-12 | 121 |
| GO:0008630110 | Esophagus | ESCC | intrinsic apoptotic signaling pathway in response to DNA damage | 78/8552 | 99/18723 | 1.43e-11 | 5.08e-10 | 78 |
| GO:0042771110 | Esophagus | ESCC | intrinsic apoptotic signaling pathway in response to DNA damage by p53 class mediator | 38/8552 | 43/18723 | 5.75e-09 | 1.18e-07 | 38 |
| GO:0072332111 | Esophagus | ESCC | intrinsic apoptotic signaling pathway by p53 class mediator | 59/8552 | 76/18723 | 1.22e-08 | 2.42e-07 | 59 |
| GO:00459267 | Esophagus | ESCC | negative regulation of growth | 148/8552 | 249/18723 | 7.88e-06 | 7.73e-05 | 148 |
| GO:001072010 | Esophagus | ESCC | positive regulation of cell development | 172/8552 | 298/18723 | 1.74e-05 | 1.55e-04 | 172 |
| GO:00420636 | Esophagus | ESCC | gliogenesis | 172/8552 | 301/18723 | 3.75e-05 | 3.04e-04 | 172 |
| GO:000941020 | Esophagus | ESCC | response to xenobiotic stimulus | 253/8552 | 462/18723 | 4.55e-05 | 3.58e-04 | 253 |
| GO:005076710 | Esophagus | ESCC | regulation of neurogenesis | 203/8552 | 364/18723 | 6.10e-05 | 4.68e-04 | 203 |
| GO:00507697 | Esophagus | ESCC | positive regulation of neurogenesis | 131/8552 | 225/18723 | 9.71e-05 | 6.90e-04 | 131 |
| GO:00100016 | Esophagus | ESCC | glial cell differentiation | 129/8552 | 225/18723 | 2.73e-04 | 1.65e-03 | 129 |
| GO:00519606 | Esophagus | ESCC | regulation of nervous system development | 237/8552 | 443/18723 | 5.02e-04 | 2.78e-03 | 237 |
| GO:00519625 | Esophagus | ESCC | positive regulation of nervous system development | 149/8552 | 272/18723 | 1.50e-03 | 7.06e-03 | 149 |
| GO:00512623 | Esophagus | ESCC | protein tetramerization | 54/8552 | 87/18723 | 1.50e-03 | 7.06e-03 | 54 |
| GO:00512592 | Esophagus | ESCC | protein complex oligomerization | 130/8552 | 238/18723 | 3.29e-03 | 1.36e-02 | 130 |
| GO:006053716 | Esophagus | ESCC | muscle tissue development | 211/8552 | 403/18723 | 3.84e-03 | 1.56e-02 | 211 |
| GO:00330025 | Esophagus | ESCC | muscle cell proliferation | 134/8552 | 248/18723 | 4.80e-03 | 1.86e-02 | 134 |
| GO:00140151 | Esophagus | ESCC | positive regulation of gliogenesis | 41/8552 | 66/18723 | 5.22e-03 | 1.97e-02 | 41 |
| Page: 1 2 3 4 5 |
| Pathway ID | Tissue | Disease Stage | Description | Gene Ratio | Bg Ratio | pvalue | p.adjust | qvalue | Count |
| hsa0411524 | Esophagus | ESCC | p53 signaling pathway | 65/4205 | 74/8465 | 3.88e-12 | 6.50e-11 | 3.33e-11 | 65 |
| hsa0472225 | Esophagus | ESCC | Neurotrophin signaling pathway | 80/4205 | 119/8465 | 7.33e-05 | 3.07e-04 | 1.57e-04 | 80 |
| hsa051629 | Esophagus | ESCC | Measles | 90/4205 | 139/8465 | 2.16e-04 | 7.87e-04 | 4.03e-04 | 90 |
| hsa0439018 | Esophagus | ESCC | Hippo signaling pathway | 92/4205 | 157/8465 | 1.46e-02 | 3.31e-02 | 1.69e-02 | 92 |
| hsa0411534 | Esophagus | ESCC | p53 signaling pathway | 65/4205 | 74/8465 | 3.88e-12 | 6.50e-11 | 3.33e-11 | 65 |
| hsa04722111 | Esophagus | ESCC | Neurotrophin signaling pathway | 80/4205 | 119/8465 | 7.33e-05 | 3.07e-04 | 1.57e-04 | 80 |
| hsa0516213 | Esophagus | ESCC | Measles | 90/4205 | 139/8465 | 2.16e-04 | 7.87e-04 | 4.03e-04 | 90 |
| hsa0439019 | Esophagus | ESCC | Hippo signaling pathway | 92/4205 | 157/8465 | 1.46e-02 | 3.31e-02 | 1.69e-02 | 92 |
| hsa041159 | Oral cavity | OSCC | p53 signaling pathway | 57/3704 | 74/8465 | 4.99e-09 | 5.07e-08 | 2.58e-08 | 57 |
| hsa051628 | Oral cavity | OSCC | Measles | 90/3704 | 139/8465 | 4.10e-07 | 2.50e-06 | 1.27e-06 | 90 |
| hsa0472220 | Oral cavity | OSCC | Neurotrophin signaling pathway | 74/3704 | 119/8465 | 3.55e-05 | 1.49e-04 | 7.58e-05 | 74 |
| hsa0439016 | Oral cavity | OSCC | Hippo signaling pathway | 86/3704 | 157/8465 | 3.30e-03 | 8.24e-03 | 4.20e-03 | 86 |
| hsa0411514 | Oral cavity | OSCC | p53 signaling pathway | 57/3704 | 74/8465 | 4.99e-09 | 5.07e-08 | 2.58e-08 | 57 |
| hsa0516212 | Oral cavity | OSCC | Measles | 90/3704 | 139/8465 | 4.10e-07 | 2.50e-06 | 1.27e-06 | 90 |
| hsa04722110 | Oral cavity | OSCC | Neurotrophin signaling pathway | 74/3704 | 119/8465 | 3.55e-05 | 1.49e-04 | 7.58e-05 | 74 |
| hsa0439017 | Oral cavity | OSCC | Hippo signaling pathway | 86/3704 | 157/8465 | 3.30e-03 | 8.24e-03 | 4.20e-03 | 86 |
| hsa0411523 | Oral cavity | LP | p53 signaling pathway | 38/2418 | 74/8465 | 2.82e-05 | 1.92e-04 | 1.24e-04 | 38 |
| hsa0516221 | Oral cavity | LP | Measles | 59/2418 | 139/8465 | 2.90e-04 | 1.60e-03 | 1.03e-03 | 59 |
| hsa0472224 | Oral cavity | LP | Neurotrophin signaling pathway | 46/2418 | 119/8465 | 1.07e-02 | 3.77e-02 | 2.43e-02 | 46 |
| hsa0411533 | Oral cavity | LP | p53 signaling pathway | 38/2418 | 74/8465 | 2.82e-05 | 1.92e-04 | 1.24e-04 | 38 |
| Page: 1 2 |
Top |
Cell-cell communication analysis |
| Identification of potential cell-cell interactions between two cell types and their ligand-receptor pairs for different disease states |
| Ligand | Receptor | LRpair | Pathway | Tissue | Disease Stage |
| Page: 1 |
Top |
Single-cell gene regulatory network inference analysis |
| Find out the significant the regulons (TFs) and the target genes of each regulon across cell types for different disease states |
| TF | Cell Type | Tissue | Disease Stage | Target Gene | RSS | Regulon Activity |
| TP73 | CD8TEREX | Cervix | N_HPV | NUPR1,POLA1,TMEM184A, etc. | 4.13e-02 |  |
| TP73 | MSC.ADIPO | Cervix | CC | ACOT7,BDH1,MELTF, etc. | 2.56e-01 |  |
| TP73 | CILIA | Endometrium | Healthy | FOXJ1,EFHC1,CCDC40, etc. | 1.15e-01 |  |
| TP73 | MDSCs | Esophagus | ADJ | ABCA6,FSD1,CRACR2A, etc. | 4.87e-02 |  |
| TP73 | MDSCs | Esophagus | ESCC | ABCA6,FSD1,CRACR2A, etc. | 1.25e-01 |  |
| TP73 | STM | Skin | cSCC | KRT15,POSTN,MOXD1, etc. | 4.34e-01 |  |
| ∗The dot plots of a searched regulon are shown for all cell subpopulations in each disease state of each tissue based on the regulon specific score inferred using pySCENIC and by calculating the average expression. |
| Page: 1 |
Top |
Somatic mutation of malignant transformation related genes |
| Annotation of somatic variants for genes involved in malignant transformation |
| Hugo Symbol | Variant Class | Variant Classification | dbSNP RS | HGVSc | HGVSp | HGVSp Short | SWISSPROT | BIOTYPE | SIFT | PolyPhen | Tumor Sample Barcode | Tissue | Histology | Sex | Age | Stage | Therapy Types | Drugs | Outcome |
| TP73 | SNV | Missense_Mutation | novel | c.131N>T | p.Gly44Val | p.G44V | O15350 | protein_coding | deleterious(0.03) | benign(0.036) | TCGA-5L-AAT1-01 | Breast | breast invasive carcinoma | Female | <65 | III/IV | Hormone Therapy | letrozol | SD |
| TP73 | SNV | Missense_Mutation | c.311C>T | p.Ser104Phe | p.S104F | O15350 | protein_coding | deleterious(0) | probably_damaging(1) | TCGA-A8-A095-01 | Breast | breast invasive carcinoma | Female | <65 | I/II | Chemotherapy | 5-fluorouracil | CR | |
| TP73 | SNV | Missense_Mutation | rs753917723 | c.668N>T | p.Ser223Leu | p.S223L | O15350 | protein_coding | deleterious(0.01) | benign(0.333) | TCGA-C5-A2LS-01 | Cervix | cervical & endocervical cancer | Female | <65 | I/II | Unknown | Unknown | SD |
| TP73 | SNV | Missense_Mutation | c.444G>C | p.Leu148Phe | p.L148F | O15350 | protein_coding | deleterious(0) | probably_damaging(0.967) | TCGA-DS-A1OC-01 | Cervix | cervical & endocervical cancer | Female | <65 | I/II | Chemotherapy | gemcitabine | SD | |
| TP73 | SNV | Missense_Mutation | rs774822513 | c.565N>A | p.Asp189Asn | p.D189N | O15350 | protein_coding | deleterious(0) | benign(0.163) | TCGA-IR-A3LA-01 | Cervix | cervical & endocervical cancer | Female | <65 | I/II | Chemotherapy | cisplatin | CR |
| TP73 | SNV | Missense_Mutation | c.571N>A | p.Val191Met | p.V191M | O15350 | protein_coding | deleterious(0) | probably_damaging(0.948) | TCGA-LP-A7HU-01 | Cervix | cervical & endocervical cancer | Female | <65 | I/II | Unknown | Unknown | SD | |
| TP73 | SNV | Missense_Mutation | novel | c.1145C>T | p.Pro382Leu | p.P382L | O15350 | protein_coding | deleterious(0) | probably_damaging(0.924) | TCGA-VS-A8QA-01 | Cervix | cervical & endocervical cancer | Female | <65 | I/II | Unknown | Unknown | SD |
| TP73 | SNV | Missense_Mutation | novel | c.877N>T | p.Arg293Cys | p.R293C | O15350 | protein_coding | deleterious(0) | probably_damaging(0.999) | TCGA-VS-A9UZ-01 | Cervix | cervical & endocervical cancer | Female | <65 | I/II | Unknown | Unknown | SD |
| TP73 | insertion | Frame_Shift_Ins | novel | c.674_677dupATGT | p.Asp227CysfsTer3 | p.D227Cfs*3 | O15350 | protein_coding | TCGA-Q1-A73R-01 | Cervix | cervical & endocervical cancer | Female | <65 | I/II | Unknown | Unknown | SD | ||
| TP73 | SNV | Missense_Mutation | rs754162945 | c.1588N>A | p.Ala530Thr | p.A530T | O15350 | protein_coding | tolerated(0.12) | benign(0.34) | TCGA-5M-AAT6-01 | Colorectum | colon adenocarcinoma | Female | <65 | III/IV | Unknown | Unknown | PD |
| Page: 1 2 3 4 5 6 7 |
Top |
Related drugs of malignant transformation related genes |
| Identification of chemicals and drugs interact with genes involved in malignant transfromation |
| (DGIdb 4.0) |
| Entrez ID | Symbol | Category | Interaction Types | Drug Claim Name | Drug Name | PMIDs |
| 7161 | TP73 | DRUGGABLE GENOME, TUMOR SUPPRESSOR, TRANSCRIPTION FACTOR | UVB | 14514652 | ||
| 7161 | TP73 | DRUGGABLE GENOME, TUMOR SUPPRESSOR, TRANSCRIPTION FACTOR | GM-CSF | REGRAMOSTIM | 15126418 | |
| 7161 | TP73 | DRUGGABLE GENOME, TUMOR SUPPRESSOR, TRANSCRIPTION FACTOR | ANTIOXIDANT | 12023887 | ||
| 7161 | TP73 | DRUGGABLE GENOME, TUMOR SUPPRESSOR, TRANSCRIPTION FACTOR | TAZAROTENE | TAZAROTENE | 15610529 | |
| 7161 | TP73 | DRUGGABLE GENOME, TUMOR SUPPRESSOR, TRANSCRIPTION FACTOR | CARBOPLATIN | CARBOPLATIN | 12499281 | |
| 7161 | TP73 | DRUGGABLE GENOME, TUMOR SUPPRESSOR, TRANSCRIPTION FACTOR | RETINOIC ACID | 10809758 | ||
| 7161 | TP73 | DRUGGABLE GENOME, TUMOR SUPPRESSOR, TRANSCRIPTION FACTOR | VEGF | 11704858 | ||
| 7161 | TP73 | DRUGGABLE GENOME, TUMOR SUPPRESSOR, TRANSCRIPTION FACTOR | NERVE GROWTH FACTOR | 10894779 | ||
| 7161 | TP73 | DRUGGABLE GENOME, TUMOR SUPPRESSOR, TRANSCRIPTION FACTOR | EGCG | EPIGALOCATECHIN GALLATE | 17369354 | |
| 7161 | TP73 | DRUGGABLE GENOME, TUMOR SUPPRESSOR, TRANSCRIPTION FACTOR | VCR | 12007564 |
| Page: 1 2 |

Copyright 2023-Present -The University of Texas Health Science Center at Houston |