
|
|||||
|
 | |
| |
| |
| |
| |
| |
|
Gene: TP63 |
Gene summary for TP63 |
| Gene information | Species | Human | Gene symbol | TP63 | Gene ID | 8626 |
| Gene name | tumor protein p63 | |
| Gene Alias | AIS | |
| Cytomap | 3q28 | |
| Gene Type | protein-coding | GO ID | GO:0000003 | UniProtAcc | Q9H3D4 |
Top |
Malignant transformation analysis |
| Identification of the aberrant gene expression in precancerous and cancerous lesions by comparing the gene expression of stem-like cells in diseased tissues with normal stem cells |
| Entrez ID | Symbol | Replicates | Species | Organ | Tissue | Adj P-value | Log2FC | Malignancy |
| 8626 | TP63 | CA_HPV_1 | Human | Cervix | CC | 4.13e-06 | -2.15e-01 | 0.0264 |
| 8626 | TP63 | CA_HPV_3 | Human | Cervix | CC | 1.67e-23 | 5.38e-01 | 0.0414 |
| 8626 | TP63 | CCI_1 | Human | Cervix | CC | 1.49e-22 | 1.70e+00 | 0.528 |
| 8626 | TP63 | CCI_2 | Human | Cervix | CC | 5.59e-18 | 2.39e+00 | 0.5249 |
| 8626 | TP63 | CCI_3 | Human | Cervix | CC | 1.08e-27 | 2.04e+00 | 0.516 |
| 8626 | TP63 | CCII_1 | Human | Cervix | CC | 6.87e-03 | 3.72e-01 | 0.3249 |
| 8626 | TP63 | Tumor | Human | Cervix | CC | 3.86e-19 | 5.35e-01 | 0.1241 |
| 8626 | TP63 | sample3 | Human | Cervix | CC | 2.21e-35 | 5.74e-01 | 0.1387 |
| 8626 | TP63 | H2 | Human | Cervix | HSIL_HPV | 5.04e-03 | -2.05e-01 | 0.0632 |
| 8626 | TP63 | T3 | Human | Cervix | CC | 4.66e-34 | 5.81e-01 | 0.1389 |
| 8626 | TP63 | LZE2T | Human | Esophagus | ESCC | 9.21e-14 | 2.16e+00 | 0.082 |
| 8626 | TP63 | LZE4T | Human | Esophagus | ESCC | 1.89e-40 | 2.50e+00 | 0.0811 |
| 8626 | TP63 | LZE7T | Human | Esophagus | ESCC | 8.99e-10 | 1.75e+00 | 0.0667 |
| 8626 | TP63 | LZE8T | Human | Esophagus | ESCC | 2.97e-04 | 4.53e-01 | 0.067 |
| 8626 | TP63 | LZE24D1 | Human | Esophagus | HGIN | 1.95e-18 | 6.68e-01 | 0.054 |
| 8626 | TP63 | LZE24T | Human | Esophagus | ESCC | 9.55e-08 | 1.06e+00 | 0.0596 |
| 8626 | TP63 | LZE21T | Human | Esophagus | ESCC | 2.16e-02 | 9.49e-01 | 0.0655 |
| 8626 | TP63 | P2T-E | Human | Esophagus | ESCC | 2.16e-31 | 9.61e-01 | 0.1177 |
| 8626 | TP63 | P4T-E | Human | Esophagus | ESCC | 2.66e-28 | 1.14e+00 | 0.1323 |
| 8626 | TP63 | P5T-E | Human | Esophagus | ESCC | 1.33e-38 | 1.18e+00 | 0.1327 |
| Page: 1 2 3 4 5 6 7 |
| Tissue | Expression Dynamics | Abbreviation |
| Cervix |  | CC: Cervix cancer |
| HSIL_HPV: HPV-infected high-grade squamous intraepithelial lesions | ||
| N_HPV: HPV-infected normal cervix | ||
| Esophagus |  | ESCC: Esophageal squamous cell carcinoma |
| HGIN: High-grade intraepithelial neoplasias | ||
| LGIN: Low-grade intraepithelial neoplasias | ||
| Lung | 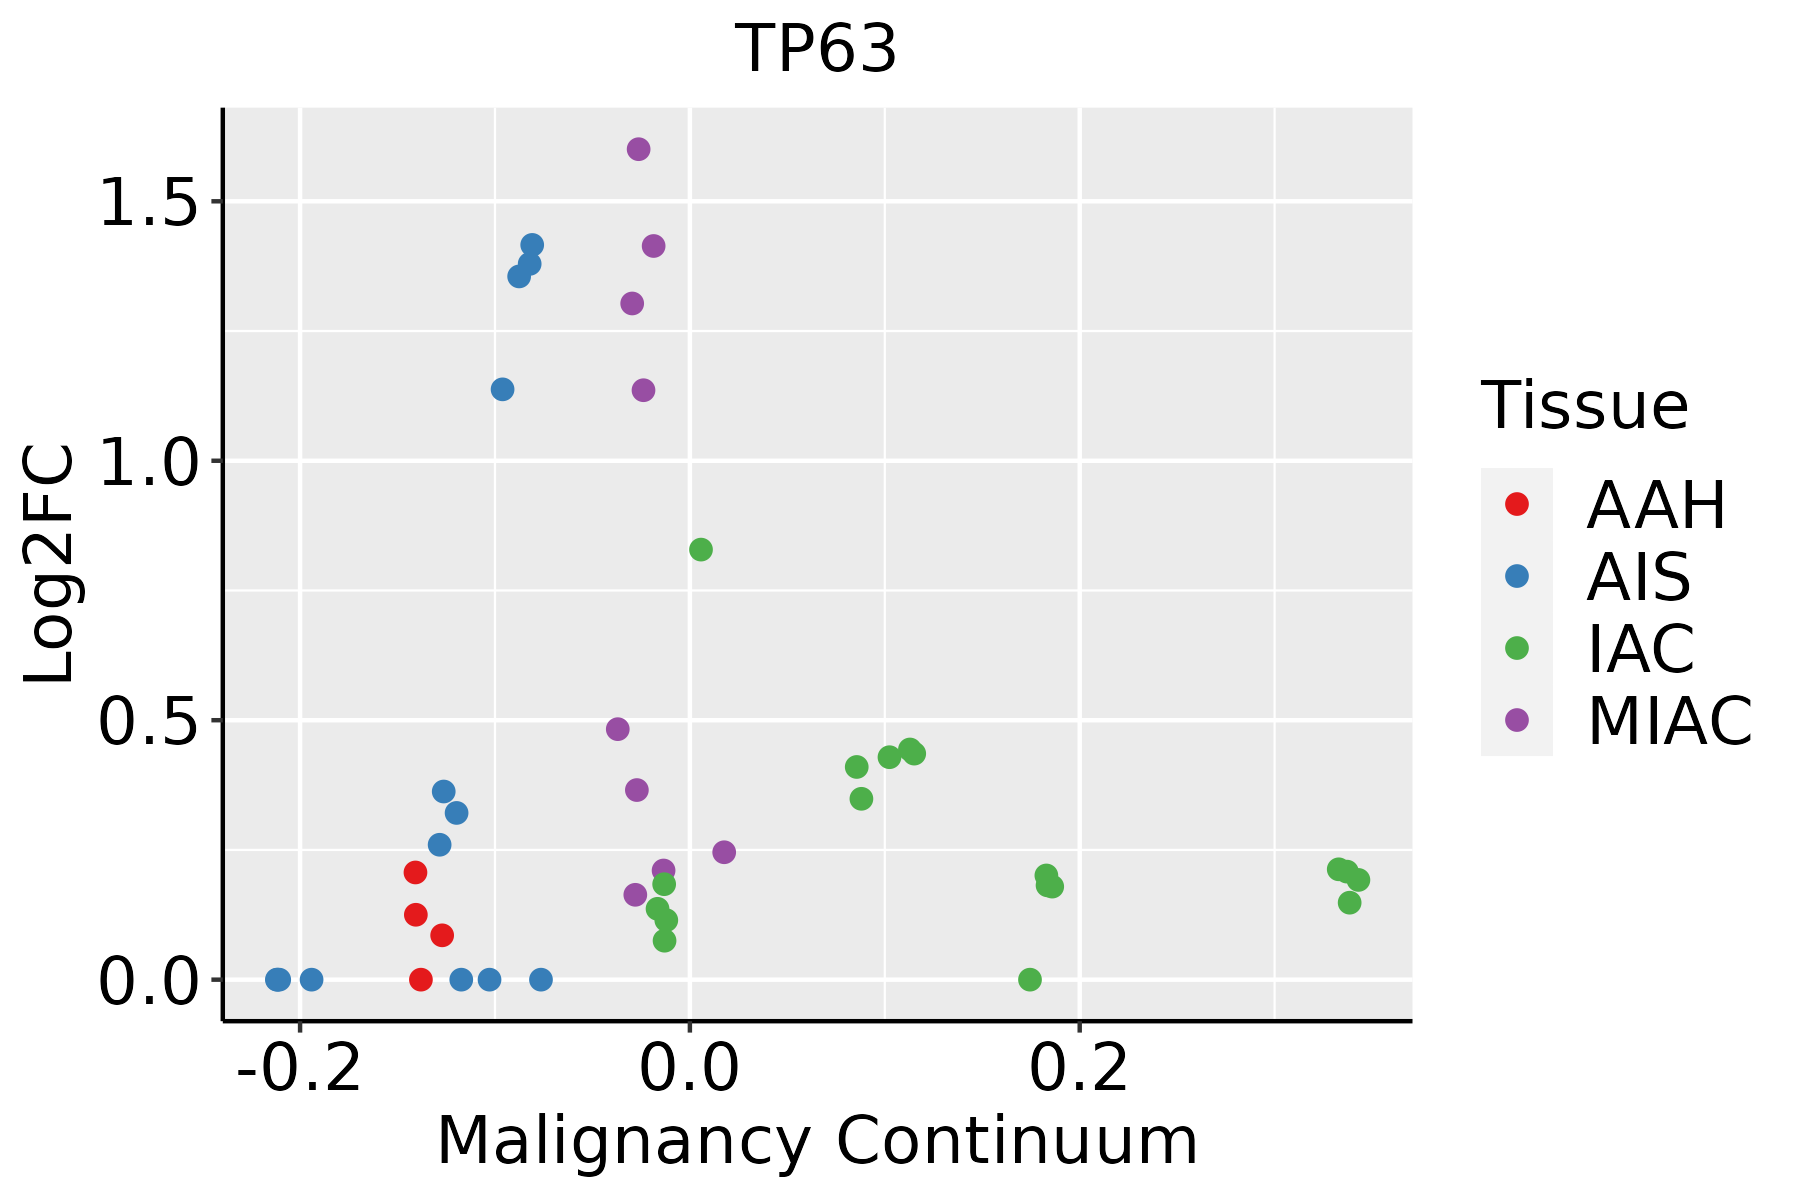 | AAH: Atypical adenomatous hyperplasia |
| AIS: Adenocarcinoma in situ | ||
| IAC: Invasive lung adenocarcinoma | ||
| MIA: Minimally invasive adenocarcinoma | ||
| Oral Cavity | 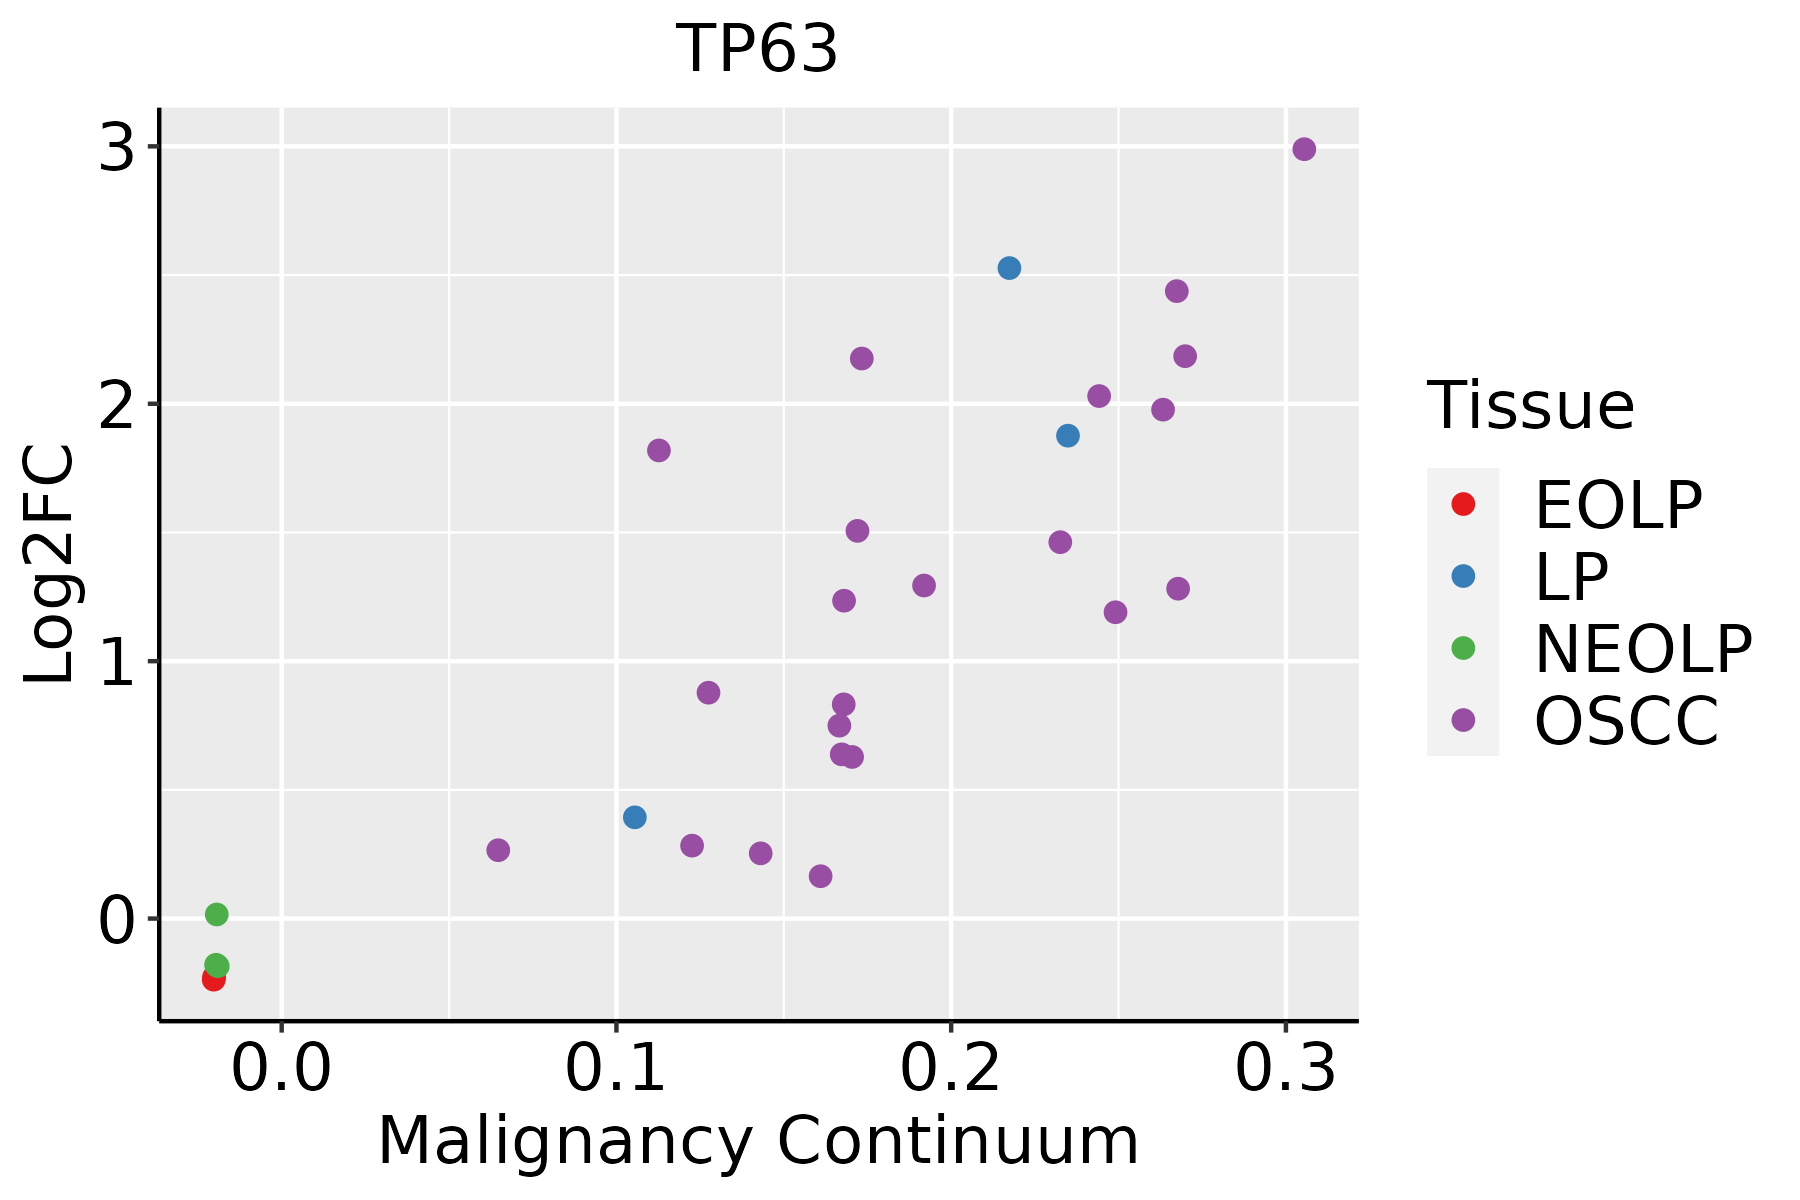 | EOLP: Erosive Oral lichen planus |
| LP: leukoplakia | ||
| NEOLP: Non-erosive oral lichen planus | ||
| OSCC: Oral squamous cell carcinoma | ||
| Prostate | 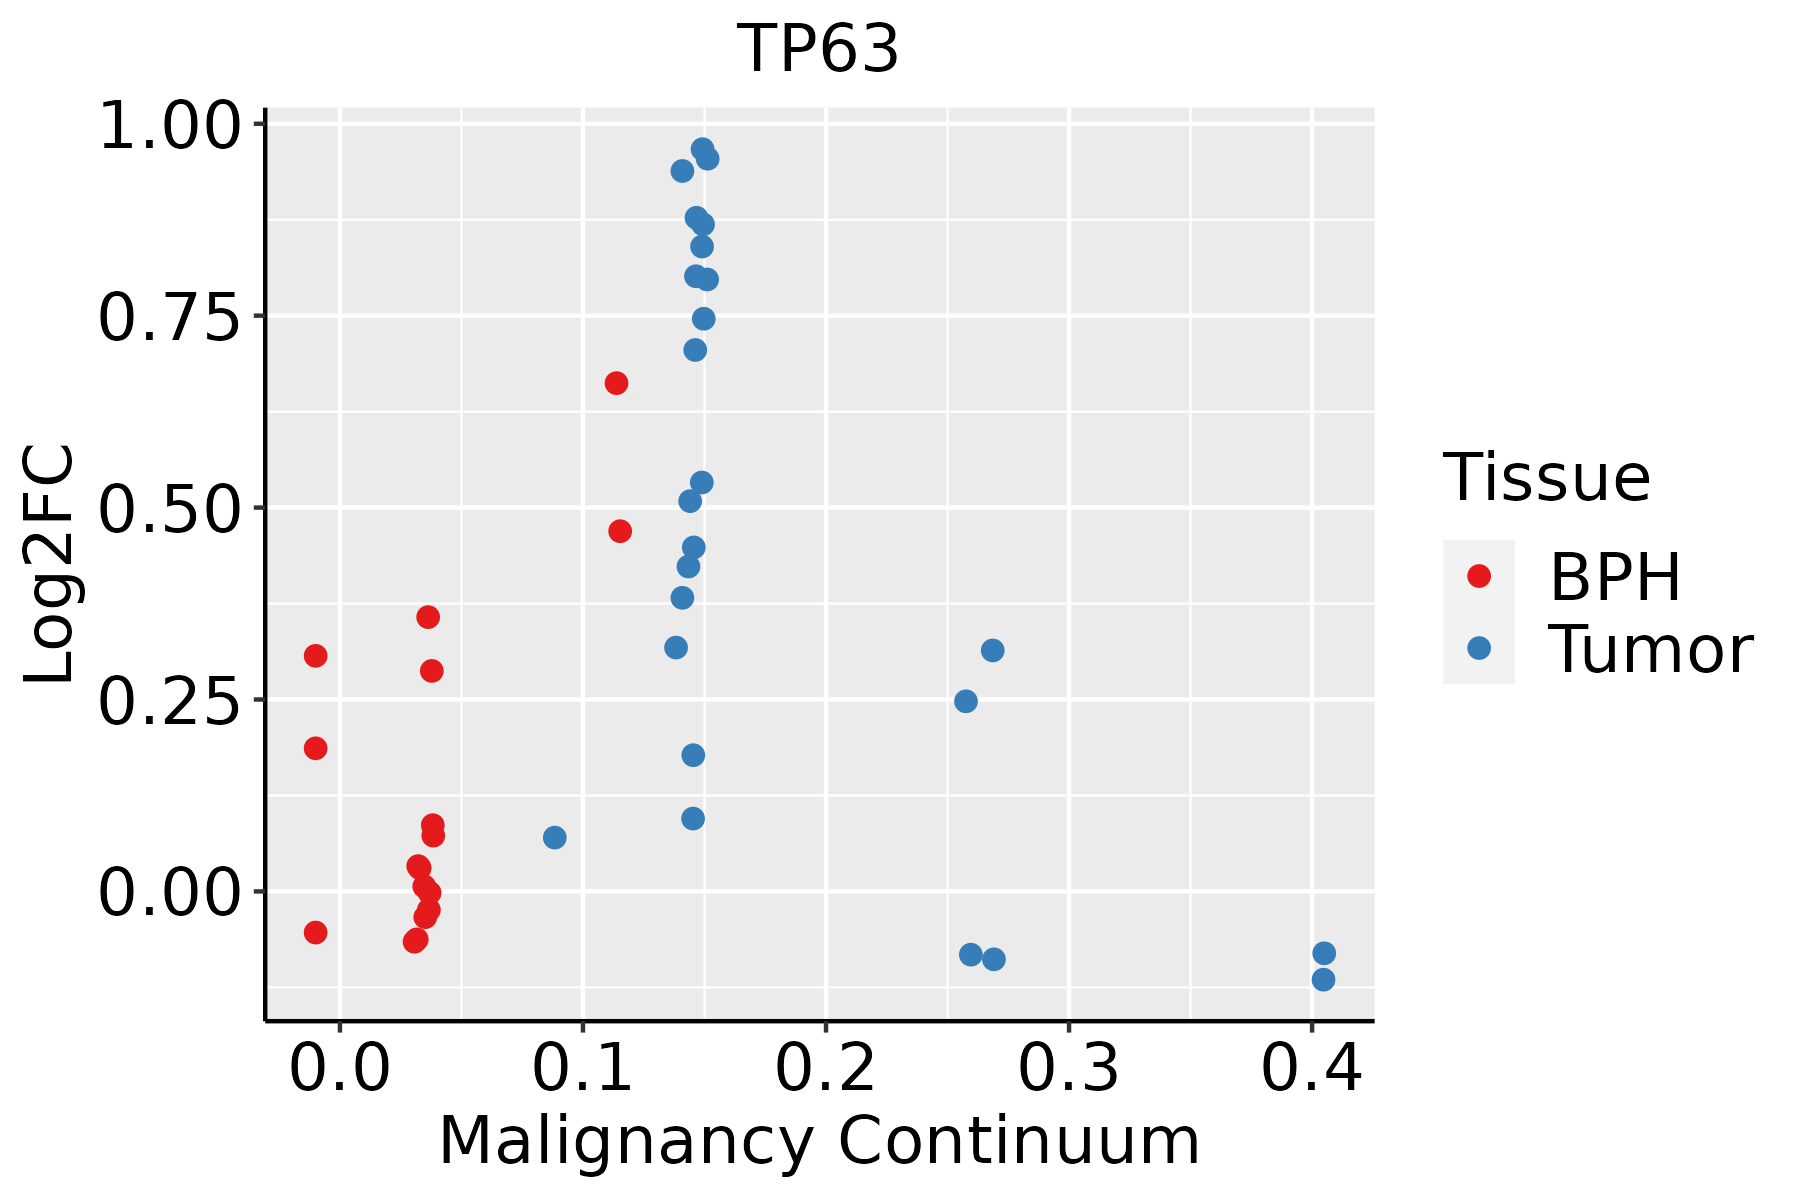 | BPH: Benign Prostatic Hyperplasia |
| Skin | 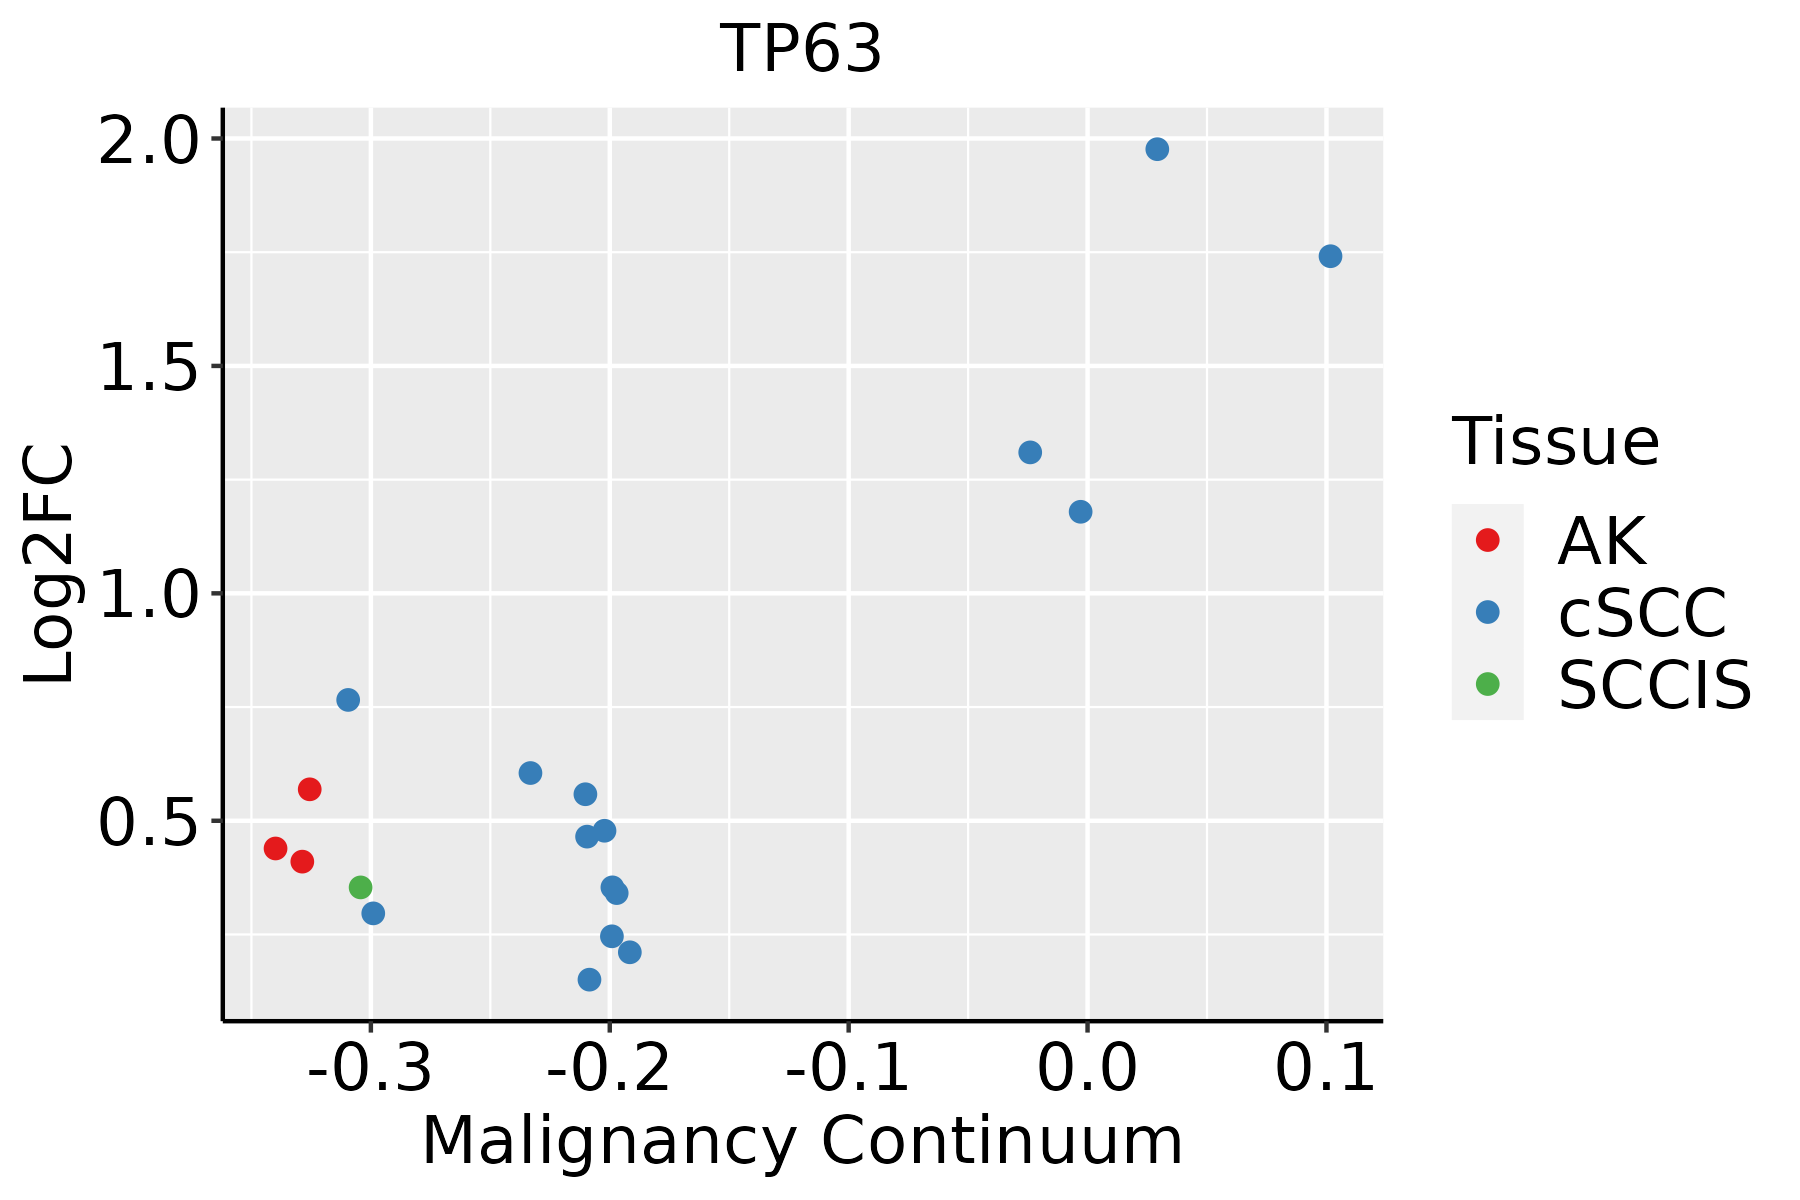 | AK: Actinic keratosis |
| cSCC: Cutaneous squamous cell carcinoma | ||
| SCCIS:squamous cell carcinoma in situ |
| ∗log2FC in expression of this searched gene in stem-like cells from each diseased tissue sample relative to stem-like cells in normal samples in each tissue plotted against the malignancy continuum. Samples are colored based on if they are from different disease stage. |
Top |
Malignant transformation related pathway analysis |
| Find out the enriched GO biological processes and KEGG pathways involved in transition from healthy to precancer to cancer |
| Tissue | Disease Stage | Enriched GO biological Processes |
| Colorectum | AD |  |
| Colorectum | SER |  |
| Colorectum | MSS |  |
| Colorectum | MSI-H |  |
| Colorectum | FAP |  |
| ∗Top 15 enriched GO BP terms are showed in the bar plot of each disease state in each tissue. Each row represents a significant GO biological process which is colored according to the -log10(p.adjust). |
| Page: 1 2 3 4 5 6 7 8 9 |
| GO ID | Tissue | Disease Stage | Description | Gene Ratio | Bg Ratio | pvalue | p.adjust | Count |
| GO:009719310 | Cervix | CC | intrinsic apoptotic signaling pathway | 85/2311 | 288/18723 | 4.56e-15 | 6.46e-12 | 85 |
| GO:200123310 | Cervix | CC | regulation of apoptotic signaling pathway | 96/2311 | 356/18723 | 4.08e-14 | 3.05e-11 | 96 |
| GO:005254710 | Cervix | CC | regulation of peptidase activity | 112/2311 | 461/18723 | 6.70e-13 | 3.08e-10 | 112 |
| GO:005254810 | Cervix | CC | regulation of endopeptidase activity | 103/2311 | 432/18723 | 1.89e-11 | 5.14e-09 | 103 |
| GO:00085446 | Cervix | CC | epidermis development | 83/2311 | 324/18723 | 3.91e-11 | 8.54e-09 | 83 |
| GO:00435884 | Cervix | CC | skin development | 71/2311 | 263/18723 | 8.04e-11 | 1.46e-08 | 71 |
| GO:00506737 | Cervix | CC | epithelial cell proliferation | 98/2311 | 437/18723 | 2.01e-09 | 2.15e-07 | 98 |
| GO:200011610 | Cervix | CC | regulation of cysteine-type endopeptidase activity | 61/2311 | 235/18723 | 8.69e-09 | 7.22e-07 | 61 |
| GO:00302164 | Cervix | CC | keratinocyte differentiation | 42/2311 | 139/18723 | 1.74e-08 | 1.28e-06 | 42 |
| GO:004328110 | Cervix | CC | regulation of cysteine-type endopeptidase activity involved in apoptotic process | 55/2311 | 209/18723 | 2.77e-08 | 1.95e-06 | 55 |
| GO:00099137 | Cervix | CC | epidermal cell differentiation | 53/2311 | 202/18723 | 5.48e-08 | 3.25e-06 | 53 |
| GO:00506787 | Cervix | CC | regulation of epithelial cell proliferation | 83/2311 | 381/18723 | 1.31e-07 | 6.42e-06 | 83 |
| GO:20012357 | Cervix | CC | positive regulation of apoptotic signaling pathway | 37/2311 | 126/18723 | 2.70e-07 | 1.12e-05 | 37 |
| GO:00075689 | Cervix | CC | aging | 75/2311 | 339/18723 | 2.75e-07 | 1.13e-05 | 75 |
| GO:004854510 | Cervix | CC | response to steroid hormone | 74/2311 | 339/18723 | 5.71e-07 | 2.09e-05 | 74 |
| GO:00614588 | Cervix | CC | reproductive system development | 87/2311 | 427/18723 | 1.37e-06 | 4.55e-05 | 87 |
| GO:00305229 | Cervix | CC | intracellular receptor signaling pathway | 60/2311 | 265/18723 | 1.89e-06 | 5.97e-05 | 60 |
| GO:00486088 | Cervix | CC | reproductive structure development | 86/2311 | 424/18723 | 1.90e-06 | 5.97e-05 | 86 |
| GO:005087810 | Cervix | CC | regulation of body fluid levels | 78/2311 | 379/18723 | 3.20e-06 | 8.77e-05 | 78 |
| GO:00456822 | Cervix | CC | regulation of epidermis development | 22/2311 | 65/18723 | 5.56e-06 | 1.38e-04 | 22 |
| Page: 1 2 3 4 5 6 7 8 9 10 11 12 13 14 15 16 17 18 19 20 21 22 23 24 25 26 27 28 29 30 31 32 33 34 35 36 |
| Pathway ID | Tissue | Disease Stage | Description | Gene Ratio | Bg Ratio | pvalue | p.adjust | qvalue | Count |
| Page: 1 |
Top |
Cell-cell communication analysis |
| Identification of potential cell-cell interactions between two cell types and their ligand-receptor pairs for different disease states |
| Ligand | Receptor | LRpair | Pathway | Tissue | Disease Stage |
| Page: 1 |
Top |
Single-cell gene regulatory network inference analysis |
| Find out the significant the regulons (TFs) and the target genes of each regulon across cell types for different disease states |
| TF | Cell Type | Tissue | Disease Stage | Target Gene | RSS | Regulon Activity |
| TP63 | MYOEPI | Breast | ADJ | LTBP2,APOE,A2M, etc. | 6.16e-01 |  |
| TP63 | MYOEPI | Breast | Healthy | SAMD5,IRX4,NGFR, etc. | 4.50e-01 |  |
| TP63 | MYOEPI | Breast | Precancer | LTBP2,APOE,A2M, etc. | 6.02e-01 |  |
| TP63 | CFIB | Colorectum | FAP | COL4A3,GPR158,EFNA5, etc. | 2.84e-01 |  |
| TP63 | LYMEND | Colorectum | FAP | COL4A3,GPR158,EFNA5, etc. | 6.99e-02 | |
| TP63 | QUIE | Esophagus | Healthy | KRT15,CXCL14,KRT14, etc. | 9.00e-02 |  |
| TP63 | STM | Oral cavity | Healthy | COL17A1,CXCL14,DST, etc. | 4.32e-01 |  |
| TP63 | STM | Prostate | Healthy | ANKRD37,KRT15,DLK2, etc. | 4.68e-01 |  |
| ∗The dot plots of a searched regulon are shown for all cell subpopulations in each disease state of each tissue based on the regulon specific score inferred using pySCENIC and by calculating the average expression. |
| Page: 1 |
Top |
Somatic mutation of malignant transformation related genes |
| Annotation of somatic variants for genes involved in malignant transformation |
| Hugo Symbol | Variant Class | Variant Classification | dbSNP RS | HGVSc | HGVSp | HGVSp Short | SWISSPROT | BIOTYPE | SIFT | PolyPhen | Tumor Sample Barcode | Tissue | Histology | Sex | Age | Stage | Therapy Types | Drugs | Outcome |
| TP63 | SNV | Missense_Mutation | rs866938979 | c.566N>T | p.Ser189Leu | p.S189L | Q9H3D4 | protein_coding | deleterious(0) | probably_damaging(1) | TCGA-AN-A046-01 | Breast | breast invasive carcinoma | Female | >=65 | I/II | Unknown | Unknown | SD |
| TP63 | SNV | Missense_Mutation | c.1889N>G | p.Ser630Cys | p.S630C | Q9H3D4 | protein_coding | deleterious(0.01) | probably_damaging(0.91) | TCGA-D8-A1J8-01 | Breast | breast invasive carcinoma | Female | >=65 | I/II | Hormone Therapy | nolvadex | SD | |
| TP63 | SNV | Missense_Mutation | novel | c.194C>A | p.Pro65His | p.P65H | Q9H3D4 | protein_coding | deleterious(0.04) | probably_damaging(0.99) | TCGA-2W-A8YY-01 | Cervix | cervical & endocervical cancer | Female | <65 | I/II | Chemotherapy | cisplatin | CR |
| TP63 | SNV | Missense_Mutation | c.1046N>C | p.Gly349Ala | p.G349A | Q9H3D4 | protein_coding | deleterious(0.04) | probably_damaging(0.985) | TCGA-C5-A1MH-01 | Cervix | cervical & endocervical cancer | Female | >=65 | III/IV | Chemotherapy | cisplatin | PD | |
| TP63 | SNV | Missense_Mutation | novel | c.578N>T | p.Thr193Met | p.T193M | Q9H3D4 | protein_coding | deleterious(0) | probably_damaging(0.999) | TCGA-C5-A7X5-01 | Cervix | cervical & endocervical cancer | Female | >=65 | I/II | Chemotherapy | carboplatin | PD |
| TP63 | SNV | Missense_Mutation | c.563N>T | p.Lys188Met | p.K188M | Q9H3D4 | protein_coding | deleterious(0) | probably_damaging(1) | TCGA-C5-A905-01 | Cervix | cervical & endocervical cancer | Female | <65 | I/II | Unknown | Unknown | SD | |
| TP63 | SNV | Missense_Mutation | c.563N>T | p.Lys188Met | p.K188M | Q9H3D4 | protein_coding | deleterious(0) | probably_damaging(1) | TCGA-DS-A1OA-01 | Cervix | cervical & endocervical cancer | Female | >=65 | I/II | Chemotherapy | carboplatin | PD | |
| TP63 | SNV | Missense_Mutation | c.1107N>C | p.Lys369Asn | p.K369N | Q9H3D4 | protein_coding | deleterious(0.01) | probably_damaging(1) | TCGA-JW-A5VL-01 | Cervix | cervical & endocervical cancer | Female | <65 | I/II | Unknown | Unknown | SD | |
| TP63 | SNV | Missense_Mutation | c.656N>T | p.Pro219Leu | p.P219L | Q9H3D4 | protein_coding | deleterious(0) | probably_damaging(1) | TCGA-R2-A69V-01 | Cervix | cervical & endocervical cancer | Female | <65 | I/II | Chemotherapy | cisplatin | SD | |
| TP63 | SNV | Missense_Mutation | novel | c.1694N>G | p.Phe565Cys | p.F565C | Q9H3D4 | protein_coding | deleterious(0) | probably_damaging(1) | TCGA-ZJ-AAXN-01 | Cervix | cervical & endocervical cancer | Female | <65 | I/II | Unknown | Unknown | SD |
| Page: 1 2 3 4 5 6 7 8 9 10 11 12 |
Top |
Related drugs of malignant transformation related genes |
| Identification of chemicals and drugs interact with genes involved in malignant transfromation |
| (DGIdb 4.0) |
| Entrez ID | Symbol | Category | Interaction Types | Drug Claim Name | Drug Name | PMIDs |
| Page: 1 |

Copyright 2023-Present -The University of Texas Health Science Center at Houston |