
|
|||||
|
 | |
| |
| |
| |
| |
| |
|
Gene: TP53RK |
Gene summary for TP53RK |
| Gene information | Species | Human | Gene symbol | TP53RK | Gene ID | 112858 |
| Gene name | TP53 regulating kinase | |
| Gene Alias | BUD32 | |
| Cytomap | 20q13.12 | |
| Gene Type | protein-coding | GO ID | GO:0006139 | UniProtAcc | Q96S44 |
Top |
Malignant transformation analysis |
| Identification of the aberrant gene expression in precancerous and cancerous lesions by comparing the gene expression of stem-like cells in diseased tissues with normal stem cells |
| Entrez ID | Symbol | Replicates | Species | Organ | Tissue | Adj P-value | Log2FC | Malignancy |
| 112858 | TP53RK | LZE4T | Human | Esophagus | ESCC | 5.76e-10 | 3.18e-01 | 0.0811 |
| 112858 | TP53RK | LZE20T | Human | Esophagus | ESCC | 8.07e-05 | 2.38e-01 | 0.0662 |
| 112858 | TP53RK | LZE22D1 | Human | Esophagus | HGIN | 8.12e-03 | -1.79e-02 | 0.0595 |
| 112858 | TP53RK | LZE24T | Human | Esophagus | ESCC | 9.56e-18 | 4.94e-01 | 0.0596 |
| 112858 | TP53RK | P1T-E | Human | Esophagus | ESCC | 5.66e-06 | 3.45e-01 | 0.0875 |
| 112858 | TP53RK | P2T-E | Human | Esophagus | ESCC | 1.47e-29 | 5.65e-01 | 0.1177 |
| 112858 | TP53RK | P4T-E | Human | Esophagus | ESCC | 5.46e-27 | 7.18e-01 | 0.1323 |
| 112858 | TP53RK | P5T-E | Human | Esophagus | ESCC | 3.77e-20 | 4.39e-01 | 0.1327 |
| 112858 | TP53RK | P8T-E | Human | Esophagus | ESCC | 4.59e-20 | 2.78e-01 | 0.0889 |
| 112858 | TP53RK | P9T-E | Human | Esophagus | ESCC | 3.14e-09 | 2.71e-01 | 0.1131 |
| 112858 | TP53RK | P10T-E | Human | Esophagus | ESCC | 1.69e-36 | 7.12e-01 | 0.116 |
| 112858 | TP53RK | P11T-E | Human | Esophagus | ESCC | 1.63e-16 | 8.70e-01 | 0.1426 |
| 112858 | TP53RK | P12T-E | Human | Esophagus | ESCC | 4.93e-27 | 6.34e-01 | 0.1122 |
| 112858 | TP53RK | P15T-E | Human | Esophagus | ESCC | 4.14e-25 | 5.87e-01 | 0.1149 |
| 112858 | TP53RK | P16T-E | Human | Esophagus | ESCC | 4.75e-37 | 7.86e-01 | 0.1153 |
| 112858 | TP53RK | P17T-E | Human | Esophagus | ESCC | 5.19e-07 | 4.53e-01 | 0.1278 |
| 112858 | TP53RK | P19T-E | Human | Esophagus | ESCC | 1.35e-05 | 7.39e-01 | 0.1662 |
| 112858 | TP53RK | P20T-E | Human | Esophagus | ESCC | 1.61e-17 | 5.12e-01 | 0.1124 |
| 112858 | TP53RK | P21T-E | Human | Esophagus | ESCC | 8.55e-39 | 8.85e-01 | 0.1617 |
| 112858 | TP53RK | P22T-E | Human | Esophagus | ESCC | 2.52e-21 | 3.81e-01 | 0.1236 |
| Page: 1 2 3 4 5 6 |
| Tissue | Expression Dynamics | Abbreviation |
| Esophagus | 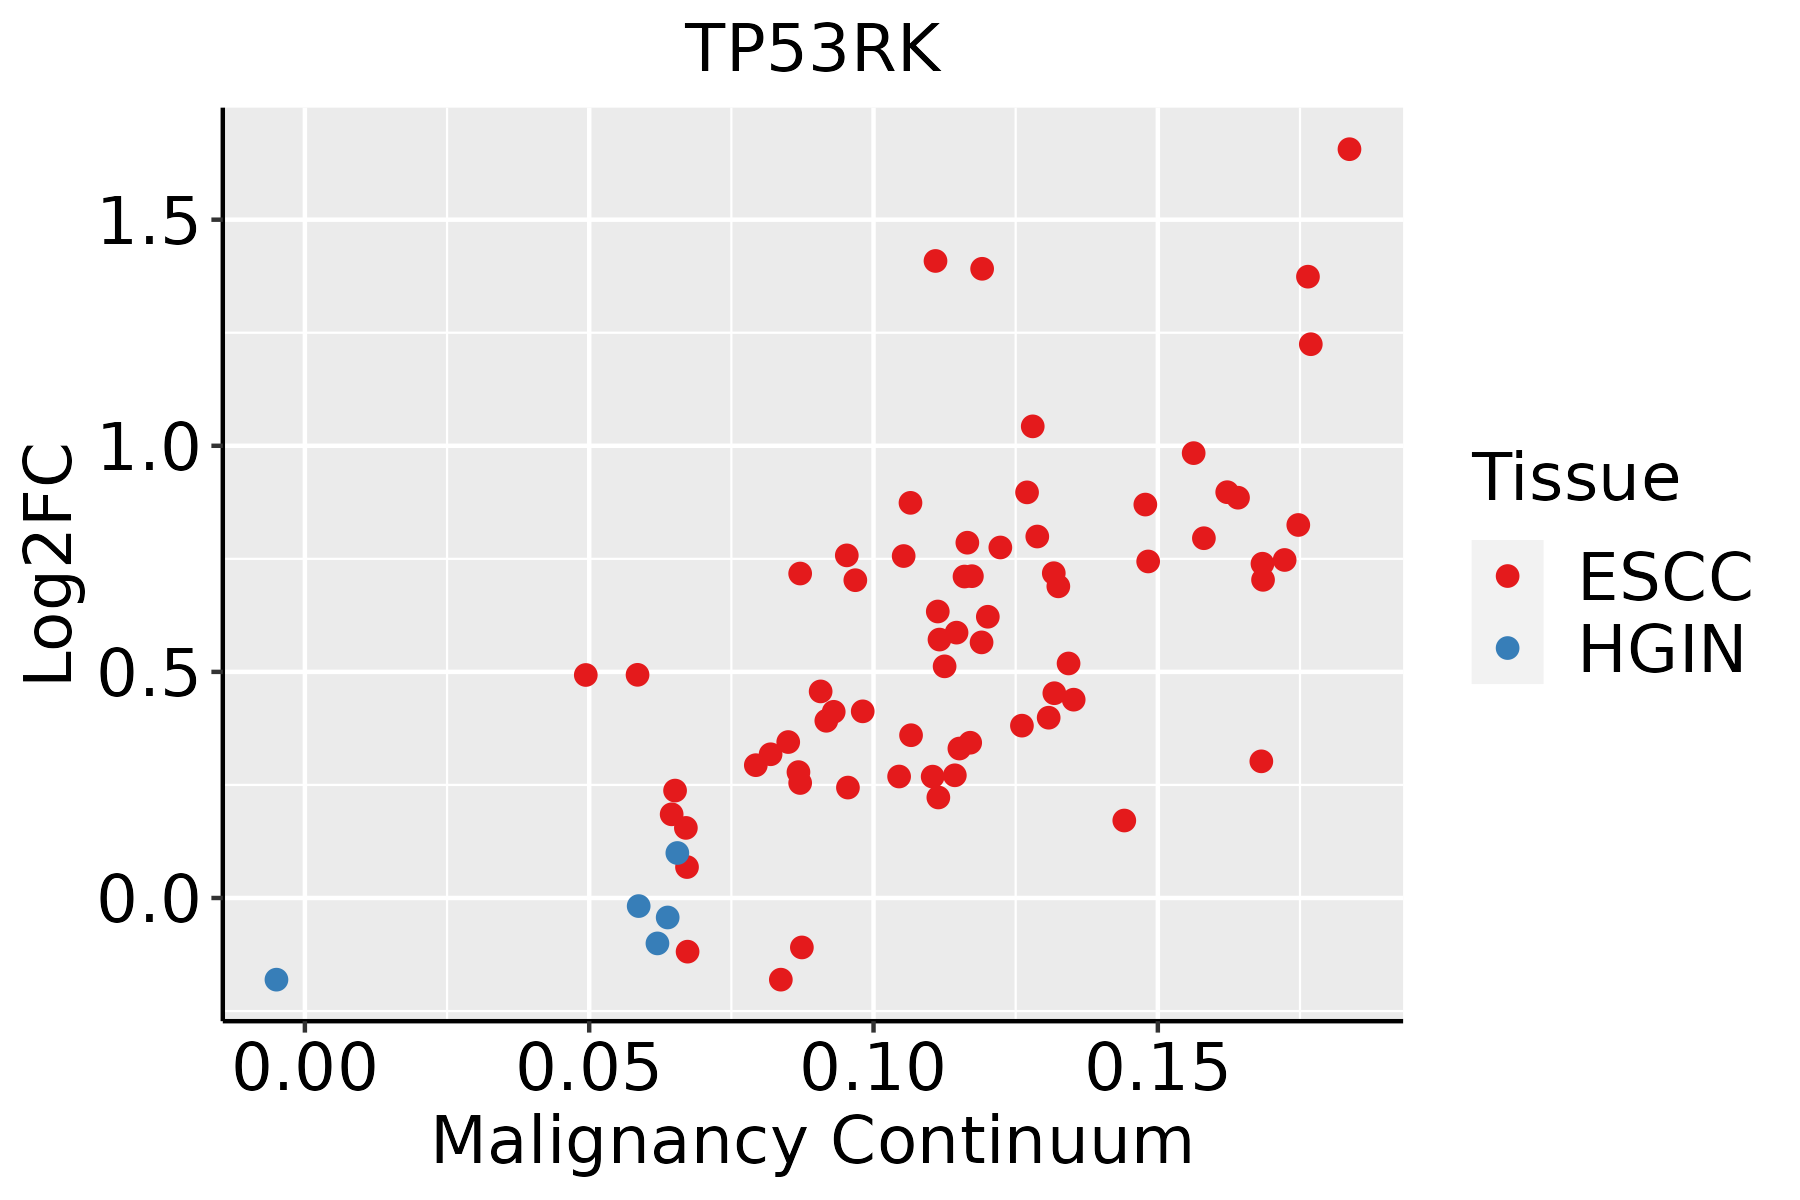 | ESCC: Esophageal squamous cell carcinoma |
| HGIN: High-grade intraepithelial neoplasias | ||
| LGIN: Low-grade intraepithelial neoplasias | ||
| Liver | 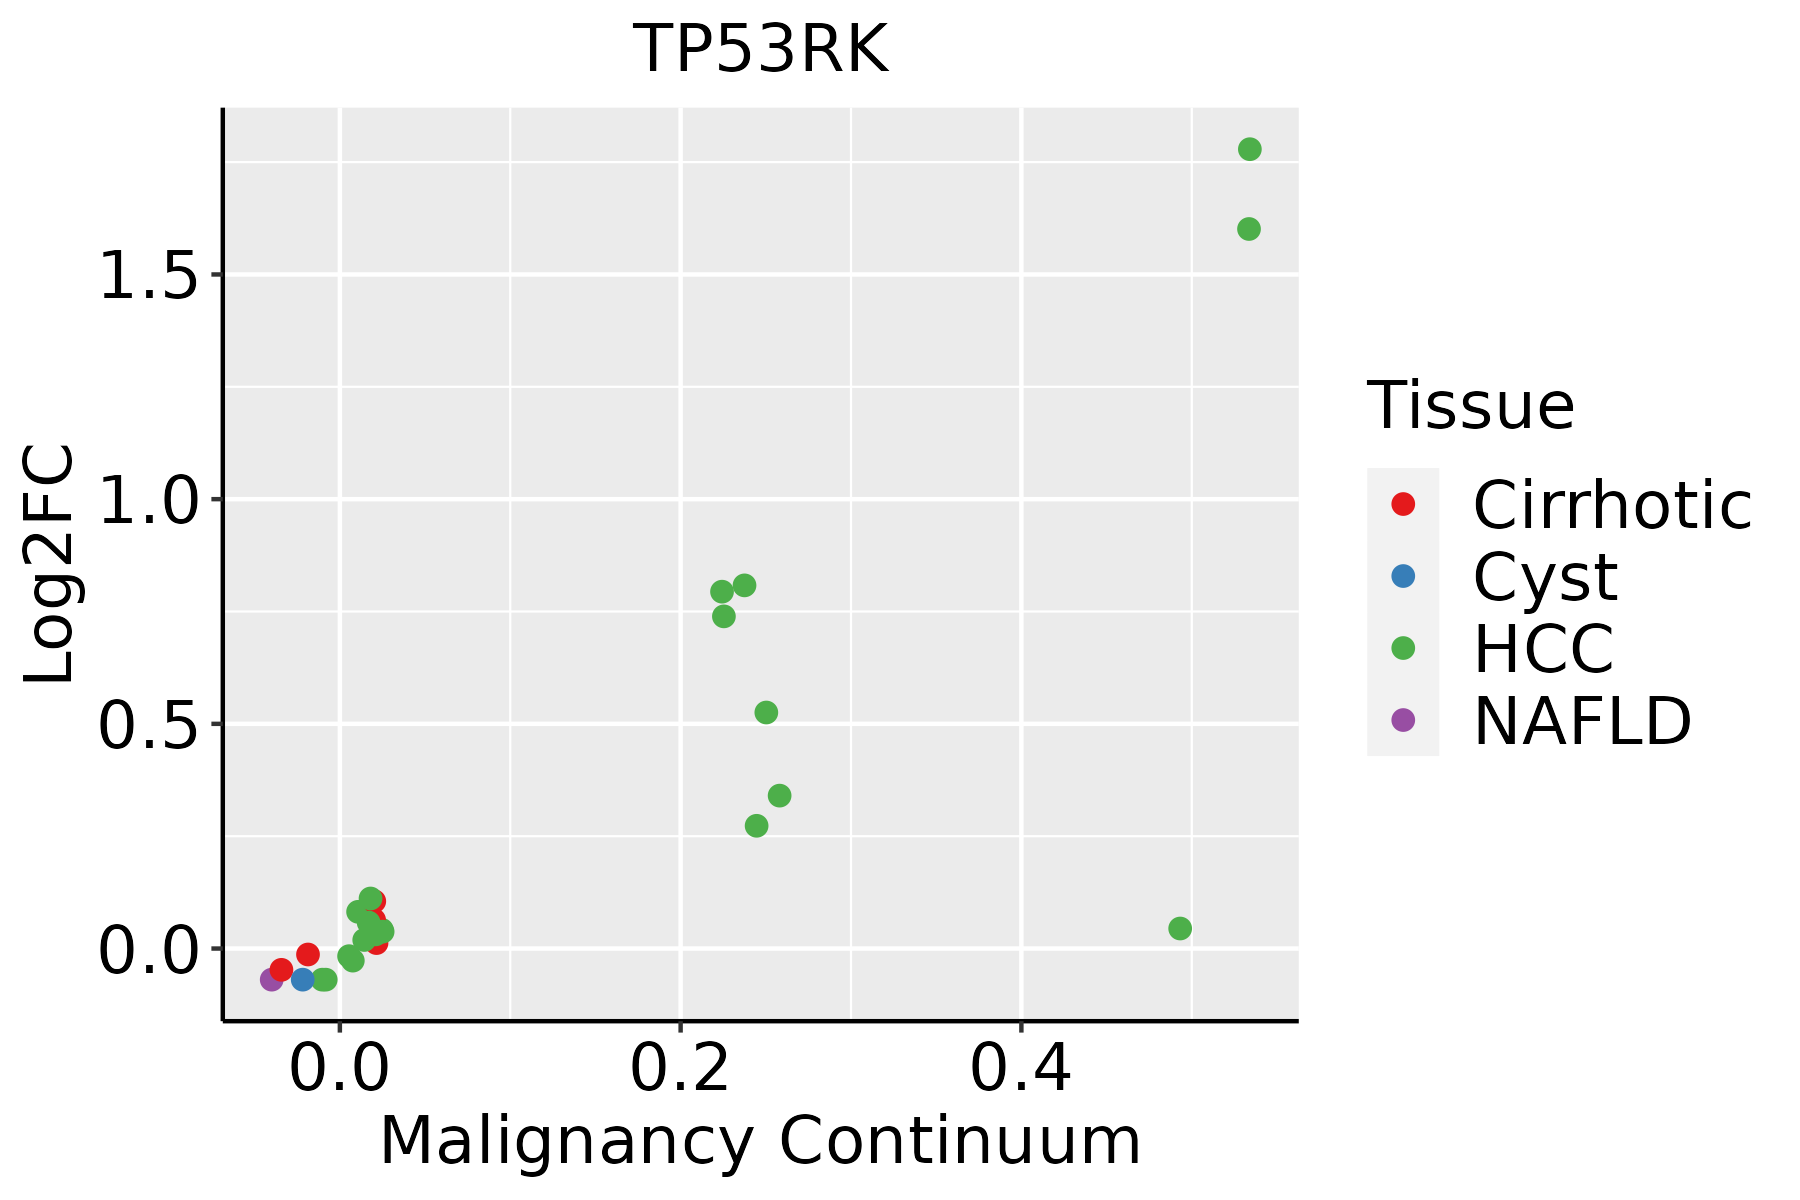 | HCC: Hepatocellular carcinoma |
| NAFLD: Non-alcoholic fatty liver disease | ||
| Oral Cavity | 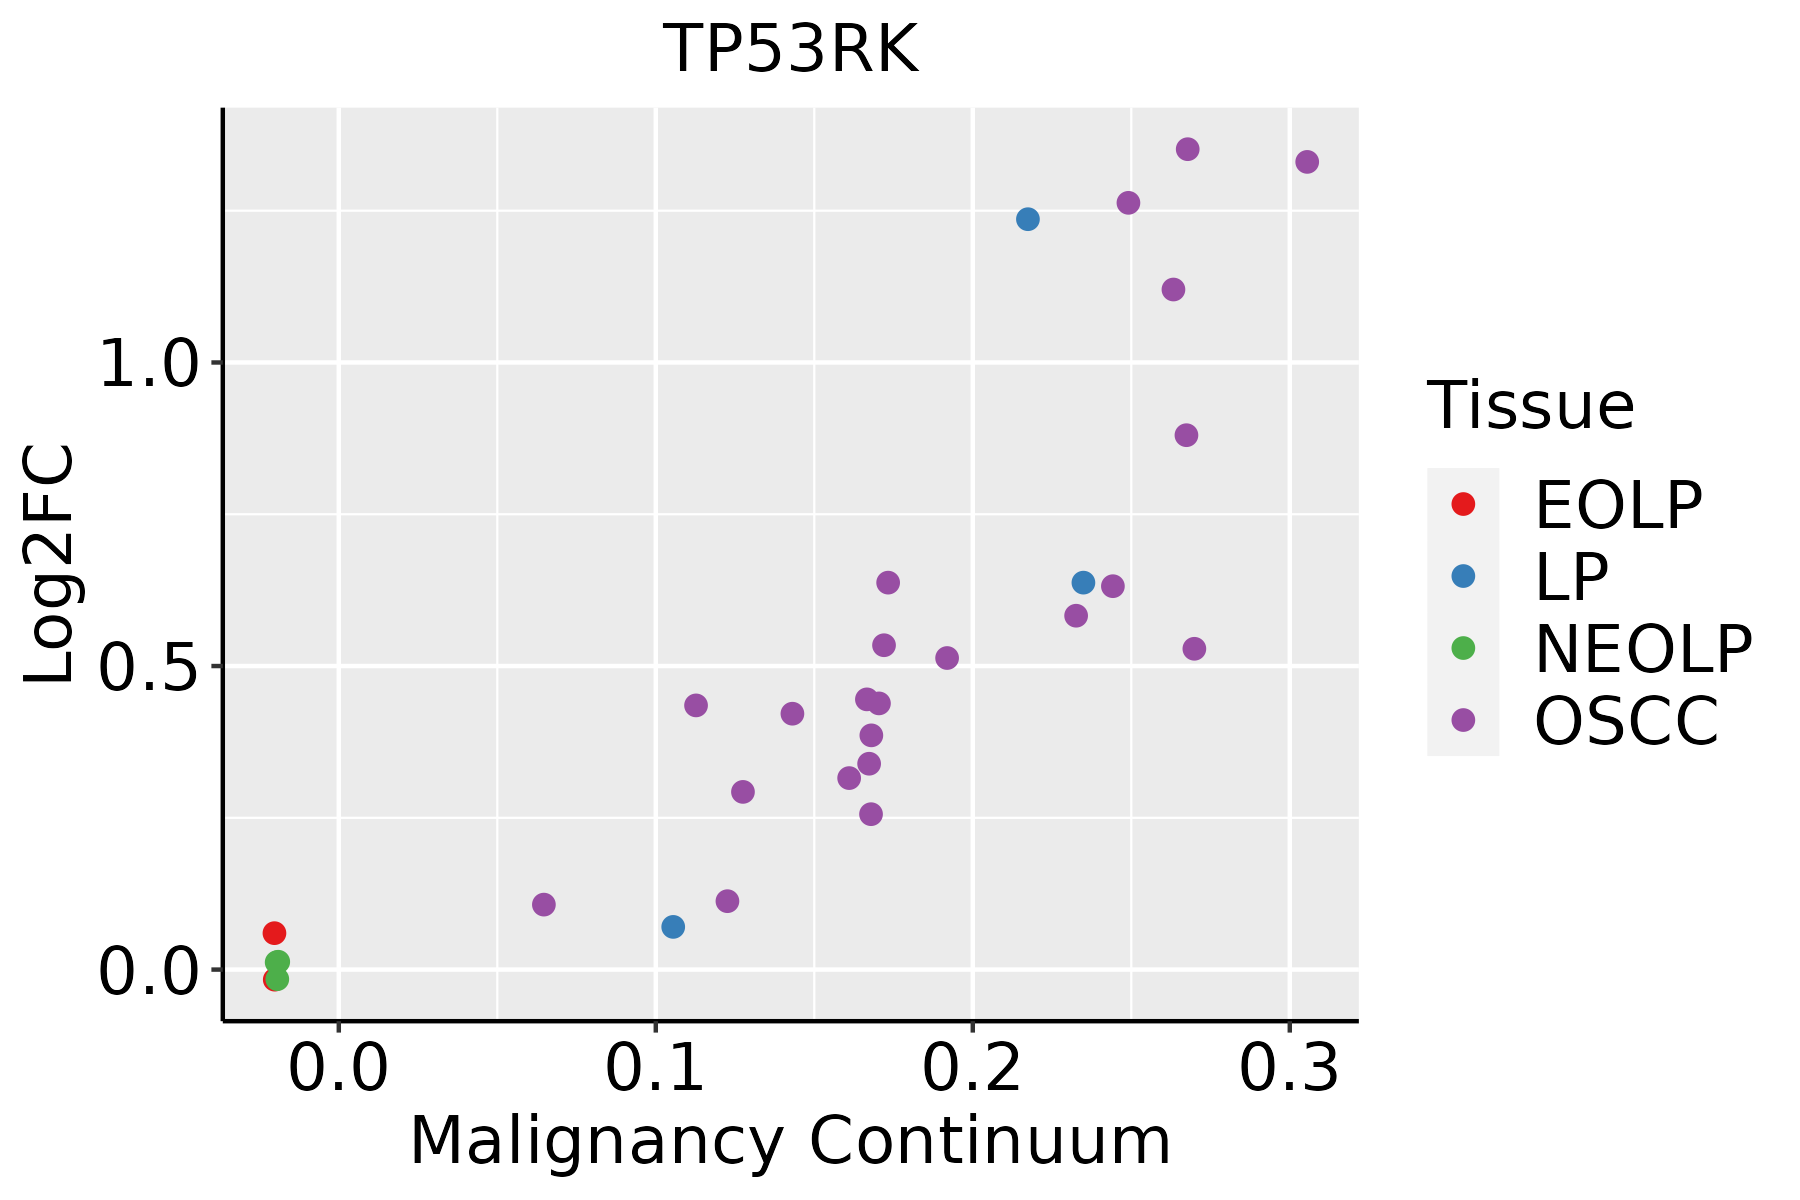 | EOLP: Erosive Oral lichen planus |
| LP: leukoplakia | ||
| NEOLP: Non-erosive oral lichen planus | ||
| OSCC: Oral squamous cell carcinoma | ||
| Skin | 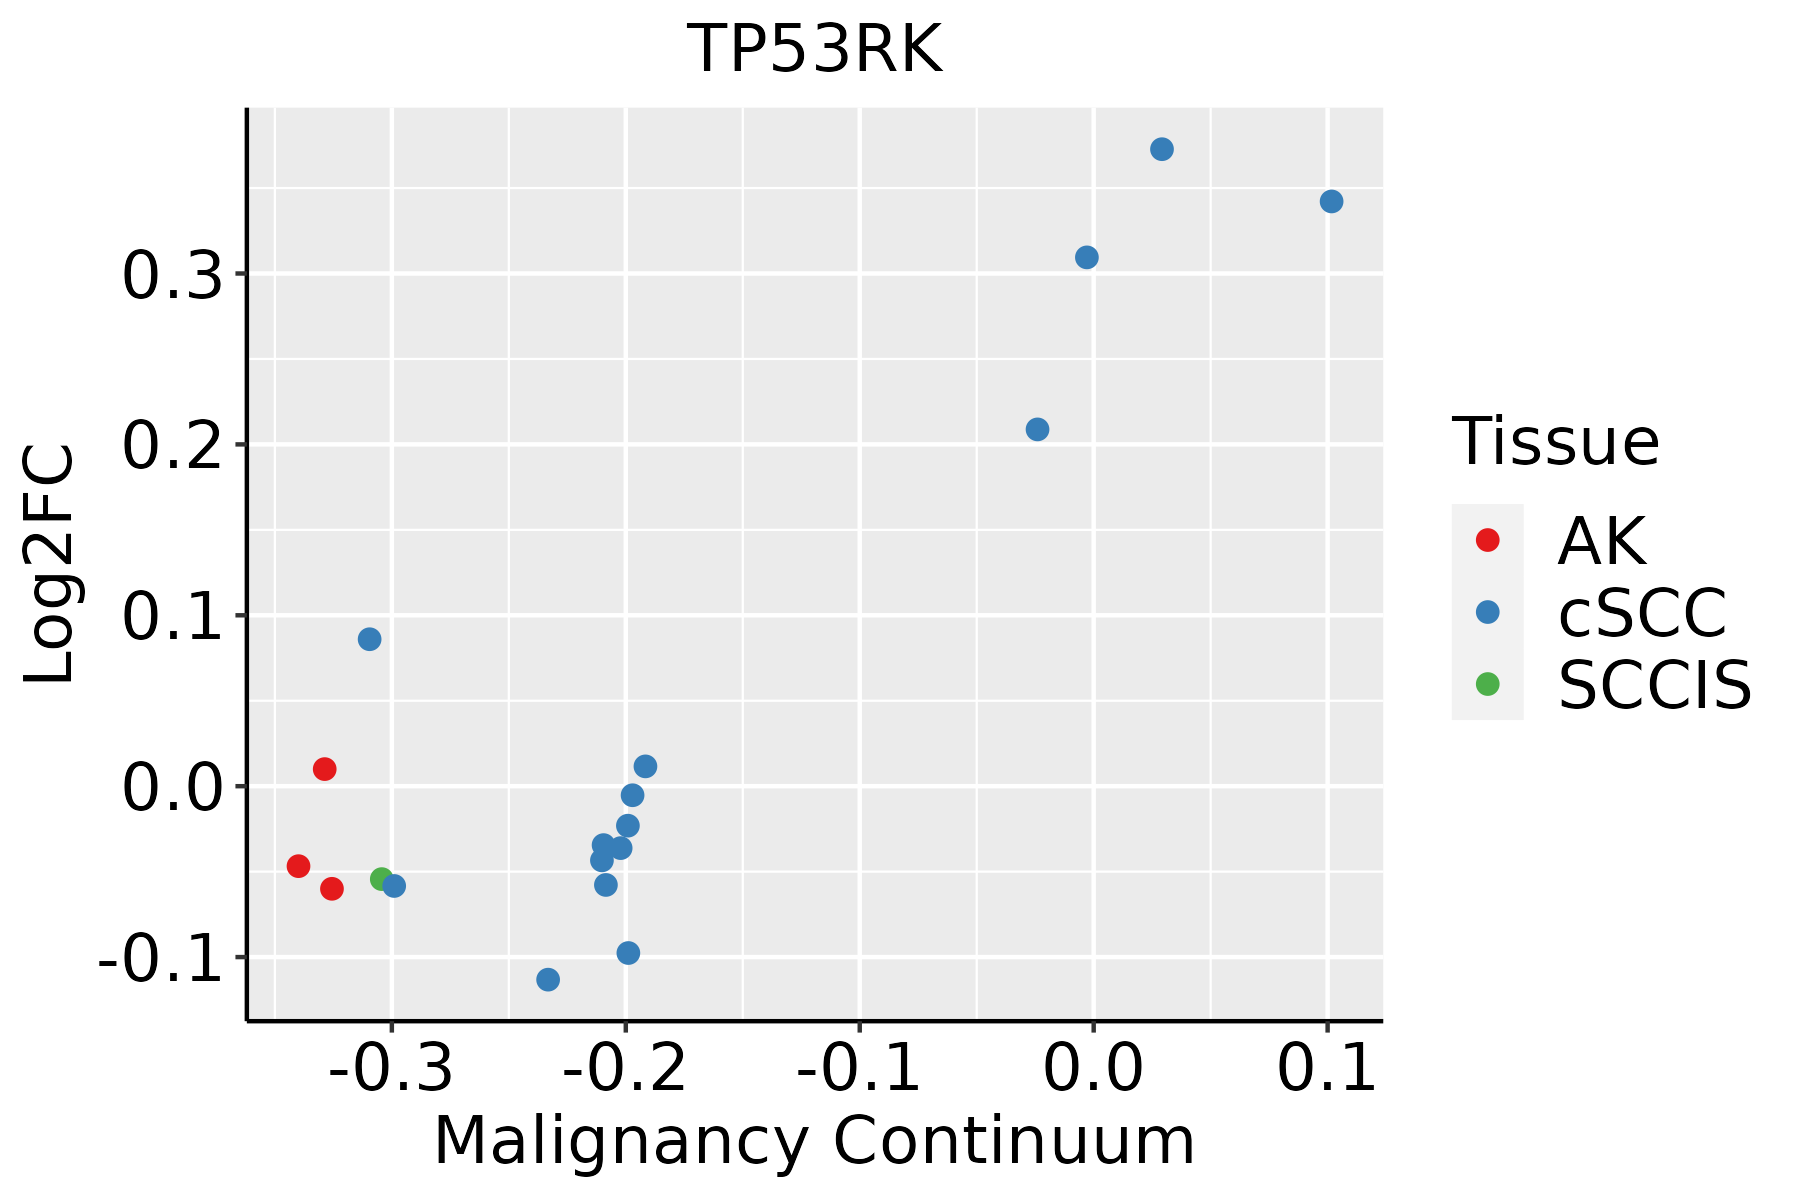 | AK: Actinic keratosis |
| cSCC: Cutaneous squamous cell carcinoma | ||
| SCCIS:squamous cell carcinoma in situ | ||
| Thyroid | 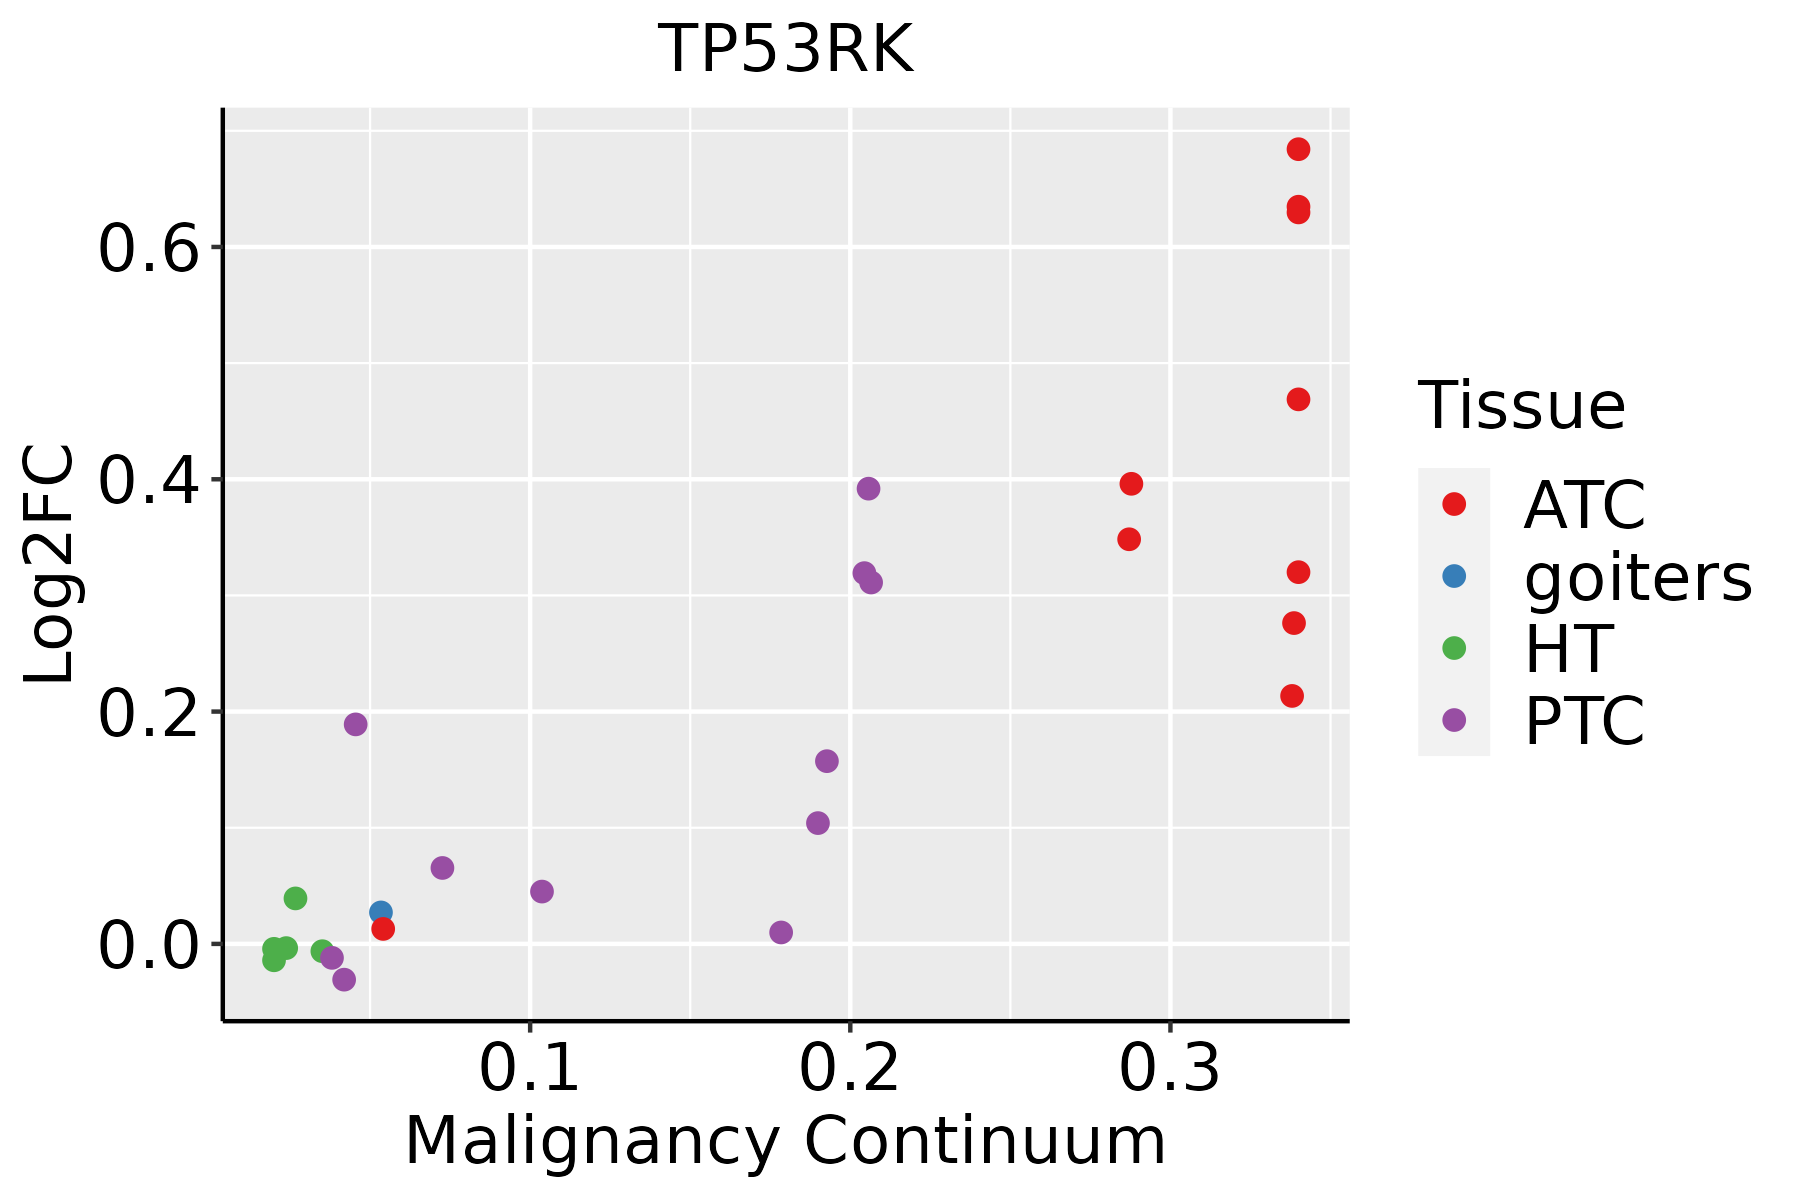 | ATC: Anaplastic thyroid cancer |
| HT: Hashimoto's thyroiditis | ||
| PTC: Papillary thyroid cancer |
| ∗log2FC in expression of this searched gene in stem-like cells from each diseased tissue sample relative to stem-like cells in normal samples in each tissue plotted against the malignancy continuum. Samples are colored based on if they are from different disease stage. |
Top |
Malignant transformation related pathway analysis |
| Find out the enriched GO biological processes and KEGG pathways involved in transition from healthy to precancer to cancer |
| Tissue | Disease Stage | Enriched GO biological Processes |
| Colorectum | AD |  |
| Colorectum | SER |  |
| Colorectum | MSS |  |
| Colorectum | MSI-H |  |
| Colorectum | FAP |  |
| ∗Top 15 enriched GO BP terms are showed in the bar plot of each disease state in each tissue. Each row represents a significant GO biological process which is colored according to the -log10(p.adjust). |
| Page: 1 2 3 4 5 6 7 8 9 |
| GO ID | Tissue | Disease Stage | Description | Gene Ratio | Bg Ratio | pvalue | p.adjust | Count |
| GO:003447010 | Esophagus | HGIN | ncRNA processing | 97/2587 | 395/18723 | 5.92e-09 | 3.90e-07 | 97 |
| GO:007233127 | Esophagus | HGIN | signal transduction by p53 class mediator | 49/2587 | 163/18723 | 5.71e-08 | 3.06e-06 | 49 |
| GO:00346606 | Esophagus | HGIN | ncRNA metabolic process | 104/2587 | 485/18723 | 2.26e-06 | 8.23e-05 | 104 |
| GO:190179627 | Esophagus | HGIN | regulation of signal transduction by p53 class mediator | 26/2587 | 93/18723 | 2.60e-04 | 4.55e-03 | 26 |
| GO:003447015 | Esophagus | ESCC | ncRNA processing | 300/8552 | 395/18723 | 3.09e-35 | 3.26e-32 | 300 |
| GO:003466012 | Esophagus | ESCC | ncRNA metabolic process | 346/8552 | 485/18723 | 4.35e-31 | 2.51e-28 | 346 |
| GO:0072331111 | Esophagus | ESCC | signal transduction by p53 class mediator | 121/8552 | 163/18723 | 9.61e-14 | 4.69e-12 | 121 |
| GO:00080333 | Esophagus | ESCC | tRNA processing | 92/8552 | 127/18723 | 7.83e-10 | 1.93e-08 | 92 |
| GO:00063992 | Esophagus | ESCC | tRNA metabolic process | 122/8552 | 179/18723 | 9.03e-10 | 2.19e-08 | 122 |
| GO:1901796111 | Esophagus | ESCC | regulation of signal transduction by p53 class mediator | 70/8552 | 93/18723 | 5.69e-09 | 1.18e-07 | 70 |
| GO:00344701 | Liver | Cirrhotic | ncRNA processing | 158/4634 | 395/18723 | 1.09e-11 | 6.96e-10 | 158 |
| GO:00346603 | Liver | Cirrhotic | ncRNA metabolic process | 173/4634 | 485/18723 | 3.64e-08 | 1.21e-06 | 173 |
| GO:007233112 | Liver | Cirrhotic | signal transduction by p53 class mediator | 69/4634 | 163/18723 | 5.97e-07 | 1.30e-05 | 69 |
| GO:190179612 | Liver | Cirrhotic | regulation of signal transduction by p53 class mediator | 37/4634 | 93/18723 | 9.58e-04 | 6.78e-03 | 37 |
| GO:00344702 | Liver | HCC | ncRNA processing | 293/7958 | 395/18723 | 4.26e-38 | 6.76e-35 | 293 |
| GO:00346601 | Liver | HCC | ncRNA metabolic process | 332/7958 | 485/18723 | 1.48e-31 | 7.80e-29 | 332 |
| GO:007233122 | Liver | HCC | signal transduction by p53 class mediator | 108/7958 | 163/18723 | 7.14e-10 | 2.23e-08 | 108 |
| GO:0008033 | Liver | HCC | tRNA processing | 87/7958 | 127/18723 | 2.66e-09 | 7.23e-08 | 87 |
| GO:190179622 | Liver | HCC | regulation of signal transduction by p53 class mediator | 64/7958 | 93/18723 | 2.53e-07 | 4.45e-06 | 64 |
| GO:0006399 | Liver | HCC | tRNA metabolic process | 108/7958 | 179/18723 | 1.07e-06 | 1.59e-05 | 108 |
| Page: 1 2 3 |
| Pathway ID | Tissue | Disease Stage | Description | Gene Ratio | Bg Ratio | pvalue | p.adjust | qvalue | Count |
| Page: 1 |
Top |
Cell-cell communication analysis |
| Identification of potential cell-cell interactions between two cell types and their ligand-receptor pairs for different disease states |
| Ligand | Receptor | LRpair | Pathway | Tissue | Disease Stage |
| Page: 1 |
Top |
Single-cell gene regulatory network inference analysis |
| Find out the significant the regulons (TFs) and the target genes of each regulon across cell types for different disease states |
| TF | Cell Type | Tissue | Disease Stage | Target Gene | RSS | Regulon Activity |
| ∗The dot plots of a searched regulon are shown for all cell subpopulations in each disease state of each tissue based on the regulon specific score inferred using pySCENIC and by calculating the average expression. |
| Page: 1 |
Top |
Somatic mutation of malignant transformation related genes |
| Annotation of somatic variants for genes involved in malignant transformation |
| Hugo Symbol | Variant Class | Variant Classification | dbSNP RS | HGVSc | HGVSp | HGVSp Short | SWISSPROT | BIOTYPE | SIFT | PolyPhen | Tumor Sample Barcode | Tissue | Histology | Sex | Age | Stage | Therapy Types | Drugs | Outcome |
| TP53RK | insertion | In_Frame_Ins | novel | c.611_612insCGCCCGGGATCCCGCAGTCAGCGCAGCCGCCATCTTATGGCT | p.Glu204delinsAspAlaArgAspProAlaValSerAlaAlaAlaIleLeuTrpLeu | p.E204delinsDARDPAVSAAAILWL | Q96S44 | protein_coding | TCGA-A7-A0CJ-01 | Breast | breast invasive carcinoma | Female | <65 | I/II | Chemotherapy | cytoxan | SD | ||
| TP53RK | SNV | Missense_Mutation | novel | c.459N>A | p.Met153Ile | p.M153I | Q96S44 | protein_coding | deleterious(0.03) | benign(0.15) | TCGA-2W-A8YY-01 | Cervix | cervical & endocervical cancer | Female | <65 | I/II | Chemotherapy | cisplatin | CR |
| TP53RK | SNV | Missense_Mutation | rs770461591 | c.564N>G | p.Phe188Leu | p.F188L | Q96S44 | protein_coding | tolerated(0.07) | possibly_damaging(0.472) | TCGA-EK-A3GK-01 | Cervix | cervical & endocervical cancer | Female | <65 | I/II | Unknown | Unknown | SD |
| TP53RK | SNV | Missense_Mutation | c.469N>A | p.Asp157Asn | p.D157N | Q96S44 | protein_coding | tolerated(0.28) | possibly_damaging(0.705) | TCGA-AA-3510-01 | Colorectum | colon adenocarcinoma | Male | >=65 | I/II | Unknown | Unknown | SD | |
| TP53RK | SNV | Missense_Mutation | rs553547069 | c.727C>T | p.Arg243Cys | p.R243C | Q96S44 | protein_coding | deleterious(0) | probably_damaging(0.998) | TCGA-AA-3984-01 | Colorectum | colon adenocarcinoma | Female | <65 | I/II | Unknown | Unknown | SD |
| TP53RK | SNV | Missense_Mutation | novel | c.669G>T | p.Lys223Asn | p.K223N | Q96S44 | protein_coding | tolerated(0.07) | benign(0.187) | TCGA-AA-A00N-01 | Colorectum | colon adenocarcinoma | Male | >=65 | I/II | Unknown | Unknown | PD |
| TP53RK | SNV | Missense_Mutation | rs149404267 | c.455G>A | p.Arg152Gln | p.R152Q | Q96S44 | protein_coding | tolerated(0.25) | benign(0) | TCGA-EI-6917-01 | Colorectum | rectum adenocarcinoma | Male | <65 | III/IV | Chemotherapy | 5fluorouracil+oxaciplatina+l-folinian | SD |
| TP53RK | SNV | Missense_Mutation | novel | c.680C>A | p.Thr227Asn | p.T227N | Q96S44 | protein_coding | tolerated(0.12) | benign(0.015) | TCGA-AJ-A8CW-01 | Endometrium | uterine corpus endometrioid carcinoma | Female | <65 | I/II | Unknown | Unknown | SD |
| TP53RK | SNV | Missense_Mutation | novel | c.638N>G | p.Asn213Ser | p.N213S | Q96S44 | protein_coding | deleterious(0.03) | benign(0.077) | TCGA-AX-A2HD-01 | Endometrium | uterine corpus endometrioid carcinoma | Female | >=65 | III/IV | Unknown | Unknown | SD |
| TP53RK | SNV | Missense_Mutation | c.469N>T | p.Asp157Tyr | p.D157Y | Q96S44 | protein_coding | deleterious(0) | probably_damaging(0.992) | TCGA-B5-A1MR-01 | Endometrium | uterine corpus endometrioid carcinoma | Female | >=65 | III/IV | Unknown | Unknown | SD |
| Page: 1 2 |
Top |
Related drugs of malignant transformation related genes |
| Identification of chemicals and drugs interact with genes involved in malignant transfromation |
| (DGIdb 4.0) |
| Entrez ID | Symbol | Category | Interaction Types | Drug Claim Name | Drug Name | PMIDs |
| Page: 1 |

Copyright 2023-Present -The University of Texas Health Science Center at Houston |