
|
|||||
|
 | |
| |
| |
| |
| |
| |
|
Gene: TP53INP2 |
Gene summary for TP53INP2 |
| Gene information | Species | Human | Gene symbol | TP53INP2 | Gene ID | 58476 |
| Gene name | tumor protein p53 inducible nuclear protein 2 | |
| Gene Alias | C20orf110 | |
| Cytomap | 20q11.22 | |
| Gene Type | protein-coding | GO ID | GO:0000045 | UniProtAcc | Q8IXH6 |
Top |
Malignant transformation analysis |
| Identification of the aberrant gene expression in precancerous and cancerous lesions by comparing the gene expression of stem-like cells in diseased tissues with normal stem cells |
| Entrez ID | Symbol | Replicates | Species | Organ | Tissue | Adj P-value | Log2FC | Malignancy |
| 58476 | TP53INP2 | HTA11_2487_2000001011 | Human | Colorectum | SER | 1.79e-08 | 4.89e-01 | -0.1808 |
| 58476 | TP53INP2 | HTA11_347_2000001011 | Human | Colorectum | AD | 1.35e-04 | 2.80e-01 | -0.1954 |
| 58476 | TP53INP2 | HTA11_411_2000001011 | Human | Colorectum | SER | 8.09e-03 | 1.02e+00 | -0.2602 |
| 58476 | TP53INP2 | HTA11_2112_2000001011 | Human | Colorectum | SER | 5.30e-09 | 1.34e+00 | -0.2196 |
| 58476 | TP53INP2 | HTA11_696_2000001011 | Human | Colorectum | AD | 2.61e-12 | 3.57e-01 | -0.1464 |
| 58476 | TP53INP2 | HTA11_866_2000001011 | Human | Colorectum | AD | 1.23e-02 | 1.16e-01 | -0.1001 |
| 58476 | TP53INP2 | HTA11_5212_2000001011 | Human | Colorectum | AD | 9.68e-05 | 4.88e-01 | -0.2061 |
| 58476 | TP53INP2 | LZE20T | Human | Esophagus | ESCC | 2.90e-03 | 9.52e-02 | 0.0662 |
| 58476 | TP53INP2 | LZE24T | Human | Esophagus | ESCC | 7.54e-27 | 7.85e-01 | 0.0596 |
| 58476 | TP53INP2 | P2T-E | Human | Esophagus | ESCC | 3.86e-04 | 1.71e-02 | 0.1177 |
| 58476 | TP53INP2 | P4T-E | Human | Esophagus | ESCC | 1.31e-05 | 1.12e-01 | 0.1323 |
| 58476 | TP53INP2 | P5T-E | Human | Esophagus | ESCC | 2.23e-03 | -1.11e-02 | 0.1327 |
| 58476 | TP53INP2 | P8T-E | Human | Esophagus | ESCC | 6.59e-12 | 3.55e-01 | 0.0889 |
| 58476 | TP53INP2 | P9T-E | Human | Esophagus | ESCC | 7.77e-12 | 3.05e-01 | 0.1131 |
| 58476 | TP53INP2 | P10T-E | Human | Esophagus | ESCC | 6.55e-11 | 1.28e-01 | 0.116 |
| 58476 | TP53INP2 | P11T-E | Human | Esophagus | ESCC | 1.81e-07 | 3.37e-01 | 0.1426 |
| 58476 | TP53INP2 | P12T-E | Human | Esophagus | ESCC | 3.63e-12 | 3.27e-01 | 0.1122 |
| 58476 | TP53INP2 | P15T-E | Human | Esophagus | ESCC | 1.83e-04 | 1.12e-01 | 0.1149 |
| 58476 | TP53INP2 | P16T-E | Human | Esophagus | ESCC | 4.33e-07 | 5.15e-02 | 0.1153 |
| 58476 | TP53INP2 | P20T-E | Human | Esophagus | ESCC | 3.80e-07 | 1.71e-01 | 0.1124 |
| Page: 1 2 3 4 |
| Tissue | Expression Dynamics | Abbreviation |
| Colorectum (GSE201348) |  | FAP: Familial adenomatous polyposis |
| CRC: Colorectal cancer | ||
| Colorectum (HTA11) |  | AD: Adenomas |
| SER: Sessile serrated lesions | ||
| MSI-H: Microsatellite-high colorectal cancer | ||
| MSS: Microsatellite stable colorectal cancer | ||
| Esophagus |  | ESCC: Esophageal squamous cell carcinoma |
| HGIN: High-grade intraepithelial neoplasias | ||
| LGIN: Low-grade intraepithelial neoplasias | ||
| Liver |  | HCC: Hepatocellular carcinoma |
| NAFLD: Non-alcoholic fatty liver disease | ||
| Thyroid | 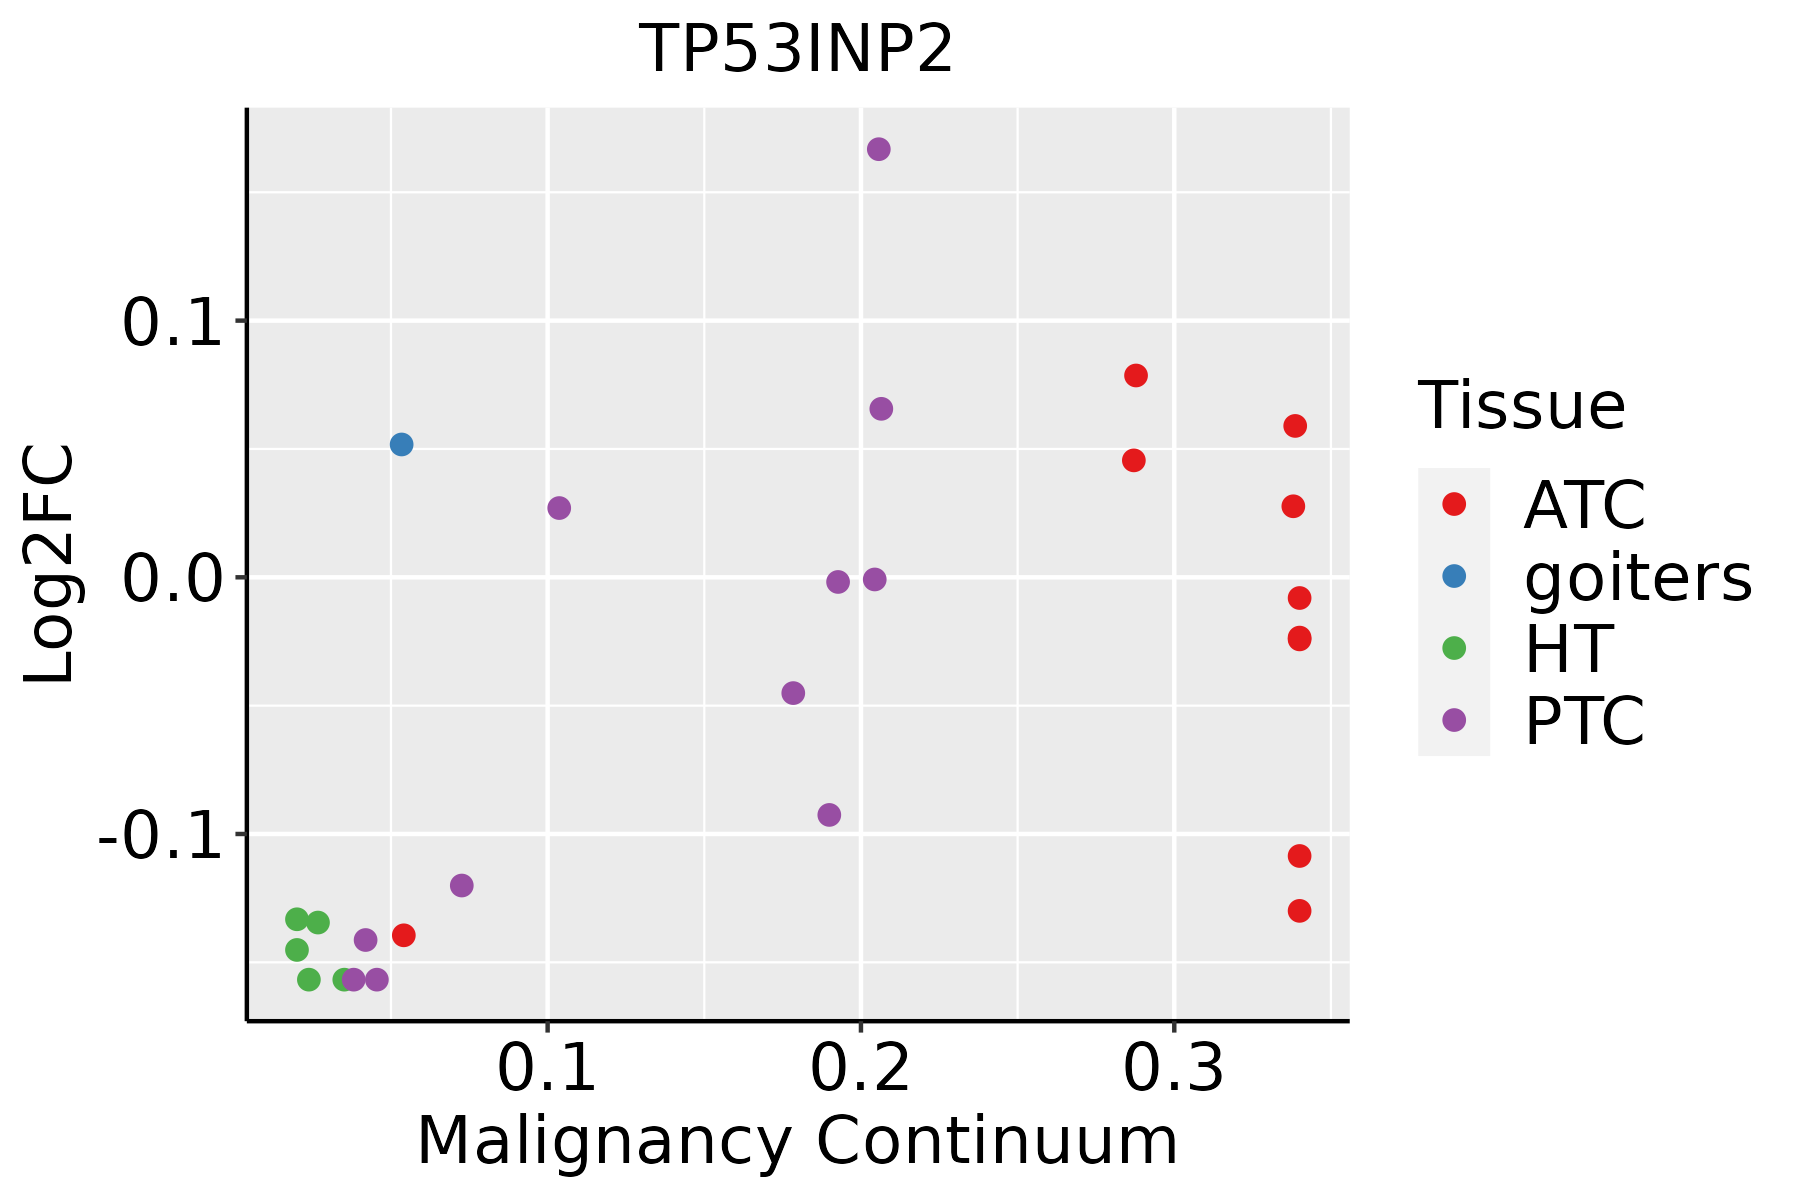 | ATC: Anaplastic thyroid cancer |
| HT: Hashimoto's thyroiditis | ||
| PTC: Papillary thyroid cancer |
| ∗log2FC in expression of this searched gene in stem-like cells from each diseased tissue sample relative to stem-like cells in normal samples in each tissue plotted against the malignancy continuum. Samples are colored based on if they are from different disease stage. |
Top |
Malignant transformation related pathway analysis |
| Find out the enriched GO biological processes and KEGG pathways involved in transition from healthy to precancer to cancer |
| Tissue | Disease Stage | Enriched GO biological Processes |
| Colorectum | AD |  |
| Colorectum | SER |  |
| Colorectum | MSS |  |
| Colorectum | MSI-H |  |
| Colorectum | FAP |  |
| ∗Top 15 enriched GO BP terms are showed in the bar plot of each disease state in each tissue. Each row represents a significant GO biological process which is colored according to the -log10(p.adjust). |
| Page: 1 2 3 4 5 6 7 8 9 |
| GO ID | Tissue | Disease Stage | Description | Gene Ratio | Bg Ratio | pvalue | p.adjust | Count |
| GO:0009896 | Colorectum | AD | positive regulation of catabolic process | 180/3918 | 492/18723 | 4.33e-16 | 1.94e-13 | 180 |
| GO:0031331 | Colorectum | AD | positive regulation of cellular catabolic process | 156/3918 | 427/18723 | 4.68e-14 | 1.05e-11 | 156 |
| GO:0010506 | Colorectum | AD | regulation of autophagy | 111/3918 | 317/18723 | 3.57e-09 | 2.35e-07 | 111 |
| GO:0016236 | Colorectum | AD | macroautophagy | 103/3918 | 291/18723 | 6.76e-09 | 4.15e-07 | 103 |
| GO:0060249 | Colorectum | AD | anatomical structure homeostasis | 94/3918 | 314/18723 | 9.37e-05 | 1.42e-03 | 94 |
| GO:0001894 | Colorectum | AD | tissue homeostasis | 81/3918 | 268/18723 | 1.96e-04 | 2.62e-03 | 81 |
| GO:0010508 | Colorectum | AD | positive regulation of autophagy | 43/3918 | 124/18723 | 2.64e-04 | 3.27e-03 | 43 |
| GO:0001649 | Colorectum | AD | osteoblast differentiation | 70/3918 | 229/18723 | 3.59e-04 | 4.18e-03 | 70 |
| GO:1903828 | Colorectum | AD | negative regulation of cellular protein localization | 39/3918 | 117/18723 | 1.18e-03 | 1.06e-02 | 39 |
| GO:0007033 | Colorectum | AD | vacuole organization | 53/3918 | 180/18723 | 4.18e-03 | 2.89e-02 | 53 |
| GO:0001503 | Colorectum | AD | ossification | 106/3918 | 408/18723 | 7.68e-03 | 4.64e-02 | 106 |
| GO:00098961 | Colorectum | SER | positive regulation of catabolic process | 132/2897 | 492/18723 | 4.16e-11 | 6.72e-09 | 132 |
| GO:00313311 | Colorectum | SER | positive regulation of cellular catabolic process | 114/2897 | 427/18723 | 1.22e-09 | 1.27e-07 | 114 |
| GO:00162361 | Colorectum | SER | macroautophagy | 79/2897 | 291/18723 | 1.97e-07 | 1.10e-05 | 79 |
| GO:00018941 | Colorectum | SER | tissue homeostasis | 66/2897 | 268/18723 | 5.87e-05 | 1.37e-03 | 66 |
| GO:00602491 | Colorectum | SER | anatomical structure homeostasis | 74/2897 | 314/18723 | 1.01e-04 | 2.13e-03 | 74 |
| GO:00105061 | Colorectum | SER | regulation of autophagy | 74/2897 | 317/18723 | 1.39e-04 | 2.77e-03 | 74 |
| GO:00016491 | Colorectum | SER | osteoblast differentiation | 56/2897 | 229/18723 | 2.49e-04 | 4.21e-03 | 56 |
| GO:19038281 | Colorectum | SER | negative regulation of cellular protein localization | 30/2897 | 117/18723 | 2.96e-03 | 2.62e-02 | 30 |
| GO:00015031 | Colorectum | SER | ossification | 82/2897 | 408/18723 | 6.76e-03 | 4.78e-02 | 82 |
| Page: 1 2 3 4 |
| Pathway ID | Tissue | Disease Stage | Description | Gene Ratio | Bg Ratio | pvalue | p.adjust | qvalue | Count |
| hsa04140 | Colorectum | AD | Autophagy - animal | 49/2092 | 141/8465 | 4.58e-03 | 2.20e-02 | 1.40e-02 | 49 |
| hsa041401 | Colorectum | AD | Autophagy - animal | 49/2092 | 141/8465 | 4.58e-03 | 2.20e-02 | 1.40e-02 | 49 |
| hsa041402 | Colorectum | SER | Autophagy - animal | 39/1580 | 141/8465 | 5.43e-03 | 3.28e-02 | 2.38e-02 | 39 |
| hsa041403 | Colorectum | SER | Autophagy - animal | 39/1580 | 141/8465 | 5.43e-03 | 3.28e-02 | 2.38e-02 | 39 |
| hsa0414010 | Esophagus | ESCC | Autophagy - animal | 101/4205 | 141/8465 | 7.60e-08 | 6.21e-07 | 3.18e-07 | 101 |
| hsa0414015 | Esophagus | ESCC | Autophagy - animal | 101/4205 | 141/8465 | 7.60e-08 | 6.21e-07 | 3.18e-07 | 101 |
| hsa0414021 | Liver | HCC | Autophagy - animal | 99/4020 | 141/8465 | 3.08e-08 | 4.70e-07 | 2.61e-07 | 99 |
| hsa0414031 | Liver | HCC | Autophagy - animal | 99/4020 | 141/8465 | 3.08e-08 | 4.70e-07 | 2.61e-07 | 99 |
| Page: 1 |
Top |
Cell-cell communication analysis |
| Identification of potential cell-cell interactions between two cell types and their ligand-receptor pairs for different disease states |
| Ligand | Receptor | LRpair | Pathway | Tissue | Disease Stage |
| Page: 1 |
Top |
Single-cell gene regulatory network inference analysis |
| Find out the significant the regulons (TFs) and the target genes of each regulon across cell types for different disease states |
| TF | Cell Type | Tissue | Disease Stage | Target Gene | RSS | Regulon Activity |
| ∗The dot plots of a searched regulon are shown for all cell subpopulations in each disease state of each tissue based on the regulon specific score inferred using pySCENIC and by calculating the average expression. |
| Page: 1 |
Top |
Somatic mutation of malignant transformation related genes |
| Annotation of somatic variants for genes involved in malignant transformation |
| Hugo Symbol | Variant Class | Variant Classification | dbSNP RS | HGVSc | HGVSp | HGVSp Short | SWISSPROT | BIOTYPE | SIFT | PolyPhen | Tumor Sample Barcode | Tissue | Histology | Sex | Age | Stage | Therapy Types | Drugs | Outcome |
| TP53INP2 | insertion | Frame_Shift_Ins | rs758602096 | c.42_43insC | p.Glu17ArgfsTer15 | p.E17Rfs*15 | Q8IXH6 | protein_coding | TCGA-BH-A18G-01 | Breast | breast invasive carcinoma | Female | >=65 | I/II | Unknown | Unknown | SD | ||
| TP53INP2 | SNV | Missense_Mutation | novel | c.80N>T | p.Ser27Leu | p.S27L | Q8IXH6 | protein_coding | deleterious(0.01) | possibly_damaging(0.683) | TCGA-2W-A8YY-01 | Cervix | cervical & endocervical cancer | Female | <65 | I/II | Chemotherapy | cisplatin | CR |
| TP53INP2 | SNV | Missense_Mutation | novel | c.589G>A | p.Glu197Lys | p.E197K | Q8IXH6 | protein_coding | deleterious(0.01) | benign(0.06) | TCGA-VS-A959-01 | Cervix | cervical & endocervical cancer | Female | >=65 | I/II | Unknown | Unknown | SD |
| TP53INP2 | SNV | Missense_Mutation | rs777400598 | c.47N>G | p.Pro16Arg | p.P16R | Q8IXH6 | protein_coding | deleterious(0.02) | possibly_damaging(0.452) | TCGA-AZ-6600-01 | Colorectum | colon adenocarcinoma | Male | <65 | III/IV | Chemotherapy | cpt-11 | PD |
| TP53INP2 | SNV | Missense_Mutation | c.113T>C | p.Ile38Thr | p.I38T | Q8IXH6 | protein_coding | deleterious(0) | probably_damaging(0.964) | TCGA-AG-3885-01 | Colorectum | rectum adenocarcinoma | Female | >=65 | III/IV | Ancillary | zoledronic | SD | |
| TP53INP2 | SNV | Missense_Mutation | c.89N>T | p.Asp30Val | p.D30V | Q8IXH6 | protein_coding | deleterious(0) | benign(0.131) | TCGA-B5-A11J-01 | Endometrium | uterine corpus endometrioid carcinoma | Female | <65 | I/II | Unknown | Unknown | SD | |
| TP53INP2 | SNV | Missense_Mutation | c.319N>C | p.Ser107Pro | p.S107P | Q8IXH6 | protein_coding | deleterious(0) | probably_damaging(0.999) | TCGA-B5-A11X-01 | Endometrium | uterine corpus endometrioid carcinoma | Female | >=65 | III/IV | Chemotherapy | paclitaxel | PD | |
| TP53INP2 | SNV | Missense_Mutation | novel | c.340A>C | p.Thr114Pro | p.T114P | Q8IXH6 | protein_coding | deleterious(0.03) | possibly_damaging(0.905) | TCGA-62-A46U-01 | Lung | lung adenocarcinoma | Female | >=65 | I/II | Chemotherapy | carboplatin | CR |
| TP53INP2 | SNV | Missense_Mutation | c.295N>A | p.Leu99Ile | p.L99I | Q8IXH6 | protein_coding | deleterious(0) | probably_damaging(0.997) | TCGA-L9-A7SV-01 | Lung | lung adenocarcinoma | Male | >=65 | I/II | Chemotherapy | cisplatin | CR | |
| TP53INP2 | SNV | Missense_Mutation | novel | c.164N>T | p.Ala55Val | p.A55V | Q8IXH6 | protein_coding | tolerated(0.34) | benign(0.134) | TCGA-85-7843-01 | Lung | lung squamous cell carcinoma | Male | <65 | I/II | Unknown | Unknown | SD |
| Page: 1 2 |
Top |
Related drugs of malignant transformation related genes |
| Identification of chemicals and drugs interact with genes involved in malignant transfromation |
| (DGIdb 4.0) |
| Entrez ID | Symbol | Category | Interaction Types | Drug Claim Name | Drug Name | PMIDs |
| Page: 1 |

Copyright 2023-Present -The University of Texas Health Science Center at Houston |