
|
|||||
|
 | |
| |
| |
| |
| |
| |
|
Gene: TP53I13 |
Gene summary for TP53I13 |
| Gene information | Species | Human | Gene symbol | TP53I13 | Gene ID | 90313 |
| Gene name | tumor protein p53 inducible protein 13 | |
| Gene Alias | DSCP1 | |
| Cytomap | 17q11.2 | |
| Gene Type | protein-coding | GO ID | GO:0007049 | UniProtAcc | A0A024QZ67 |
Top |
Malignant transformation analysis |
| Identification of the aberrant gene expression in precancerous and cancerous lesions by comparing the gene expression of stem-like cells in diseased tissues with normal stem cells |
| Entrez ID | Symbol | Replicates | Species | Organ | Tissue | Adj P-value | Log2FC | Malignancy |
| 90313 | TP53I13 | HTA11_3410_2000001011 | Human | Colorectum | AD | 1.83e-02 | 1.03e-01 | 0.0155 |
| 90313 | TP53I13 | HTA11_2487_2000001011 | Human | Colorectum | SER | 5.80e-07 | 2.41e-01 | -0.1808 |
| 90313 | TP53I13 | HTA11_2951_2000001011 | Human | Colorectum | AD | 3.40e-02 | 2.22e-01 | 0.0216 |
| 90313 | TP53I13 | HTA11_1938_2000001011 | Human | Colorectum | AD | 3.43e-08 | 2.87e-01 | -0.0811 |
| 90313 | TP53I13 | HTA11_78_2000001011 | Human | Colorectum | AD | 1.66e-02 | 1.38e-01 | -0.1088 |
| 90313 | TP53I13 | HTA11_347_2000001011 | Human | Colorectum | AD | 1.86e-11 | 2.40e-01 | -0.1954 |
| 90313 | TP53I13 | HTA11_2112_2000001011 | Human | Colorectum | SER | 1.90e-02 | 3.67e-01 | -0.2196 |
| 90313 | TP53I13 | HTA11_3361_2000001011 | Human | Colorectum | AD | 6.03e-08 | 2.46e-01 | -0.1207 |
| 90313 | TP53I13 | HTA11_83_2000001011 | Human | Colorectum | SER | 1.79e-04 | 1.77e-01 | -0.1526 |
| 90313 | TP53I13 | HTA11_696_2000001011 | Human | Colorectum | AD | 2.03e-09 | 1.94e-01 | -0.1464 |
| 90313 | TP53I13 | HTA11_866_2000001011 | Human | Colorectum | AD | 9.56e-07 | 1.64e-01 | -0.1001 |
| 90313 | TP53I13 | HTA11_1391_2000001011 | Human | Colorectum | AD | 1.35e-16 | 3.32e-01 | -0.059 |
| 90313 | TP53I13 | HTA11_2992_2000001011 | Human | Colorectum | SER | 1.72e-05 | 2.87e-01 | -0.1706 |
| 90313 | TP53I13 | HTA11_5216_2000001011 | Human | Colorectum | SER | 3.34e-04 | 3.36e-01 | -0.1462 |
| 90313 | TP53I13 | HTA11_546_2000001011 | Human | Colorectum | AD | 4.83e-08 | 3.33e-01 | -0.0842 |
| 90313 | TP53I13 | HTA11_866_3004761011 | Human | Colorectum | AD | 3.40e-12 | 2.66e-01 | 0.096 |
| 90313 | TP53I13 | HTA11_9408_2000001011 | Human | Colorectum | AD | 9.81e-03 | 2.34e-01 | 0.0451 |
| 90313 | TP53I13 | HTA11_8622_2000001021 | Human | Colorectum | SER | 6.14e-04 | 2.26e-01 | 0.0528 |
| 90313 | TP53I13 | HTA11_7663_2000001011 | Human | Colorectum | SER | 7.58e-09 | 3.83e-01 | 0.0131 |
| 90313 | TP53I13 | HTA11_10623_2000001011 | Human | Colorectum | AD | 3.04e-05 | 3.00e-01 | -0.0177 |
| Page: 1 2 3 4 5 6 7 8 |
| Tissue | Expression Dynamics | Abbreviation |
| Colorectum (GSE201348) |  | FAP: Familial adenomatous polyposis |
| CRC: Colorectal cancer | ||
| Colorectum (HTA11) |  | AD: Adenomas |
| SER: Sessile serrated lesions | ||
| MSI-H: Microsatellite-high colorectal cancer | ||
| MSS: Microsatellite stable colorectal cancer | ||
| Esophagus | 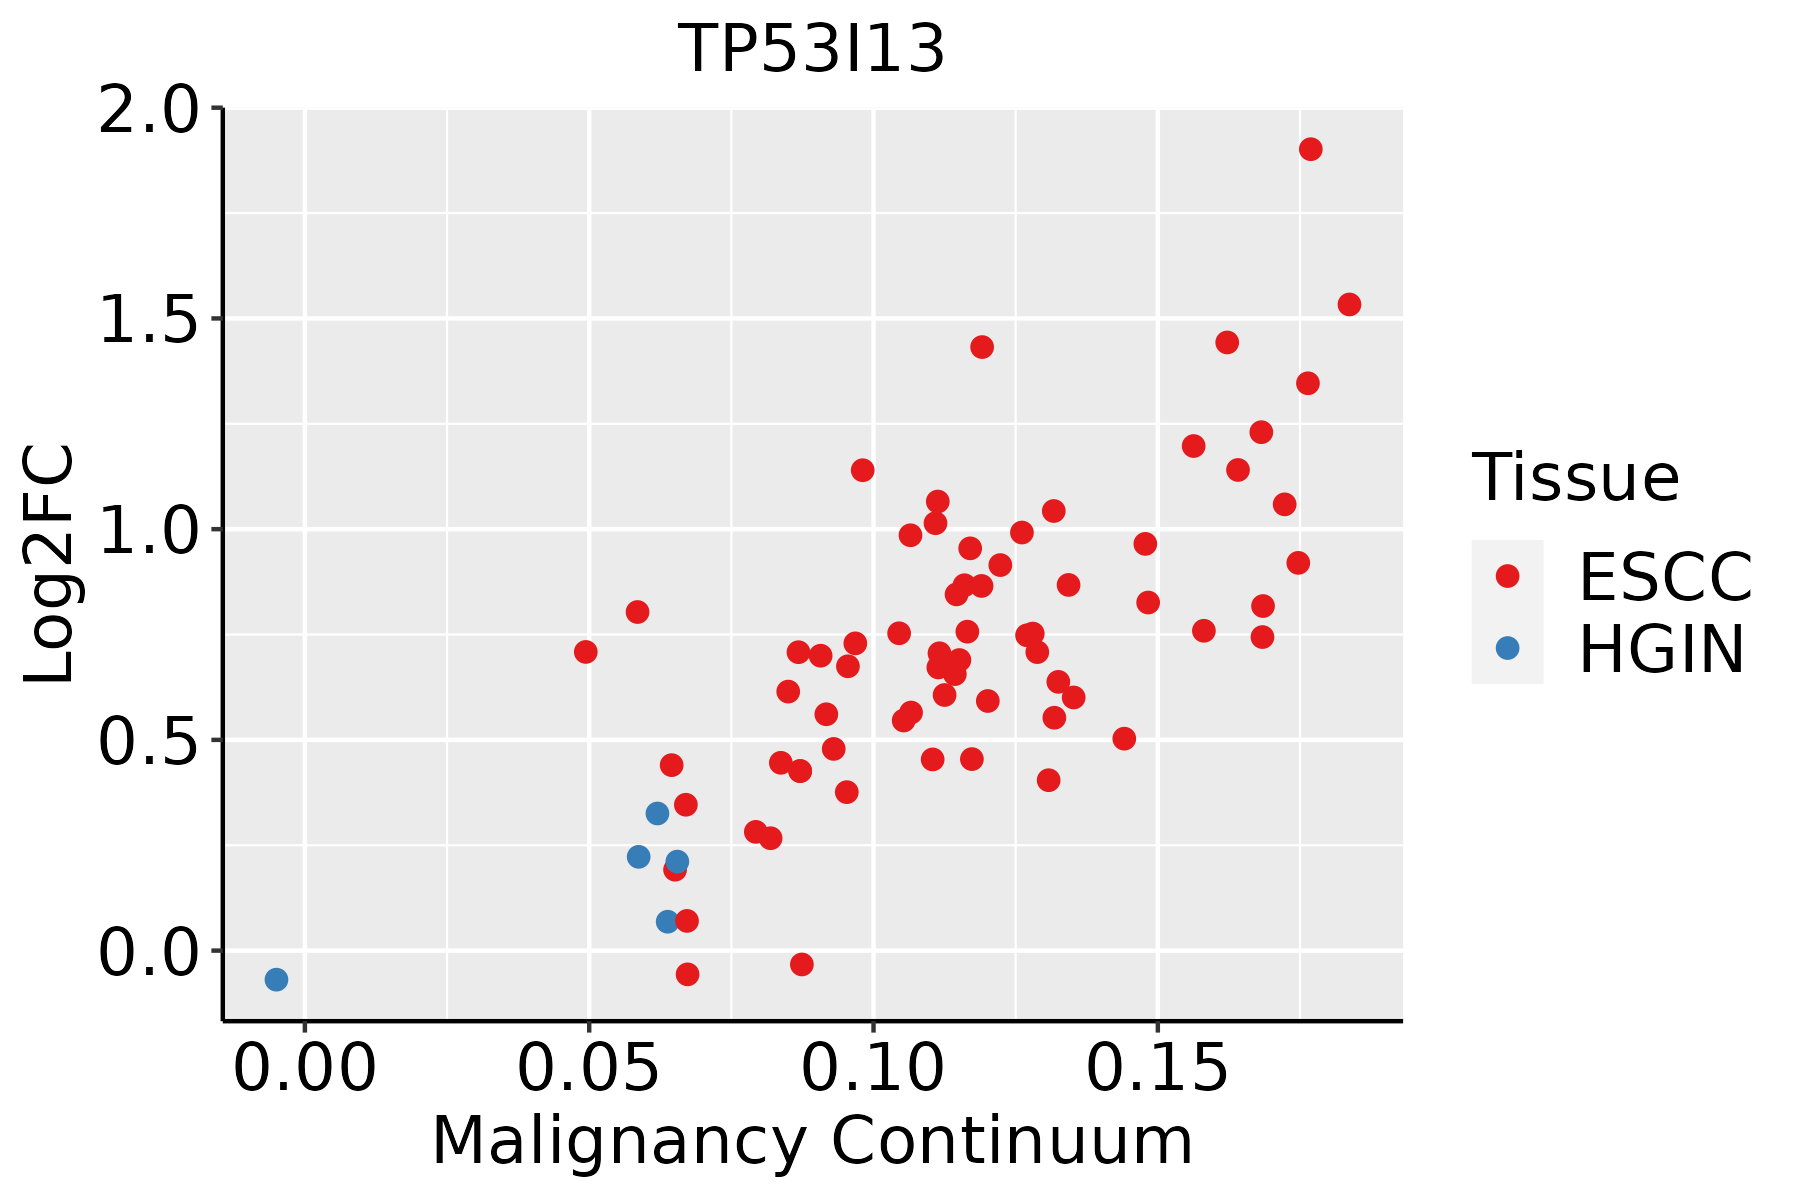 | ESCC: Esophageal squamous cell carcinoma |
| HGIN: High-grade intraepithelial neoplasias | ||
| LGIN: Low-grade intraepithelial neoplasias | ||
| Liver | 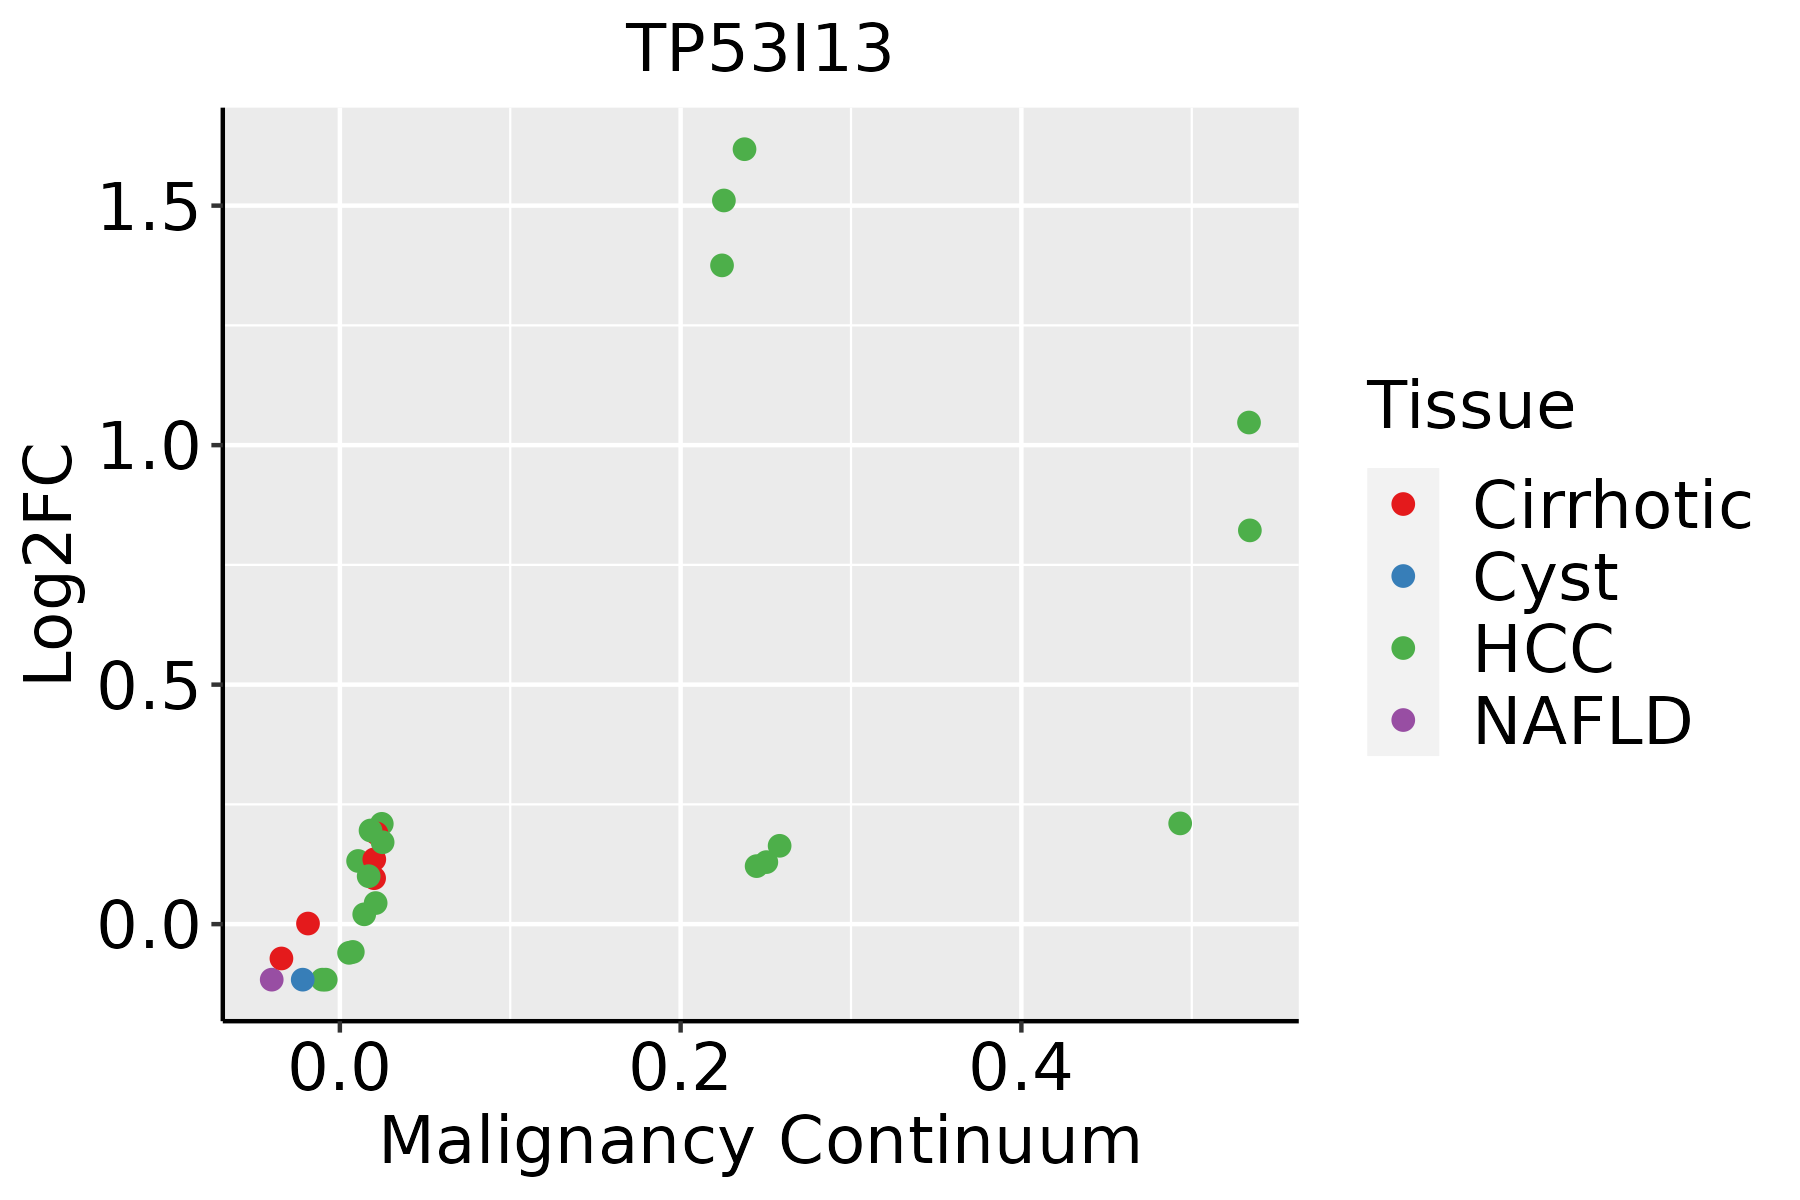 | HCC: Hepatocellular carcinoma |
| NAFLD: Non-alcoholic fatty liver disease | ||
| Oral Cavity |  | EOLP: Erosive Oral lichen planus |
| LP: leukoplakia | ||
| NEOLP: Non-erosive oral lichen planus | ||
| OSCC: Oral squamous cell carcinoma | ||
| Skin | 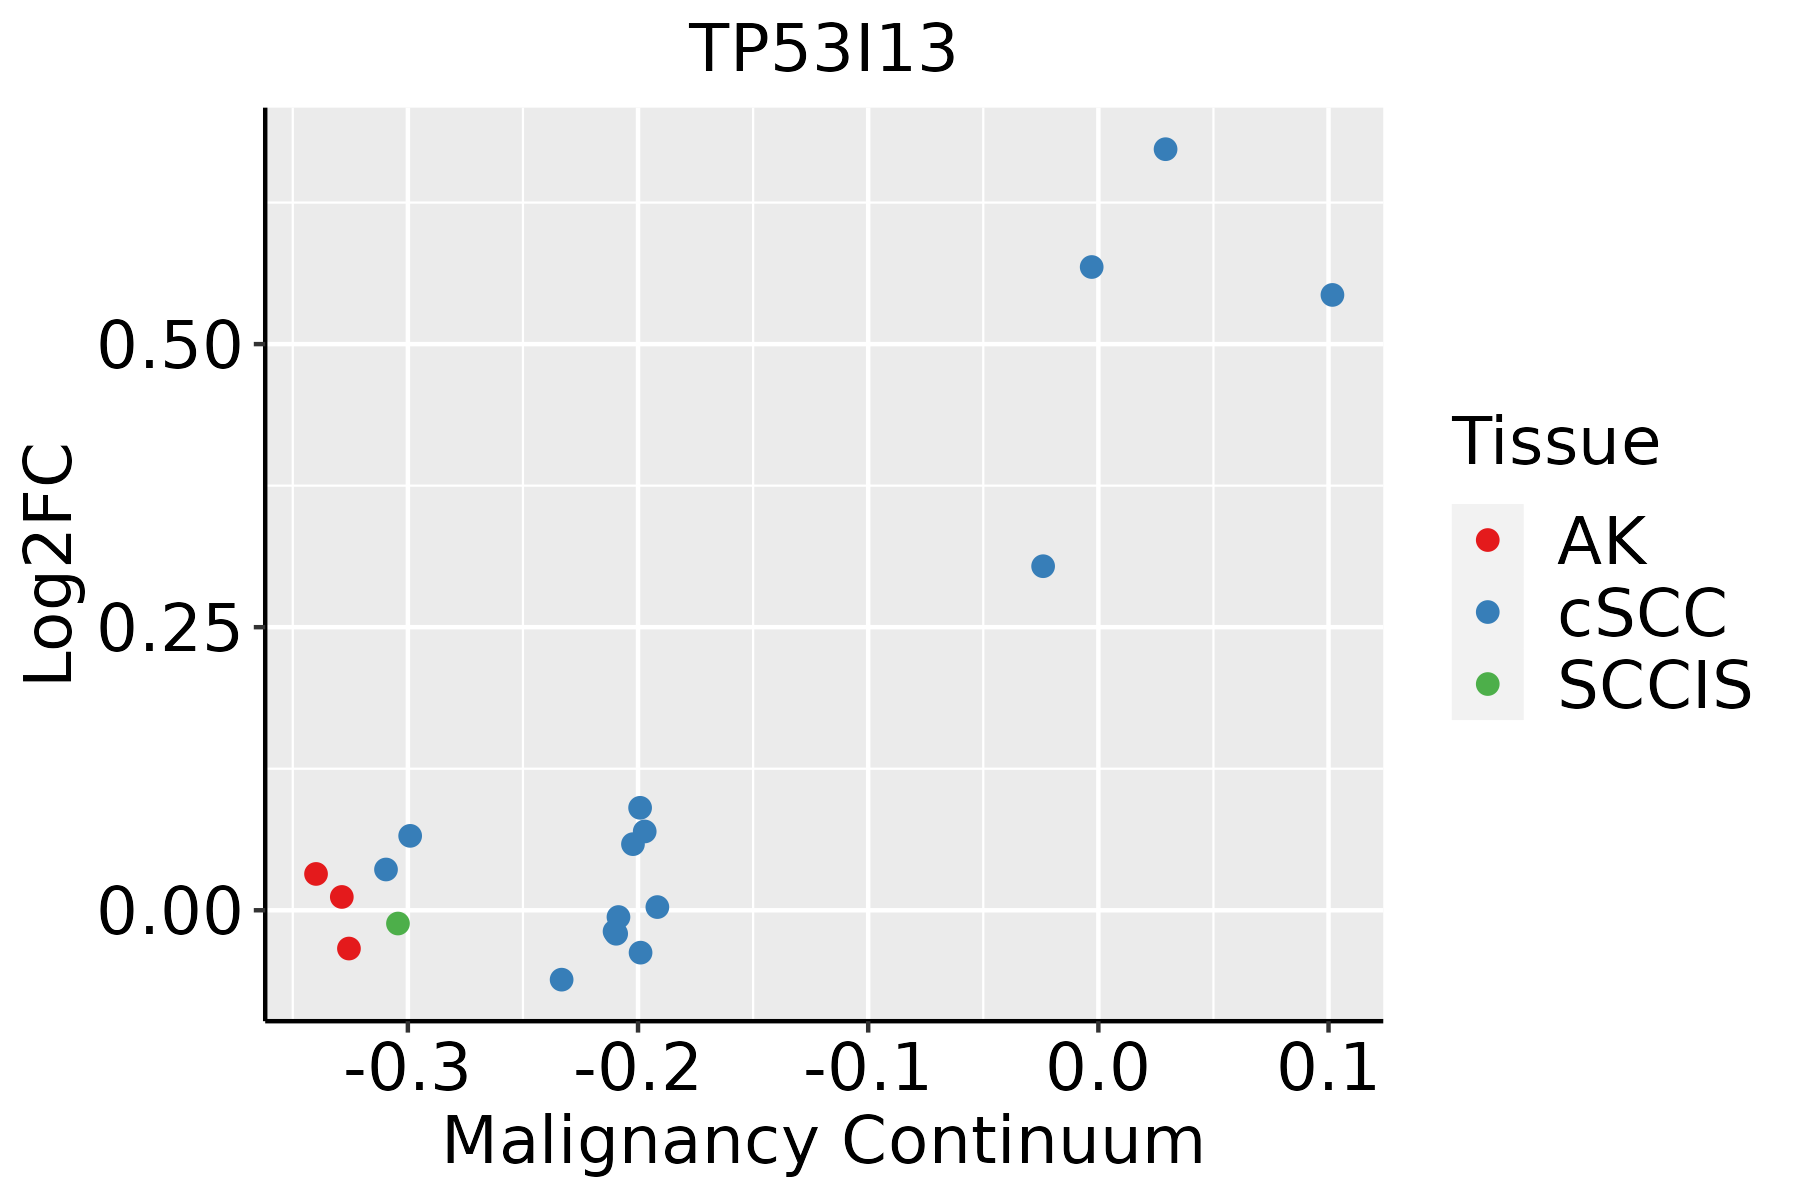 | AK: Actinic keratosis |
| cSCC: Cutaneous squamous cell carcinoma | ||
| SCCIS:squamous cell carcinoma in situ | ||
| Thyroid |  | ATC: Anaplastic thyroid cancer |
| HT: Hashimoto's thyroiditis | ||
| PTC: Papillary thyroid cancer |
| ∗log2FC in expression of this searched gene in stem-like cells from each diseased tissue sample relative to stem-like cells in normal samples in each tissue plotted against the malignancy continuum. Samples are colored based on if they are from different disease stage. |
Top |
Malignant transformation related pathway analysis |
| Find out the enriched GO biological processes and KEGG pathways involved in transition from healthy to precancer to cancer |
| Tissue | Disease Stage | Enriched GO biological Processes |
| Colorectum | AD |  |
| Colorectum | SER |  |
| Colorectum | MSS |  |
| Colorectum | MSI-H |  |
| Colorectum | FAP |  |
| ∗Top 15 enriched GO BP terms are showed in the bar plot of each disease state in each tissue. Each row represents a significant GO biological process which is colored according to the -log10(p.adjust). |
| Page: 1 2 3 4 5 6 7 8 9 |
| GO ID | Tissue | Disease Stage | Description | Gene Ratio | Bg Ratio | pvalue | p.adjust | Count |
| GO:000931418 | Esophagus | HGIN | response to radiation | 88/2587 | 456/18723 | 6.26e-04 | 8.65e-03 | 88 |
| GO:00094115 | Esophagus | HGIN | response to UV | 35/2587 | 149/18723 | 9.71e-04 | 1.22e-02 | 35 |
| GO:00094165 | Esophagus | HGIN | response to light stimulus | 61/2587 | 320/18723 | 5.20e-03 | 4.30e-02 | 61 |
| GO:000941113 | Esophagus | ESCC | response to UV | 115/8552 | 149/18723 | 3.29e-15 | 1.93e-13 | 115 |
| GO:000931419 | Esophagus | ESCC | response to radiation | 277/8552 | 456/18723 | 4.42e-11 | 1.43e-09 | 277 |
| GO:00457865 | Esophagus | ESCC | negative regulation of cell cycle | 236/8552 | 385/18723 | 3.62e-10 | 9.93e-09 | 236 |
| GO:000941611 | Esophagus | ESCC | response to light stimulus | 183/8552 | 320/18723 | 2.03e-05 | 1.76e-04 | 183 |
| GO:0045786 | Liver | HCC | negative regulation of cell cycle | 204/7958 | 385/18723 | 1.84e-05 | 1.99e-04 | 204 |
| GO:0009411 | Liver | HCC | response to UV | 85/7958 | 149/18723 | 2.34e-04 | 1.77e-03 | 85 |
| GO:00093146 | Liver | HCC | response to radiation | 223/7958 | 456/18723 | 3.08e-03 | 1.43e-02 | 223 |
| GO:00094114 | Oral cavity | OSCC | response to UV | 99/7305 | 149/18723 | 1.01e-11 | 3.70e-10 | 99 |
| GO:000931416 | Oral cavity | OSCC | response to radiation | 241/7305 | 456/18723 | 9.76e-10 | 2.40e-08 | 241 |
| GO:00457864 | Oral cavity | OSCC | negative regulation of cell cycle | 206/7305 | 385/18723 | 4.28e-09 | 9.55e-08 | 206 |
| GO:00094164 | Oral cavity | OSCC | response to light stimulus | 159/7305 | 320/18723 | 5.98e-05 | 4.92e-04 | 159 |
| GO:000941112 | Oral cavity | LP | response to UV | 63/4623 | 149/18723 | 1.74e-06 | 4.05e-05 | 63 |
| GO:000931417 | Oral cavity | LP | response to radiation | 155/4623 | 456/18723 | 4.12e-06 | 8.49e-05 | 155 |
| GO:004578612 | Oral cavity | LP | negative regulation of cell cycle | 127/4623 | 385/18723 | 1.33e-04 | 1.53e-03 | 127 |
| GO:000941114 | Skin | cSCC | response to UV | 68/4864 | 149/18723 | 1.62e-07 | 3.62e-06 | 68 |
| GO:000931424 | Skin | cSCC | response to radiation | 166/4864 | 456/18723 | 4.37e-07 | 8.41e-06 | 166 |
| GO:004578613 | Skin | cSCC | negative regulation of cell cycle | 140/4864 | 385/18723 | 3.64e-06 | 5.50e-05 | 140 |
| Page: 1 2 |
| Pathway ID | Tissue | Disease Stage | Description | Gene Ratio | Bg Ratio | pvalue | p.adjust | qvalue | Count |
| Page: 1 |
Top |
Cell-cell communication analysis |
| Identification of potential cell-cell interactions between two cell types and their ligand-receptor pairs for different disease states |
| Ligand | Receptor | LRpair | Pathway | Tissue | Disease Stage |
| Page: 1 |
Top |
Single-cell gene regulatory network inference analysis |
| Find out the significant the regulons (TFs) and the target genes of each regulon across cell types for different disease states |
| TF | Cell Type | Tissue | Disease Stage | Target Gene | RSS | Regulon Activity |
| ∗The dot plots of a searched regulon are shown for all cell subpopulations in each disease state of each tissue based on the regulon specific score inferred using pySCENIC and by calculating the average expression. |
| Page: 1 |
Top |
Somatic mutation of malignant transformation related genes |
| Annotation of somatic variants for genes involved in malignant transformation |
| Hugo Symbol | Variant Class | Variant Classification | dbSNP RS | HGVSc | HGVSp | HGVSp Short | SWISSPROT | BIOTYPE | SIFT | PolyPhen | Tumor Sample Barcode | Tissue | Histology | Sex | Age | Stage | Therapy Types | Drugs | Outcome |
| TP53I13 | SNV | Missense_Mutation | novel | c.596N>G | p.Ser199Cys | p.S199C | Q8NBR0 | protein_coding | deleterious(0.01) | benign(0.321) | TCGA-3C-AALI-01 | Breast | breast invasive carcinoma | Female | <65 | I/II | Unspecific | Poly E | Complete Response |
| TP53I13 | deletion | Frame_Shift_Del | novel | c.546delG | p.Trp182CysfsTer8 | p.W182Cfs*8 | Q8NBR0 | protein_coding | TCGA-EW-A2FV-01 | Breast | breast invasive carcinoma | Female | <65 | III/IV | Chemotherapy | docetaxel | SD | ||
| TP53I13 | SNV | Missense_Mutation | novel | c.721N>A | p.Gly241Ser | p.G241S | Q8NBR0 | protein_coding | tolerated(0.12) | benign(0.005) | TCGA-HM-A4S6-01 | Cervix | cervical & endocervical cancer | Female | <65 | III/IV | Chemotherapy | cisplatin | CR |
| TP53I13 | SNV | Missense_Mutation | rs751335473 | c.497N>A | p.Arg166Gln | p.R166Q | Q8NBR0 | protein_coding | tolerated(0.46) | benign(0.003) | TCGA-VS-A9U7-01 | Cervix | cervical & endocervical cancer | Female | <65 | I/II | Chemotherapy | cisplatin | CR |
| TP53I13 | SNV | Missense_Mutation | novel | c.932N>T | p.Ala311Val | p.A311V | Q8NBR0 | protein_coding | tolerated(0.23) | benign(0.33) | TCGA-AA-A022-01 | Colorectum | colon adenocarcinoma | Female | >=65 | I/II | Unknown | Unknown | SD |
| TP53I13 | SNV | Missense_Mutation | c.917N>A | p.Arg306His | p.R306H | Q8NBR0 | protein_coding | deleterious(0) | probably_damaging(0.999) | TCGA-WS-AB45-01 | Colorectum | colon adenocarcinoma | Female | <65 | I/II | Unknown | Unknown | SD | |
| TP53I13 | SNV | Missense_Mutation | rs751635455 | c.779G>A | p.Gly260Glu | p.G260E | Q8NBR0 | protein_coding | tolerated(0.46) | benign(0.003) | TCGA-AF-A56N-01 | Colorectum | rectum adenocarcinoma | Female | <65 | I/II | Chemotherapy | xeloda | CR |
| TP53I13 | SNV | Missense_Mutation | c.917N>A | p.Arg306His | p.R306H | Q8NBR0 | protein_coding | deleterious(0) | probably_damaging(0.999) | TCGA-EI-6882-01 | Colorectum | rectum adenocarcinoma | Male | <65 | I/II | Unknown | Unknown | SD | |
| TP53I13 | SNV | Missense_Mutation | novel | c.157N>G | p.Thr53Ala | p.T53A | Q8NBR0 | protein_coding | tolerated_low_confidence(0.1) | benign(0.003) | TCGA-A5-A1OF-01 | Endometrium | uterine corpus endometrioid carcinoma | Female | <65 | I/II | Unknown | Unknown | SD |
| TP53I13 | SNV | Missense_Mutation | novel | c.748N>T | p.Pro250Ser | p.P250S | Q8NBR0 | protein_coding | tolerated(0.1) | benign(0.011) | TCGA-AJ-A3EK-01 | Endometrium | uterine corpus endometrioid carcinoma | Female | <65 | I/II | Chemotherapy | carboplatin | CR |
| Page: 1 2 3 |
Top |
Related drugs of malignant transformation related genes |
| Identification of chemicals and drugs interact with genes involved in malignant transfromation |
| (DGIdb 4.0) |
| Entrez ID | Symbol | Category | Interaction Types | Drug Claim Name | Drug Name | PMIDs |
| Page: 1 |

Copyright 2023-Present -The University of Texas Health Science Center at Houston |