
|
|||||
|
 | |
| |
| |
| |
| |
| |
|
Gene: TP53BP2 |
Gene summary for TP53BP2 |
| Gene information | Species | Human | Gene symbol | TP53BP2 | Gene ID | 7159 |
| Gene name | tumor protein p53 binding protein 2 | |
| Gene Alias | 53BP2 | |
| Cytomap | 1q41 | |
| Gene Type | protein-coding | GO ID | GO:0006915 | UniProtAcc | Q13625 |
Top |
Malignant transformation analysis |
| Identification of the aberrant gene expression in precancerous and cancerous lesions by comparing the gene expression of stem-like cells in diseased tissues with normal stem cells |
| Entrez ID | Symbol | Replicates | Species | Organ | Tissue | Adj P-value | Log2FC | Malignancy |
| 7159 | TP53BP2 | LZE4T | Human | Esophagus | ESCC | 5.82e-04 | 1.66e-02 | 0.0811 |
| 7159 | TP53BP2 | LZE7T | Human | Esophagus | ESCC | 4.68e-04 | 3.69e-01 | 0.0667 |
| 7159 | TP53BP2 | LZE8T | Human | Esophagus | ESCC | 5.53e-03 | -1.02e-02 | 0.067 |
| 7159 | TP53BP2 | LZE20T | Human | Esophagus | ESCC | 9.75e-03 | 3.13e-02 | 0.0662 |
| 7159 | TP53BP2 | LZE22T | Human | Esophagus | ESCC | 1.73e-06 | 3.49e-01 | 0.068 |
| 7159 | TP53BP2 | LZE24T | Human | Esophagus | ESCC | 1.59e-17 | 4.11e-01 | 0.0596 |
| 7159 | TP53BP2 | P1T-E | Human | Esophagus | ESCC | 6.25e-10 | 5.84e-01 | 0.0875 |
| 7159 | TP53BP2 | P2T-E | Human | Esophagus | ESCC | 4.45e-30 | 5.61e-01 | 0.1177 |
| 7159 | TP53BP2 | P4T-E | Human | Esophagus | ESCC | 6.83e-10 | 2.15e-01 | 0.1323 |
| 7159 | TP53BP2 | P5T-E | Human | Esophagus | ESCC | 1.66e-13 | 2.21e-01 | 0.1327 |
| 7159 | TP53BP2 | P8T-E | Human | Esophagus | ESCC | 5.07e-17 | 3.07e-01 | 0.0889 |
| 7159 | TP53BP2 | P9T-E | Human | Esophagus | ESCC | 1.28e-10 | 2.64e-01 | 0.1131 |
| 7159 | TP53BP2 | P10T-E | Human | Esophagus | ESCC | 1.76e-17 | 2.03e-01 | 0.116 |
| 7159 | TP53BP2 | P11T-E | Human | Esophagus | ESCC | 2.26e-02 | 3.49e-01 | 0.1426 |
| 7159 | TP53BP2 | P12T-E | Human | Esophagus | ESCC | 3.32e-23 | 1.67e-01 | 0.1122 |
| 7159 | TP53BP2 | P15T-E | Human | Esophagus | ESCC | 1.87e-10 | 2.78e-01 | 0.1149 |
| 7159 | TP53BP2 | P16T-E | Human | Esophagus | ESCC | 1.49e-17 | 2.79e-01 | 0.1153 |
| 7159 | TP53BP2 | P17T-E | Human | Esophagus | ESCC | 1.18e-07 | 1.18e-01 | 0.1278 |
| 7159 | TP53BP2 | P20T-E | Human | Esophagus | ESCC | 7.92e-06 | 1.08e-01 | 0.1124 |
| 7159 | TP53BP2 | P21T-E | Human | Esophagus | ESCC | 7.03e-16 | 1.38e-01 | 0.1617 |
| Page: 1 2 3 4 5 6 7 |
| Tissue | Expression Dynamics | Abbreviation |
| Esophagus |  | ESCC: Esophageal squamous cell carcinoma |
| HGIN: High-grade intraepithelial neoplasias | ||
| LGIN: Low-grade intraepithelial neoplasias | ||
| Liver | 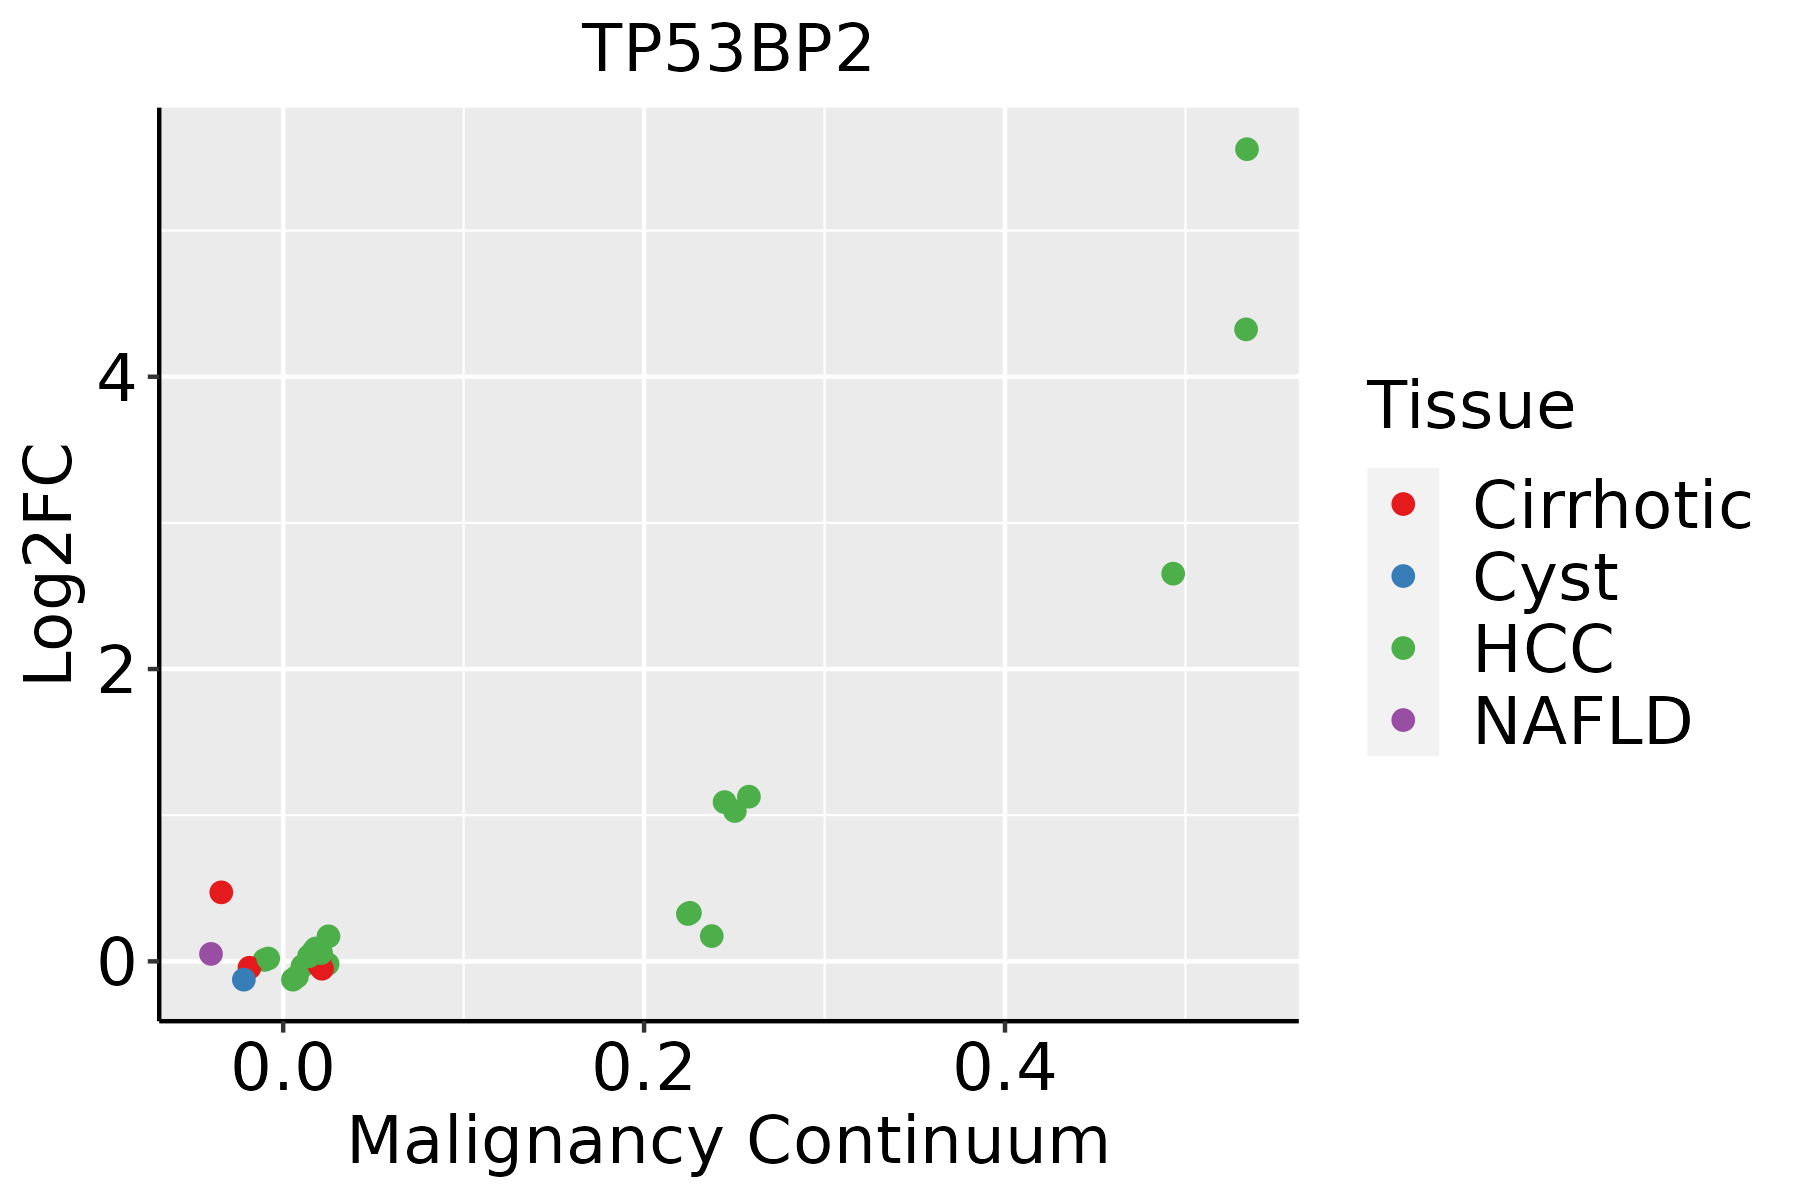 | HCC: Hepatocellular carcinoma |
| NAFLD: Non-alcoholic fatty liver disease | ||
| Lung | 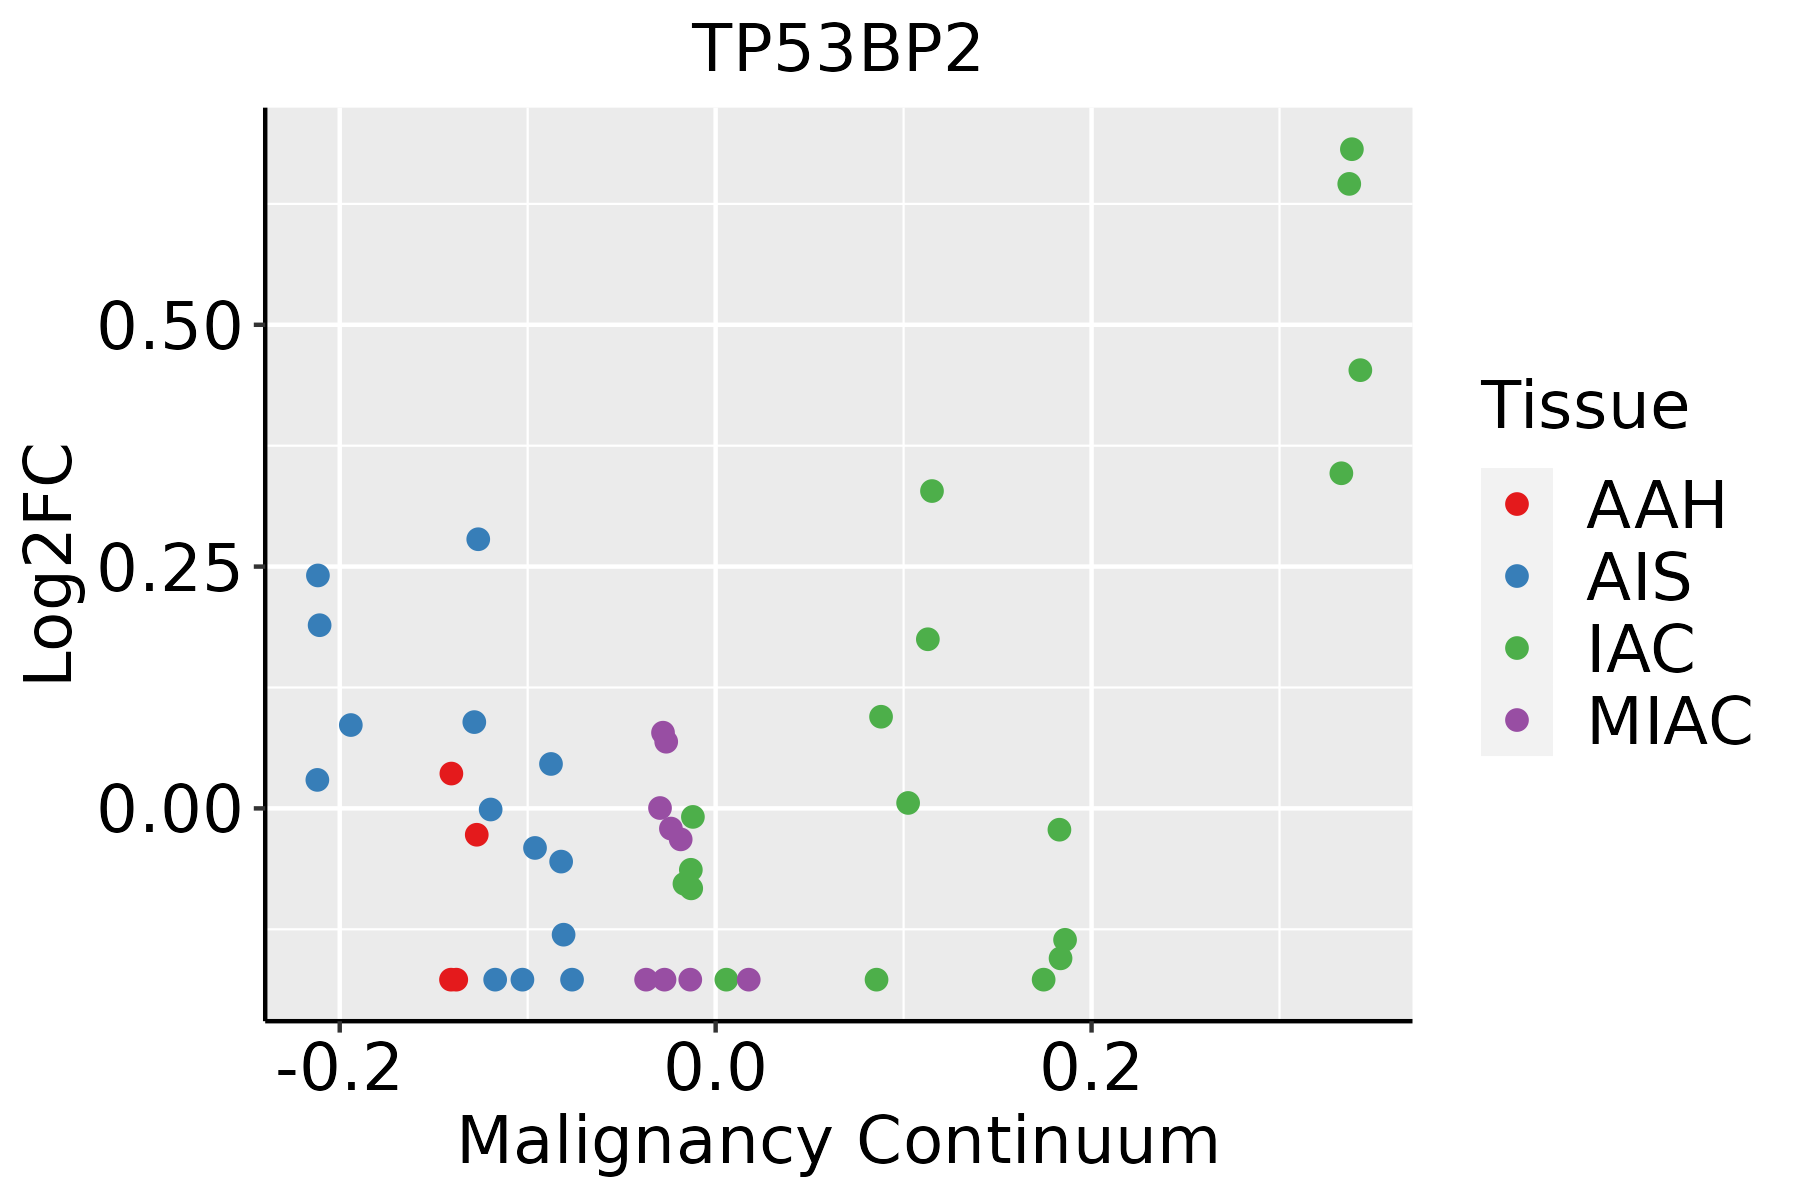 | AAH: Atypical adenomatous hyperplasia |
| AIS: Adenocarcinoma in situ | ||
| IAC: Invasive lung adenocarcinoma | ||
| MIA: Minimally invasive adenocarcinoma | ||
| Oral Cavity | 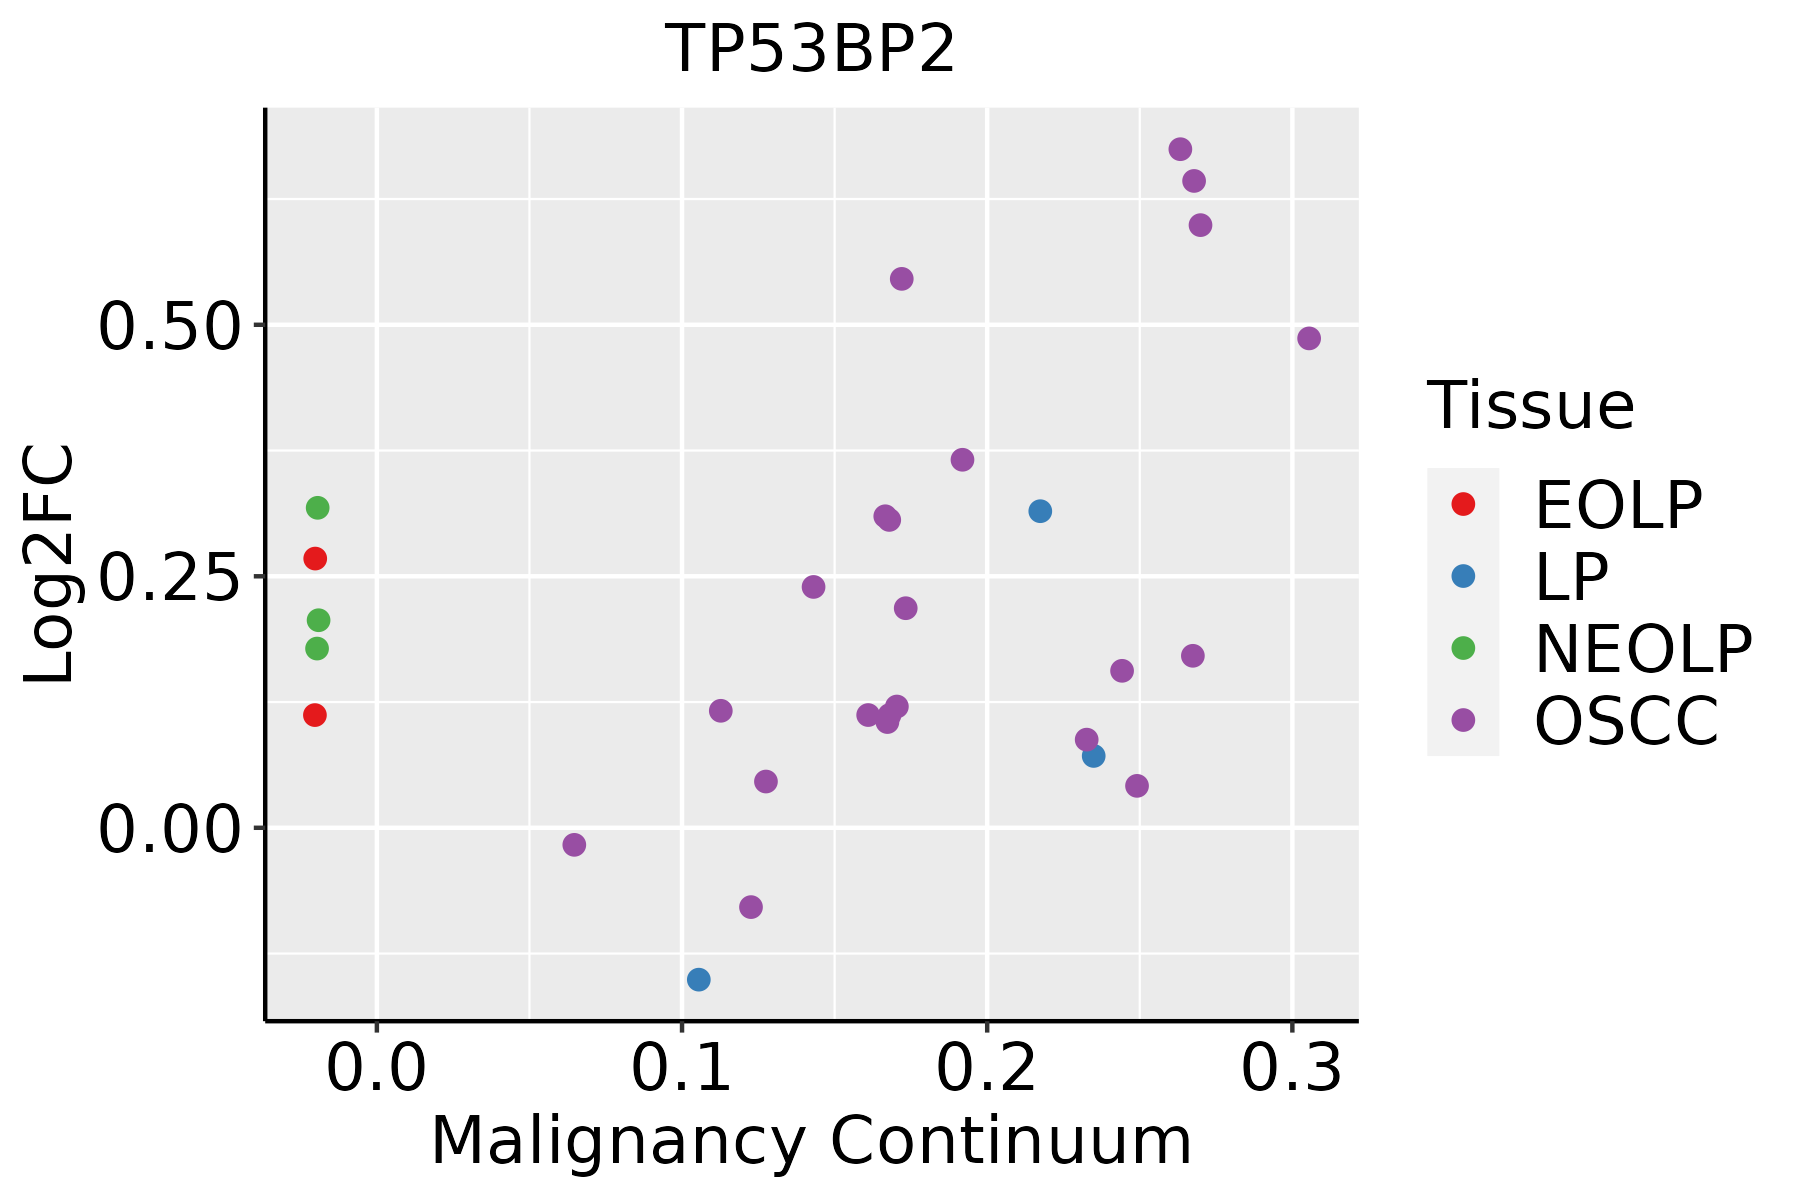 | EOLP: Erosive Oral lichen planus |
| LP: leukoplakia | ||
| NEOLP: Non-erosive oral lichen planus | ||
| OSCC: Oral squamous cell carcinoma | ||
| Prostate |  | BPH: Benign Prostatic Hyperplasia |
| Thyroid |  | ATC: Anaplastic thyroid cancer |
| HT: Hashimoto's thyroiditis | ||
| PTC: Papillary thyroid cancer |
| ∗log2FC in expression of this searched gene in stem-like cells from each diseased tissue sample relative to stem-like cells in normal samples in each tissue plotted against the malignancy continuum. Samples are colored based on if they are from different disease stage. |
Top |
Malignant transformation related pathway analysis |
| Find out the enriched GO biological processes and KEGG pathways involved in transition from healthy to precancer to cancer |
| Tissue | Disease Stage | Enriched GO biological Processes |
| Colorectum | AD |  |
| Colorectum | SER |  |
| Colorectum | MSS |  |
| Colorectum | MSI-H |  |
| Colorectum | FAP |  |
| ∗Top 15 enriched GO BP terms are showed in the bar plot of each disease state in each tissue. Each row represents a significant GO biological process which is colored according to the -log10(p.adjust). |
| Page: 1 2 3 4 5 6 7 8 9 |
| GO ID | Tissue | Disease Stage | Description | Gene Ratio | Bg Ratio | pvalue | p.adjust | Count |
| GO:0097193111 | Esophagus | ESCC | intrinsic apoptotic signaling pathway | 222/8552 | 288/18723 | 5.87e-28 | 2.02e-25 | 222 |
| GO:0072331111 | Esophagus | ESCC | signal transduction by p53 class mediator | 121/8552 | 163/18723 | 9.61e-14 | 4.69e-12 | 121 |
| GO:00457865 | Esophagus | ESCC | negative regulation of cell cycle | 236/8552 | 385/18723 | 3.62e-10 | 9.93e-09 | 236 |
| GO:0072332111 | Esophagus | ESCC | intrinsic apoptotic signaling pathway by p53 class mediator | 59/8552 | 76/18723 | 1.22e-08 | 2.42e-07 | 59 |
| GO:0070997111 | Esophagus | ESCC | neuron death | 216/8552 | 361/18723 | 3.49e-08 | 6.45e-07 | 216 |
| GO:1901214111 | Esophagus | ESCC | regulation of neuron death | 186/8552 | 319/18723 | 3.35e-06 | 3.73e-05 | 186 |
| GO:1901216111 | Esophagus | ESCC | positive regulation of neuron death | 65/8552 | 97/18723 | 1.76e-05 | 1.56e-04 | 65 |
| GO:009719312 | Liver | Cirrhotic | intrinsic apoptotic signaling pathway | 130/4634 | 288/18723 | 2.69e-14 | 2.45e-12 | 130 |
| GO:007099712 | Liver | Cirrhotic | neuron death | 141/4634 | 361/18723 | 9.56e-10 | 4.38e-08 | 141 |
| GO:19012147 | Liver | Cirrhotic | regulation of neuron death | 122/4634 | 319/18723 | 5.17e-08 | 1.62e-06 | 122 |
| GO:007233112 | Liver | Cirrhotic | signal transduction by p53 class mediator | 69/4634 | 163/18723 | 5.97e-07 | 1.30e-05 | 69 |
| GO:00723326 | Liver | Cirrhotic | intrinsic apoptotic signaling pathway by p53 class mediator | 38/4634 | 76/18723 | 1.75e-06 | 3.32e-05 | 38 |
| GO:19012167 | Liver | Cirrhotic | positive regulation of neuron death | 41/4634 | 97/18723 | 1.13e-04 | 1.14e-03 | 41 |
| GO:009719322 | Liver | HCC | intrinsic apoptotic signaling pathway | 184/7958 | 288/18723 | 1.50e-13 | 8.32e-12 | 184 |
| GO:007233122 | Liver | HCC | signal transduction by p53 class mediator | 108/7958 | 163/18723 | 7.14e-10 | 2.23e-08 | 108 |
| GO:007099722 | Liver | HCC | neuron death | 202/7958 | 361/18723 | 1.44e-07 | 2.70e-06 | 202 |
| GO:190121412 | Liver | HCC | regulation of neuron death | 179/7958 | 319/18723 | 5.65e-07 | 9.01e-06 | 179 |
| GO:007233212 | Liver | HCC | intrinsic apoptotic signaling pathway by p53 class mediator | 51/7958 | 76/18723 | 1.27e-05 | 1.42e-04 | 51 |
| GO:190121612 | Liver | HCC | positive regulation of neuron death | 62/7958 | 97/18723 | 1.67e-05 | 1.81e-04 | 62 |
| GO:0045786 | Liver | HCC | negative regulation of cell cycle | 204/7958 | 385/18723 | 1.84e-05 | 1.99e-04 | 204 |
| Page: 1 2 3 4 5 |
| Pathway ID | Tissue | Disease Stage | Description | Gene Ratio | Bg Ratio | pvalue | p.adjust | qvalue | Count |
| hsa0439018 | Esophagus | ESCC | Hippo signaling pathway | 92/4205 | 157/8465 | 1.46e-02 | 3.31e-02 | 1.69e-02 | 92 |
| hsa0439019 | Esophagus | ESCC | Hippo signaling pathway | 92/4205 | 157/8465 | 1.46e-02 | 3.31e-02 | 1.69e-02 | 92 |
| hsa043907 | Lung | IAC | Hippo signaling pathway | 35/1053 | 157/8465 | 3.60e-04 | 3.45e-03 | 2.29e-03 | 35 |
| hsa0439012 | Lung | IAC | Hippo signaling pathway | 35/1053 | 157/8465 | 3.60e-04 | 3.45e-03 | 2.29e-03 | 35 |
| hsa0439022 | Lung | AIS | Hippo signaling pathway | 34/961 | 157/8465 | 1.36e-04 | 1.63e-03 | 1.05e-03 | 34 |
| hsa0439032 | Lung | AIS | Hippo signaling pathway | 34/961 | 157/8465 | 1.36e-04 | 1.63e-03 | 1.05e-03 | 34 |
| hsa0439016 | Oral cavity | OSCC | Hippo signaling pathway | 86/3704 | 157/8465 | 3.30e-03 | 8.24e-03 | 4.20e-03 | 86 |
| hsa0439017 | Oral cavity | OSCC | Hippo signaling pathway | 86/3704 | 157/8465 | 3.30e-03 | 8.24e-03 | 4.20e-03 | 86 |
| hsa0439025 | Oral cavity | NEOLP | Hippo signaling pathway | 35/1112 | 157/8465 | 9.91e-04 | 4.85e-03 | 3.05e-03 | 35 |
| hsa0439035 | Oral cavity | NEOLP | Hippo signaling pathway | 35/1112 | 157/8465 | 9.91e-04 | 4.85e-03 | 3.05e-03 | 35 |
| hsa0439010 | Prostate | BPH | Hippo signaling pathway | 52/1718 | 157/8465 | 9.93e-05 | 6.00e-04 | 3.71e-04 | 52 |
| hsa0439015 | Prostate | BPH | Hippo signaling pathway | 52/1718 | 157/8465 | 9.93e-05 | 6.00e-04 | 3.71e-04 | 52 |
| hsa0439024 | Prostate | Tumor | Hippo signaling pathway | 54/1791 | 157/8465 | 7.52e-05 | 5.30e-04 | 3.28e-04 | 54 |
| hsa0439034 | Prostate | Tumor | Hippo signaling pathway | 54/1791 | 157/8465 | 7.52e-05 | 5.30e-04 | 3.28e-04 | 54 |
| Page: 1 |
Top |
Cell-cell communication analysis |
| Identification of potential cell-cell interactions between two cell types and their ligand-receptor pairs for different disease states |
| Ligand | Receptor | LRpair | Pathway | Tissue | Disease Stage |
| Page: 1 |
Top |
Single-cell gene regulatory network inference analysis |
| Find out the significant the regulons (TFs) and the target genes of each regulon across cell types for different disease states |
| TF | Cell Type | Tissue | Disease Stage | Target Gene | RSS | Regulon Activity |
| ∗The dot plots of a searched regulon are shown for all cell subpopulations in each disease state of each tissue based on the regulon specific score inferred using pySCENIC and by calculating the average expression. |
| Page: 1 |
Top |
Somatic mutation of malignant transformation related genes |
| Annotation of somatic variants for genes involved in malignant transformation |
| Hugo Symbol | Variant Class | Variant Classification | dbSNP RS | HGVSc | HGVSp | HGVSp Short | SWISSPROT | BIOTYPE | SIFT | PolyPhen | Tumor Sample Barcode | Tissue | Histology | Sex | Age | Stage | Therapy Types | Drugs | Outcome |
| TP53BP2 | SNV | Missense_Mutation | rs189590424 | c.2138N>A | p.Ser713Tyr | p.S713Y | Q13625 | protein_coding | tolerated(0.13) | probably_damaging(0.996) | TCGA-A2-A04Y-01 | Breast | breast invasive carcinoma | Female | <65 | I/II | Chemotherapy | cytoxan | SD |
| TP53BP2 | SNV | Missense_Mutation | c.747N>C | p.Glu249Asp | p.E249D | Q13625 | protein_coding | deleterious(0.05) | probably_damaging(0.978) | TCGA-A8-A07I-01 | Breast | breast invasive carcinoma | Female | >=65 | III/IV | Chemotherapy | 5-fluorouracil | CR | |
| TP53BP2 | SNV | Missense_Mutation | c.1153N>G | p.Gln385Glu | p.Q385E | Q13625 | protein_coding | tolerated(0.67) | probably_damaging(0.93) | TCGA-A8-A08R-01 | Breast | breast invasive carcinoma | Female | <65 | I/II | Unknown | Unknown | SD | |
| TP53BP2 | SNV | Missense_Mutation | c.1391C>T | p.Ser464Leu | p.S464L | Q13625 | protein_coding | deleterious(0.01) | probably_damaging(0.991) | TCGA-AC-A23H-01 | Breast | breast invasive carcinoma | Female | >=65 | I/II | Unknown | Unknown | PD | |
| TP53BP2 | SNV | Missense_Mutation | novel | c.221G>A | p.Arg74Gln | p.R74Q | Q13625 | protein_coding | tolerated(0.25) | benign(0.163) | TCGA-AN-A046-01 | Breast | breast invasive carcinoma | Female | >=65 | I/II | Unknown | Unknown | SD |
| TP53BP2 | SNV | Missense_Mutation | c.3279C>G | p.Ile1093Met | p.I1093M | Q13625 | protein_coding | deleterious(0.03) | benign(0.229) | TCGA-AR-A24N-01 | Breast | breast invasive carcinoma | Female | <65 | I/II | Unknown | Unknown | SD | |
| TP53BP2 | SNV | Missense_Mutation | c.808N>A | p.Asp270Asn | p.D270N | Q13625 | protein_coding | tolerated(0.16) | probably_damaging(0.996) | TCGA-D8-A1JA-01 | Breast | breast invasive carcinoma | Female | <65 | III/IV | Chemotherapy | adriamycin | PD | |
| TP53BP2 | SNV | Missense_Mutation | novel | c.1777N>T | p.Pro593Ser | p.P593S | Q13625 | protein_coding | deleterious(0.04) | probably_damaging(0.996) | TCGA-OL-A66I-01 | Breast | breast invasive carcinoma | Female | <65 | I/II | Chemotherapy | adriamycin | CR |
| TP53BP2 | insertion | Nonsense_Mutation | novel | c.858_859insTGGTGAGAAGCTGGGAGGATAAATAAACAAAAATGACTATAA | p.Gln286_Asn287insTrpTerGluAlaGlyArgIleAsnLysGlnLysTerLeuTer | p.Q286_N287insW*EAGRINKQK*L* | Q13625 | protein_coding | TCGA-A7-A0CG-01 | Breast | breast invasive carcinoma | Female | >=65 | I/II | Unknown | Unknown | SD | ||
| TP53BP2 | insertion | Nonsense_Mutation | novel | c.577_578insTCCATTTAATTTCCCCACCCAACTCCTGAACCTTCGAGTAATAACTTTTAT | p.Glu193delinsValHisLeuIleSerProProAsnSerTerThrPheGluTerTerLeuLeuTer | p.E193delinsVHLISPPNS*TFE**LL* | Q13625 | protein_coding | TCGA-A8-A07I-01 | Breast | breast invasive carcinoma | Female | >=65 | III/IV | Chemotherapy | 5-fluorouracil | CR |
| Page: 1 2 3 4 5 6 7 8 9 10 11 12 13 |
Top |
Related drugs of malignant transformation related genes |
| Identification of chemicals and drugs interact with genes involved in malignant transfromation |
| (DGIdb 4.0) |
| Entrez ID | Symbol | Category | Interaction Types | Drug Claim Name | Drug Name | PMIDs |
| Page: 1 |

Copyright 2023-Present -The University of Texas Health Science Center at Houston |