
|
|||||
|
 | |
| |
| |
| |
| |
| |
|
Gene: TP53BP1 |
Gene summary for TP53BP1 |
| Gene information | Species | Human | Gene symbol | TP53BP1 | Gene ID | 7158 |
| Gene name | tumor protein p53 binding protein 1 | |
| Gene Alias | 53BP1 | |
| Cytomap | 15q15.3 | |
| Gene Type | protein-coding | GO ID | GO:0000018 | UniProtAcc | Q12888 |
Top |
Malignant transformation analysis |
| Identification of the aberrant gene expression in precancerous and cancerous lesions by comparing the gene expression of stem-like cells in diseased tissues with normal stem cells |
| Entrez ID | Symbol | Replicates | Species | Organ | Tissue | Adj P-value | Log2FC | Malignancy |
| 7158 | TP53BP1 | LZE4T | Human | Esophagus | ESCC | 4.95e-14 | 4.92e-01 | 0.0811 |
| 7158 | TP53BP1 | LZE7T | Human | Esophagus | ESCC | 5.15e-06 | 3.92e-01 | 0.0667 |
| 7158 | TP53BP1 | LZE8T | Human | Esophagus | ESCC | 2.71e-04 | 1.40e-01 | 0.067 |
| 7158 | TP53BP1 | LZE24T | Human | Esophagus | ESCC | 4.58e-13 | 2.20e-01 | 0.0596 |
| 7158 | TP53BP1 | LZE21T | Human | Esophagus | ESCC | 7.72e-05 | 2.15e-01 | 0.0655 |
| 7158 | TP53BP1 | P1T-E | Human | Esophagus | ESCC | 1.38e-10 | 4.71e-01 | 0.0875 |
| 7158 | TP53BP1 | P2T-E | Human | Esophagus | ESCC | 3.65e-17 | 3.11e-01 | 0.1177 |
| 7158 | TP53BP1 | P4T-E | Human | Esophagus | ESCC | 1.58e-18 | 4.10e-01 | 0.1323 |
| 7158 | TP53BP1 | P5T-E | Human | Esophagus | ESCC | 4.30e-16 | 1.74e-01 | 0.1327 |
| 7158 | TP53BP1 | P8T-E | Human | Esophagus | ESCC | 1.36e-34 | 5.13e-01 | 0.0889 |
| 7158 | TP53BP1 | P9T-E | Human | Esophagus | ESCC | 1.55e-17 | 4.19e-01 | 0.1131 |
| 7158 | TP53BP1 | P10T-E | Human | Esophagus | ESCC | 7.04e-32 | 5.69e-01 | 0.116 |
| 7158 | TP53BP1 | P11T-E | Human | Esophagus | ESCC | 1.41e-12 | 3.63e-01 | 0.1426 |
| 7158 | TP53BP1 | P12T-E | Human | Esophagus | ESCC | 2.28e-21 | 4.23e-01 | 0.1122 |
| 7158 | TP53BP1 | P15T-E | Human | Esophagus | ESCC | 3.11e-26 | 6.23e-01 | 0.1149 |
| 7158 | TP53BP1 | P16T-E | Human | Esophagus | ESCC | 1.01e-26 | 4.64e-01 | 0.1153 |
| 7158 | TP53BP1 | P17T-E | Human | Esophagus | ESCC | 1.63e-06 | 2.46e-01 | 0.1278 |
| 7158 | TP53BP1 | P19T-E | Human | Esophagus | ESCC | 2.47e-03 | 3.66e-01 | 0.1662 |
| 7158 | TP53BP1 | P20T-E | Human | Esophagus | ESCC | 2.87e-06 | 1.82e-01 | 0.1124 |
| 7158 | TP53BP1 | P21T-E | Human | Esophagus | ESCC | 1.75e-11 | 2.15e-01 | 0.1617 |
| Page: 1 2 3 4 5 |
| Tissue | Expression Dynamics | Abbreviation |
| Esophagus |  | ESCC: Esophageal squamous cell carcinoma |
| HGIN: High-grade intraepithelial neoplasias | ||
| LGIN: Low-grade intraepithelial neoplasias | ||
| Liver | 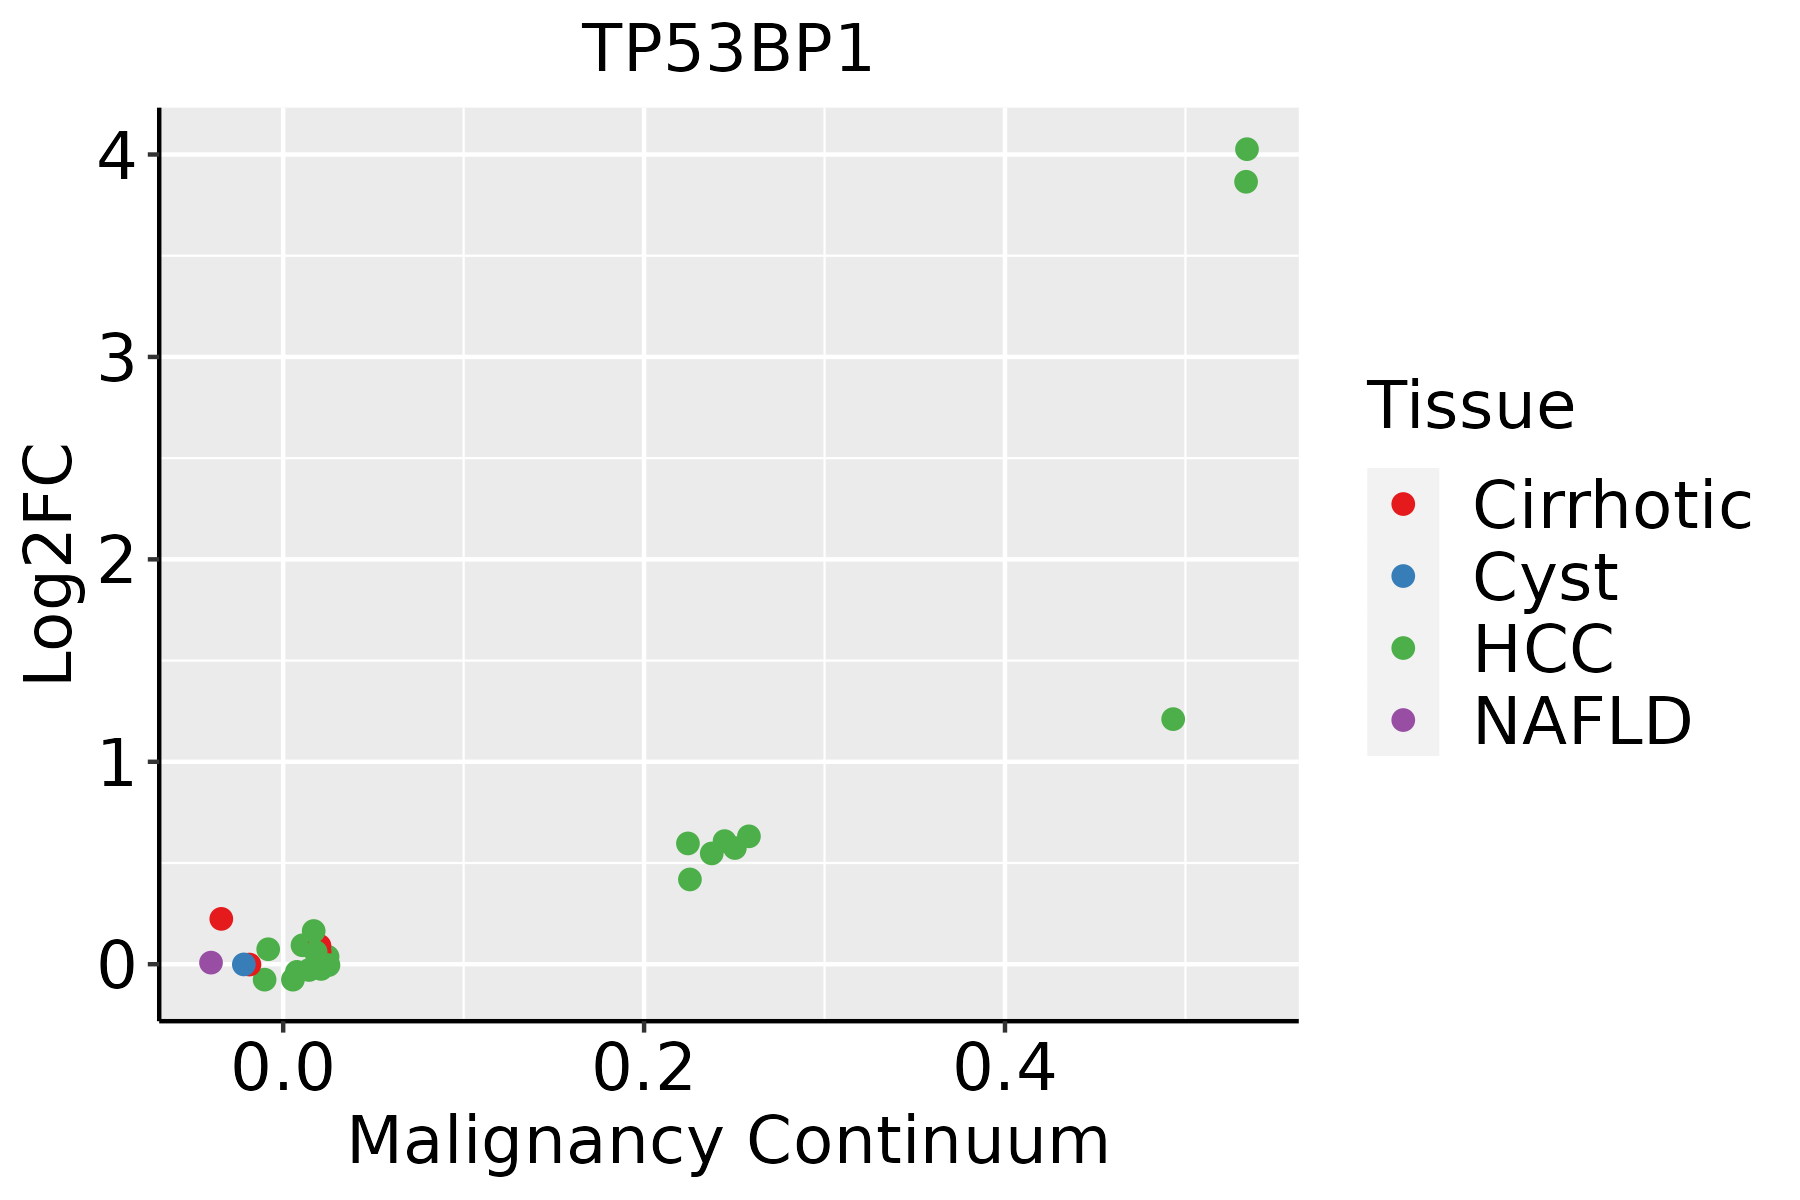 | HCC: Hepatocellular carcinoma |
| NAFLD: Non-alcoholic fatty liver disease | ||
| Lung | 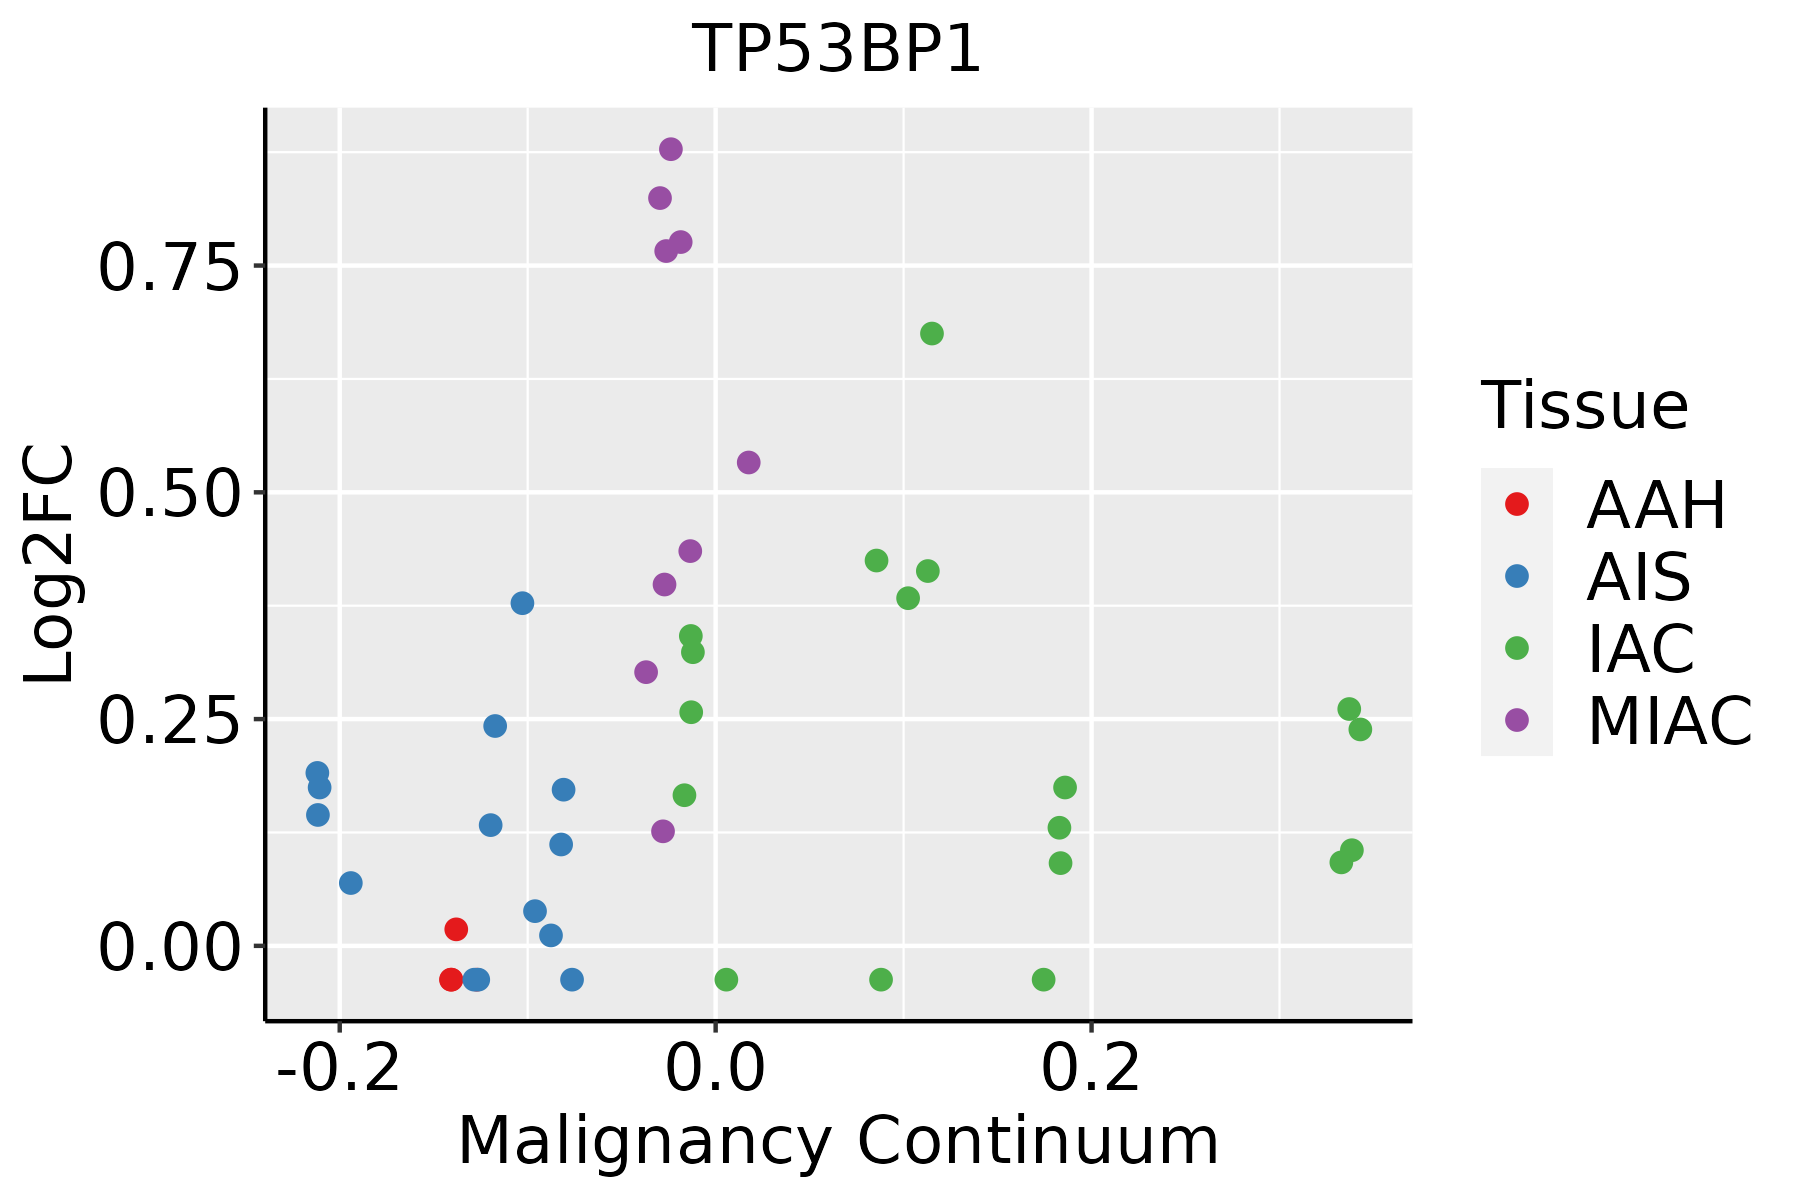 | AAH: Atypical adenomatous hyperplasia |
| AIS: Adenocarcinoma in situ | ||
| IAC: Invasive lung adenocarcinoma | ||
| MIA: Minimally invasive adenocarcinoma | ||
| Thyroid | 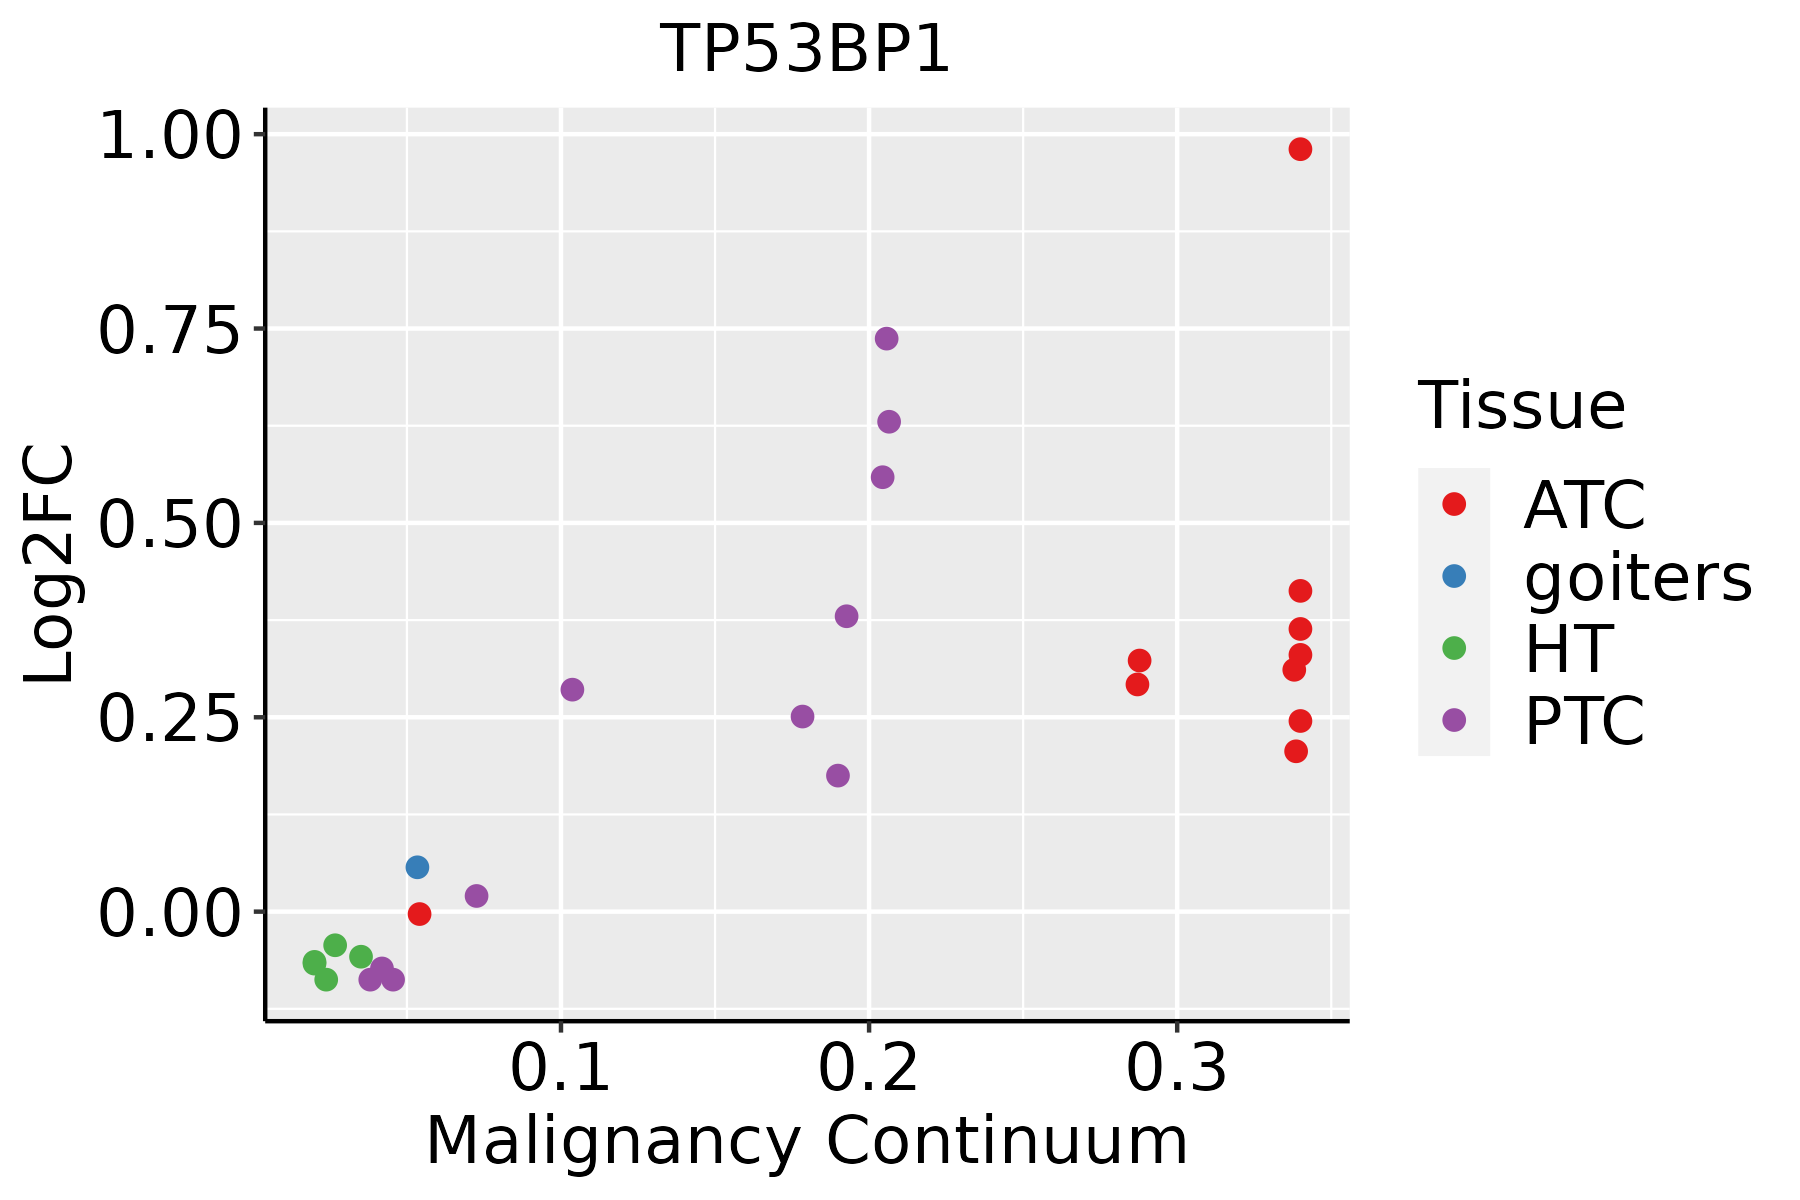 | ATC: Anaplastic thyroid cancer |
| HT: Hashimoto's thyroiditis | ||
| PTC: Papillary thyroid cancer |
| ∗log2FC in expression of this searched gene in stem-like cells from each diseased tissue sample relative to stem-like cells in normal samples in each tissue plotted against the malignancy continuum. Samples are colored based on if they are from different disease stage. |
Top |
Malignant transformation related pathway analysis |
| Find out the enriched GO biological processes and KEGG pathways involved in transition from healthy to precancer to cancer |
| Tissue | Disease Stage | Enriched GO biological Processes |
| Colorectum | AD |  |
| Colorectum | SER |  |
| Colorectum | MSS |  |
| Colorectum | MSI-H |  |
| Colorectum | FAP |  |
| ∗Top 15 enriched GO BP terms are showed in the bar plot of each disease state in each tissue. Each row represents a significant GO biological process which is colored according to the -log10(p.adjust). |
| Page: 1 2 3 4 5 6 7 8 9 |
| GO ID | Tissue | Disease Stage | Description | Gene Ratio | Bg Ratio | pvalue | p.adjust | Count |
| GO:005105215 | Esophagus | ESCC | regulation of DNA metabolic process | 232/8552 | 359/18723 | 2.40e-13 | 1.13e-11 | 232 |
| GO:001021217 | Esophagus | ESCC | response to ionizing radiation | 110/8552 | 148/18723 | 1.11e-12 | 4.78e-11 | 110 |
| GO:005105417 | Esophagus | ESCC | positive regulation of DNA metabolic process | 139/8552 | 201/18723 | 1.20e-11 | 4.33e-10 | 139 |
| GO:190198713 | Esophagus | ESCC | regulation of cell cycle phase transition | 242/8552 | 390/18723 | 3.86e-11 | 1.26e-09 | 242 |
| GO:000931419 | Esophagus | ESCC | response to radiation | 277/8552 | 456/18723 | 4.42e-11 | 1.43e-09 | 277 |
| GO:00457865 | Esophagus | ESCC | negative regulation of cell cycle | 236/8552 | 385/18723 | 3.62e-10 | 9.93e-09 | 236 |
| GO:00000754 | Esophagus | ESCC | cell cycle checkpoint | 117/8552 | 169/18723 | 4.47e-10 | 1.17e-08 | 117 |
| GO:2001020110 | Esophagus | ESCC | regulation of response to DNA damage stimulus | 145/8552 | 219/18723 | 5.97e-10 | 1.50e-08 | 145 |
| GO:007121419 | Esophagus | ESCC | cellular response to abiotic stimulus | 206/8552 | 331/18723 | 7.52e-10 | 1.88e-08 | 206 |
| GO:010400419 | Esophagus | ESCC | cellular response to environmental stimulus | 206/8552 | 331/18723 | 7.52e-10 | 1.88e-08 | 206 |
| GO:004277014 | Esophagus | ESCC | signal transduction in response to DNA damage | 117/8552 | 172/18723 | 2.38e-09 | 5.32e-08 | 117 |
| GO:007147816 | Esophagus | ESCC | cellular response to radiation | 122/8552 | 186/18723 | 3.07e-08 | 5.73e-07 | 122 |
| GO:00109484 | Esophagus | ESCC | negative regulation of cell cycle process | 177/8552 | 294/18723 | 3.26e-07 | 4.59e-06 | 177 |
| GO:0071479110 | Esophagus | ESCC | cellular response to ionizing radiation | 54/8552 | 72/18723 | 3.85e-07 | 5.32e-06 | 54 |
| GO:00510908 | Esophagus | ESCC | regulation of DNA-binding transcription factor activity | 252/8552 | 440/18723 | 5.22e-07 | 6.97e-06 | 252 |
| GO:00315705 | Esophagus | ESCC | DNA integrity checkpoint | 83/8552 | 123/18723 | 8.17e-07 | 1.06e-05 | 83 |
| GO:00000775 | Esophagus | ESCC | DNA damage checkpoint | 78/8552 | 115/18723 | 1.27e-06 | 1.56e-05 | 78 |
| GO:19019883 | Esophagus | ESCC | negative regulation of cell cycle phase transition | 151/8552 | 249/18723 | 1.28e-06 | 1.57e-05 | 151 |
| GO:00063024 | Esophagus | ESCC | double-strand break repair | 152/8552 | 251/18723 | 1.33e-06 | 1.62e-05 | 152 |
| GO:00510918 | Esophagus | ESCC | positive regulation of DNA-binding transcription factor activity | 155/8552 | 260/18723 | 3.83e-06 | 4.14e-05 | 155 |
| Page: 1 2 3 4 5 6 7 8 |
| Pathway ID | Tissue | Disease Stage | Description | Gene Ratio | Bg Ratio | pvalue | p.adjust | qvalue | Count |
| hsa0462122 | Esophagus | ESCC | NOD-like receptor signaling pathway | 116/4205 | 186/8465 | 2.90e-04 | 1.03e-03 | 5.30e-04 | 116 |
| hsa0462132 | Esophagus | ESCC | NOD-like receptor signaling pathway | 116/4205 | 186/8465 | 2.90e-04 | 1.03e-03 | 5.30e-04 | 116 |
| Page: 1 |
Top |
Cell-cell communication analysis |
| Identification of potential cell-cell interactions between two cell types and their ligand-receptor pairs for different disease states |
| Ligand | Receptor | LRpair | Pathway | Tissue | Disease Stage |
| Page: 1 |
Top |
Single-cell gene regulatory network inference analysis |
| Find out the significant the regulons (TFs) and the target genes of each regulon across cell types for different disease states |
| TF | Cell Type | Tissue | Disease Stage | Target Gene | RSS | Regulon Activity |
| ∗The dot plots of a searched regulon are shown for all cell subpopulations in each disease state of each tissue based on the regulon specific score inferred using pySCENIC and by calculating the average expression. |
| Page: 1 |
Top |
Somatic mutation of malignant transformation related genes |
| Annotation of somatic variants for genes involved in malignant transformation |
| Hugo Symbol | Variant Class | Variant Classification | dbSNP RS | HGVSc | HGVSp | HGVSp Short | SWISSPROT | BIOTYPE | SIFT | PolyPhen | Tumor Sample Barcode | Tissue | Histology | Sex | Age | Stage | Therapy Types | Drugs | Outcome |
| TP53BP1 | SNV | Missense_Mutation | rs368299457 | c.2522N>A | p.Pro841His | p.P841H | Q12888 | protein_coding | deleterious_low_confidence(0.04) | possibly_damaging(0.808) | TCGA-A2-A3XT-01 | Breast | breast invasive carcinoma | Female | <65 | I/II | Chemotherapy | cyclophosphamide | PR |
| TP53BP1 | SNV | Missense_Mutation | novel | c.631N>T | p.Arg211Trp | p.R211W | Q12888 | protein_coding | deleterious(0.01) | possibly_damaging(0.634) | TCGA-A2-A4S1-01 | Breast | breast invasive carcinoma | Female | >=65 | I/II | Unknown | Unknown | SD |
| TP53BP1 | SNV | Missense_Mutation | c.3498G>C | p.Leu1166Phe | p.L1166F | Q12888 | protein_coding | tolerated(0.18) | possibly_damaging(0.624) | TCGA-A8-A095-01 | Breast | breast invasive carcinoma | Female | <65 | I/II | Chemotherapy | 5-fluorouracil | CR | |
| TP53BP1 | SNV | Missense_Mutation | rs45443496 | c.1957A>G | p.Met653Val | p.M653V | Q12888 | protein_coding | tolerated(0.13) | benign(0.003) | TCGA-A8-A09Z-01 | Breast | breast invasive carcinoma | Female | >=65 | I/II | Unknown | Unknown | SD |
| TP53BP1 | SNV | Missense_Mutation | c.5009C>T | p.Ser1670Leu | p.S1670L | Q12888 | protein_coding | deleterious(0) | benign(0.053) | TCGA-AC-A23H-01 | Breast | breast invasive carcinoma | Female | >=65 | I/II | Unknown | Unknown | PD | |
| TP53BP1 | SNV | Missense_Mutation | c.4732G>C | p.Glu1578Gln | p.E1578Q | Q12888 | protein_coding | deleterious(0) | probably_damaging(0.998) | TCGA-AC-A23H-01 | Breast | breast invasive carcinoma | Female | >=65 | I/II | Unknown | Unknown | PD | |
| TP53BP1 | SNV | Missense_Mutation | c.2200C>G | p.Gln734Glu | p.Q734E | Q12888 | protein_coding | tolerated_low_confidence(0.18) | benign(0.047) | TCGA-AC-A23H-01 | Breast | breast invasive carcinoma | Female | >=65 | I/II | Unknown | Unknown | PD | |
| TP53BP1 | SNV | Missense_Mutation | c.5363N>C | p.Gly1788Ala | p.G1788A | Q12888 | protein_coding | deleterious(0) | probably_damaging(0.979) | TCGA-AC-A2B8-01 | Breast | breast invasive carcinoma | Female | >=65 | I/II | Chemotherapy | chemo | PD | |
| TP53BP1 | SNV | Missense_Mutation | c.5018G>T | p.Arg1673Ile | p.R1673I | Q12888 | protein_coding | deleterious(0) | probably_damaging(0.999) | TCGA-AN-A046-01 | Breast | breast invasive carcinoma | Female | >=65 | I/II | Unknown | Unknown | SD | |
| TP53BP1 | SNV | Missense_Mutation | c.4865N>G | p.Ile1622Ser | p.I1622S | Q12888 | protein_coding | deleterious(0) | probably_damaging(0.998) | TCGA-AO-A03O-01 | Breast | breast invasive carcinoma | Female | >=65 | I/II | Chemotherapy | doxorubicin | SD |
| Page: 1 2 3 4 5 6 7 8 9 10 11 12 13 14 15 16 17 |
Top |
Related drugs of malignant transformation related genes |
| Identification of chemicals and drugs interact with genes involved in malignant transfromation |
| (DGIdb 4.0) |
| Entrez ID | Symbol | Category | Interaction Types | Drug Claim Name | Drug Name | PMIDs |
| Page: 1 |

Copyright 2023-Present -The University of Texas Health Science Center at Houston |