
|
|||||
|
 | |
| |
| |
| |
| |
| |
|
Gene: TP53AIP1 |
Gene summary for TP53AIP1 |
| Gene information | Species | Human | Gene symbol | TP53AIP1 | Gene ID | 63970 |
| Gene name | tumor protein p53 regulated apoptosis inducing protein 1 | |
| Gene Alias | P53AIP1 | |
| Cytomap | 11q24.3 | |
| Gene Type | protein-coding | GO ID | GO:0006915 | UniProtAcc | Q9HCN2 |
Top |
Malignant transformation analysis |
| Identification of the aberrant gene expression in precancerous and cancerous lesions by comparing the gene expression of stem-like cells in diseased tissues with normal stem cells |
| Entrez ID | Symbol | Replicates | Species | Organ | Tissue | Adj P-value | Log2FC | Malignancy |
| 63970 | TP53AIP1 | LZE4T | Human | Esophagus | ESCC | 9.50e-06 | 4.41e-01 | 0.0811 |
| 63970 | TP53AIP1 | P2T-E | Human | Esophagus | ESCC | 1.09e-14 | 3.20e-01 | 0.1177 |
| 63970 | TP53AIP1 | P4T-E | Human | Esophagus | ESCC | 2.56e-36 | 1.34e+00 | 0.1323 |
| 63970 | TP53AIP1 | P5T-E | Human | Esophagus | ESCC | 1.11e-04 | -9.08e-02 | 0.1327 |
| 63970 | TP53AIP1 | P8T-E | Human | Esophagus | ESCC | 1.05e-04 | -1.82e-01 | 0.0889 |
| 63970 | TP53AIP1 | P10T-E | Human | Esophagus | ESCC | 6.52e-30 | 6.24e-01 | 0.116 |
| 63970 | TP53AIP1 | P11T-E | Human | Esophagus | ESCC | 1.09e-07 | 8.97e-01 | 0.1426 |
| 63970 | TP53AIP1 | P12T-E | Human | Esophagus | ESCC | 6.09e-07 | -6.56e-02 | 0.1122 |
| 63970 | TP53AIP1 | P15T-E | Human | Esophagus | ESCC | 6.02e-07 | 2.37e-01 | 0.1149 |
| 63970 | TP53AIP1 | P16T-E | Human | Esophagus | ESCC | 3.63e-02 | -1.78e-01 | 0.1153 |
| 63970 | TP53AIP1 | P20T-E | Human | Esophagus | ESCC | 1.89e-42 | 1.08e+00 | 0.1124 |
| 63970 | TP53AIP1 | P21T-E | Human | Esophagus | ESCC | 1.96e-60 | 1.65e+00 | 0.1617 |
| 63970 | TP53AIP1 | P22T-E | Human | Esophagus | ESCC | 6.32e-49 | 9.71e-01 | 0.1236 |
| 63970 | TP53AIP1 | P26T-E | Human | Esophagus | ESCC | 9.75e-12 | 4.76e-01 | 0.1276 |
| 63970 | TP53AIP1 | P27T-E | Human | Esophagus | ESCC | 2.28e-53 | 1.16e+00 | 0.1055 |
| 63970 | TP53AIP1 | P30T-E | Human | Esophagus | ESCC | 2.08e-08 | 6.34e-01 | 0.137 |
| 63970 | TP53AIP1 | P31T-E | Human | Esophagus | ESCC | 4.49e-13 | 4.05e-01 | 0.1251 |
| 63970 | TP53AIP1 | P32T-E | Human | Esophagus | ESCC | 3.91e-02 | 2.18e-02 | 0.1666 |
| 63970 | TP53AIP1 | P37T-E | Human | Esophagus | ESCC | 1.22e-05 | 2.31e-01 | 0.1371 |
| 63970 | TP53AIP1 | P39T-E | Human | Esophagus | ESCC | 2.89e-03 | -1.84e-01 | 0.0894 |
| Page: 1 2 3 4 |
| Tissue | Expression Dynamics | Abbreviation |
| Esophagus | 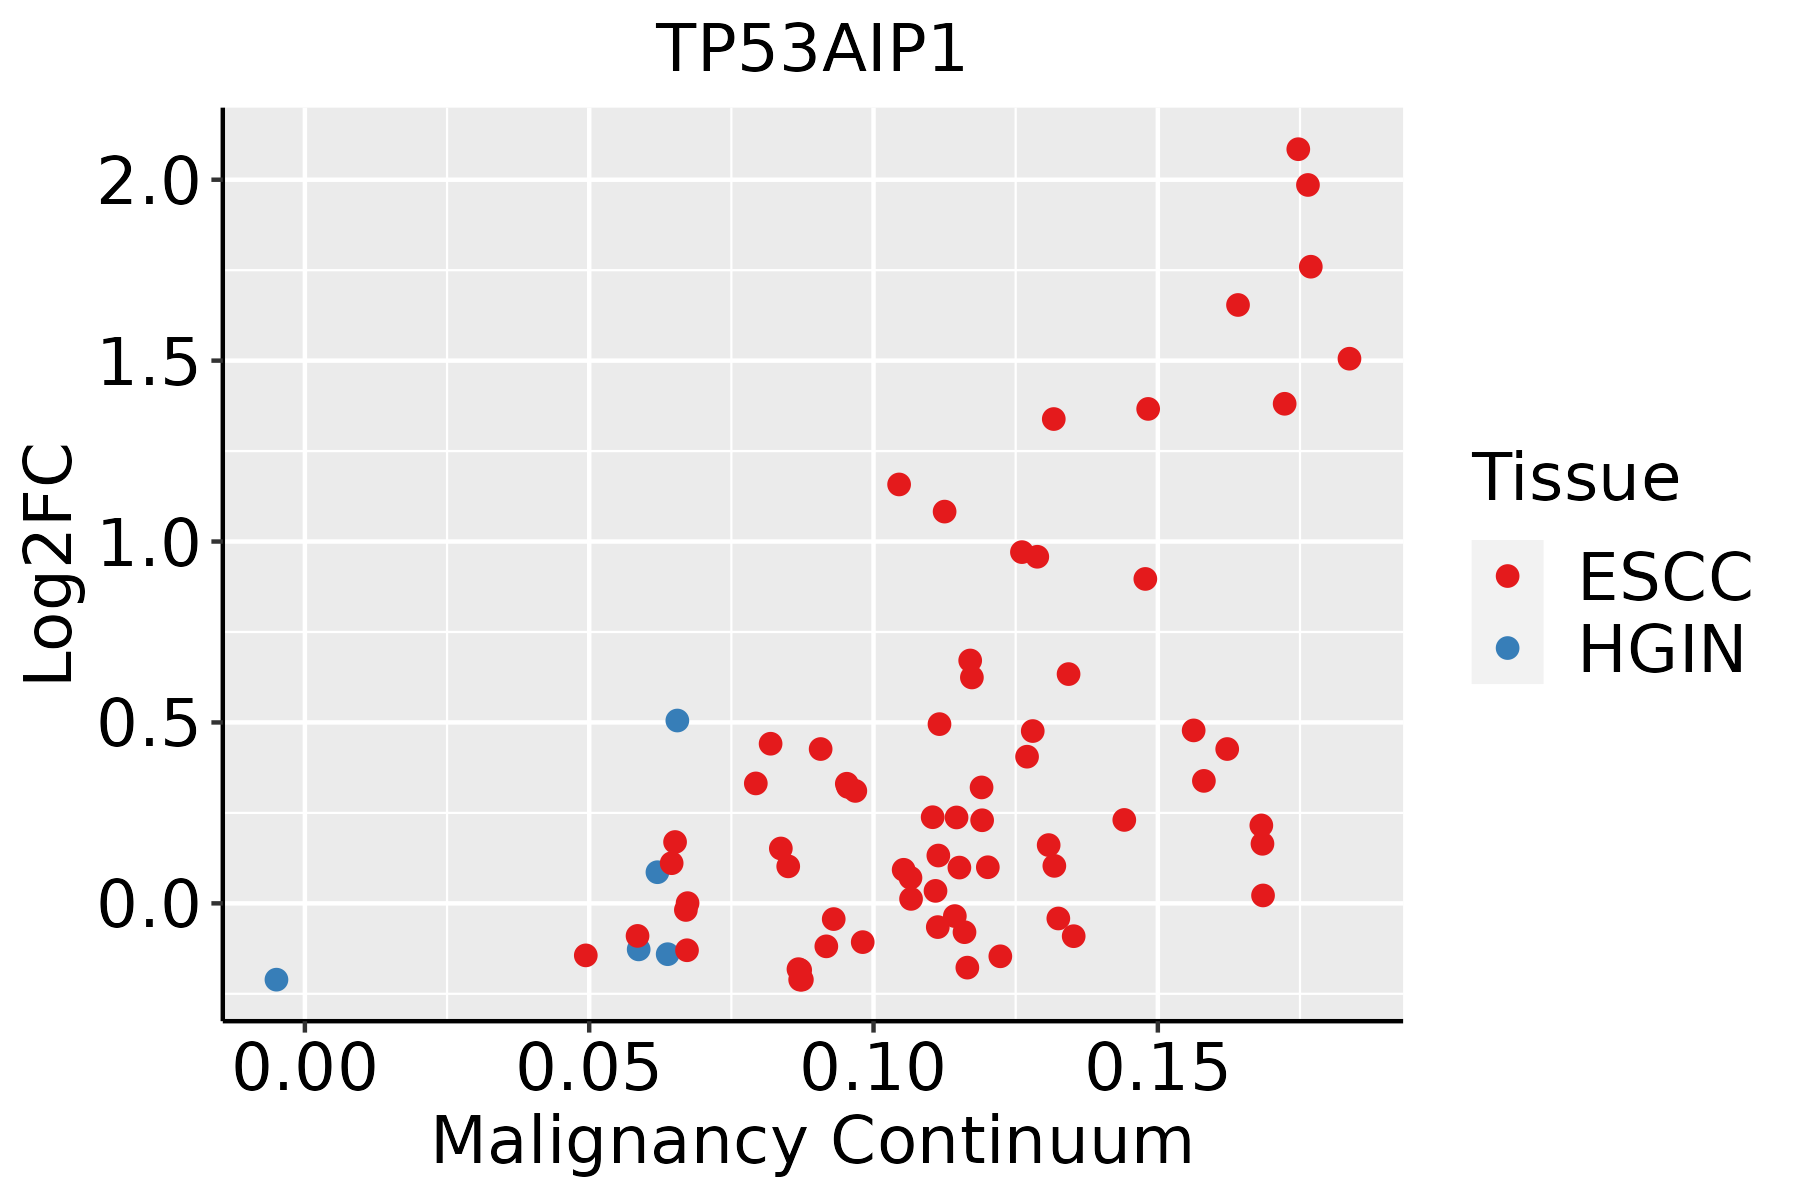 | ESCC: Esophageal squamous cell carcinoma |
| HGIN: High-grade intraepithelial neoplasias | ||
| LGIN: Low-grade intraepithelial neoplasias | ||
| Oral Cavity | 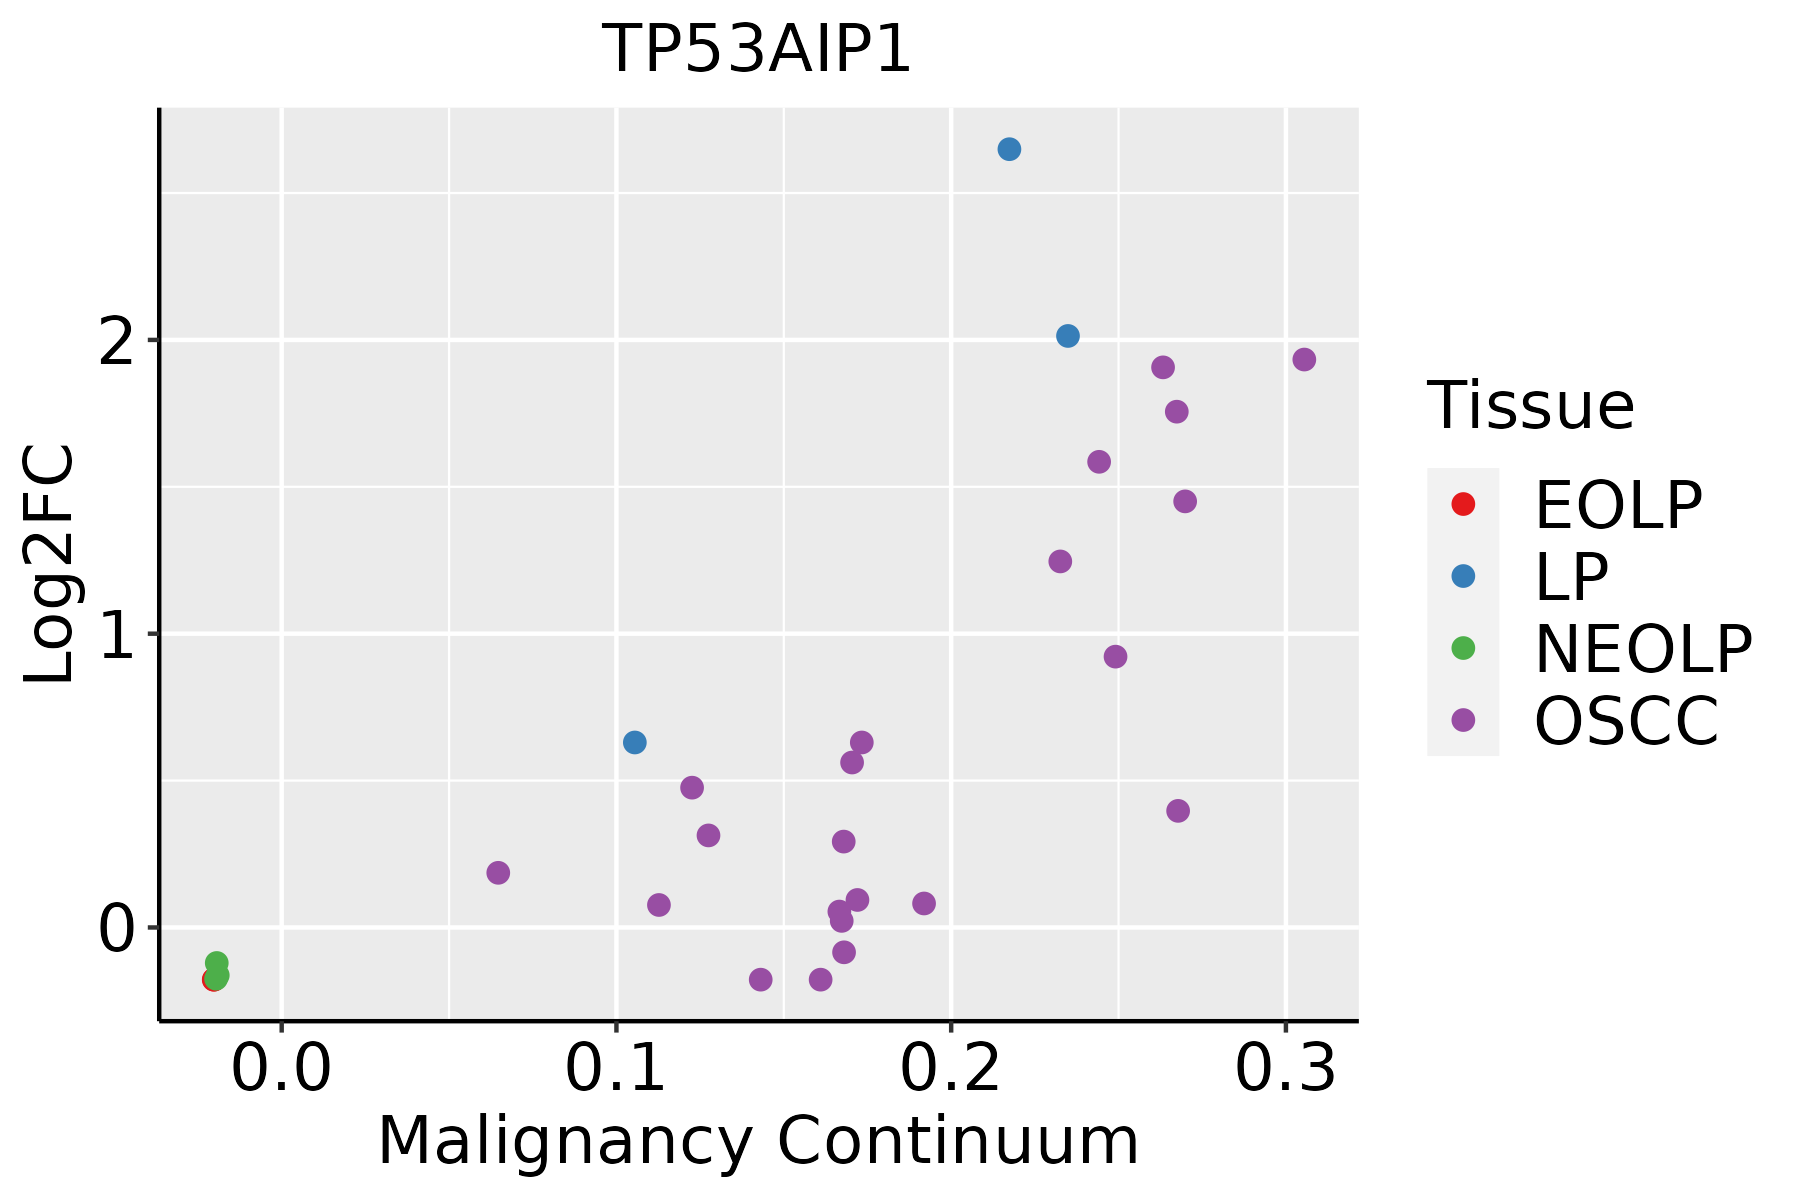 | EOLP: Erosive Oral lichen planus |
| LP: leukoplakia | ||
| NEOLP: Non-erosive oral lichen planus | ||
| OSCC: Oral squamous cell carcinoma | ||
| Skin | 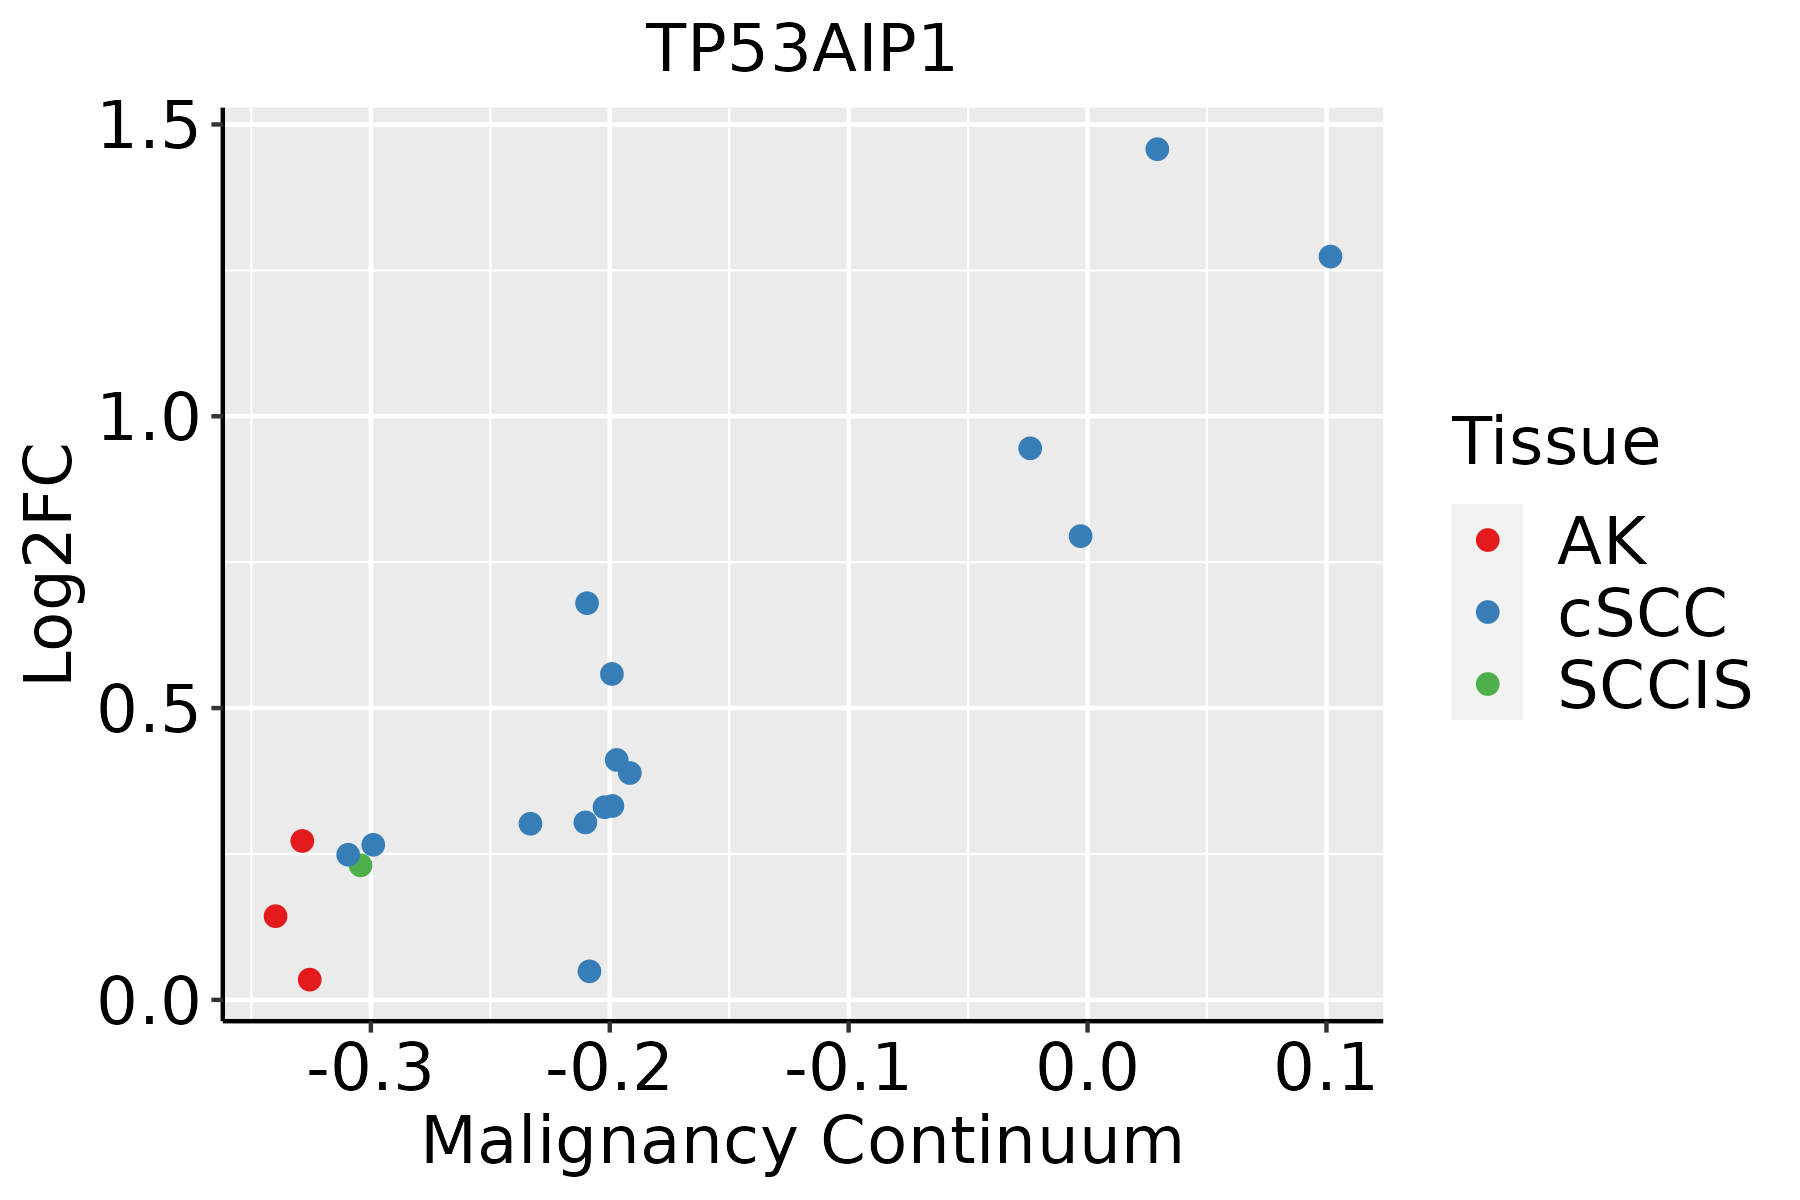 | AK: Actinic keratosis |
| cSCC: Cutaneous squamous cell carcinoma | ||
| SCCIS:squamous cell carcinoma in situ |
| ∗log2FC in expression of this searched gene in stem-like cells from each diseased tissue sample relative to stem-like cells in normal samples in each tissue plotted against the malignancy continuum. Samples are colored based on if they are from different disease stage. |
Top |
Malignant transformation related pathway analysis |
| Find out the enriched GO biological processes and KEGG pathways involved in transition from healthy to precancer to cancer |
| Tissue | Disease Stage | Enriched GO biological Processes |
| Colorectum | AD |  |
| Colorectum | SER |  |
| Colorectum | MSS |  |
| Colorectum | MSI-H |  |
| Colorectum | FAP |  |
| ∗Top 15 enriched GO BP terms are showed in the bar plot of each disease state in each tissue. Each row represents a significant GO biological process which is colored according to the -log10(p.adjust). |
| Page: 1 2 3 4 5 6 7 8 9 |
| GO ID | Tissue | Disease Stage | Description | Gene Ratio | Bg Ratio | pvalue | p.adjust | Count |
| Page: 1 |
| Pathway ID | Tissue | Disease Stage | Description | Gene Ratio | Bg Ratio | pvalue | p.adjust | qvalue | Count |
| hsa0411524 | Esophagus | ESCC | p53 signaling pathway | 65/4205 | 74/8465 | 3.88e-12 | 6.50e-11 | 3.33e-11 | 65 |
| hsa0421027 | Esophagus | ESCC | Apoptosis | 102/4205 | 136/8465 | 1.05e-09 | 1.21e-08 | 6.21e-09 | 102 |
| hsa0411534 | Esophagus | ESCC | p53 signaling pathway | 65/4205 | 74/8465 | 3.88e-12 | 6.50e-11 | 3.33e-11 | 65 |
| hsa0421037 | Esophagus | ESCC | Apoptosis | 102/4205 | 136/8465 | 1.05e-09 | 1.21e-08 | 6.21e-09 | 102 |
| hsa0421018 | Oral cavity | OSCC | Apoptosis | 101/3704 | 136/8465 | 3.34e-13 | 7.00e-12 | 3.56e-12 | 101 |
| hsa041159 | Oral cavity | OSCC | p53 signaling pathway | 57/3704 | 74/8465 | 4.99e-09 | 5.07e-08 | 2.58e-08 | 57 |
| hsa0421019 | Oral cavity | OSCC | Apoptosis | 101/3704 | 136/8465 | 3.34e-13 | 7.00e-12 | 3.56e-12 | 101 |
| hsa0411514 | Oral cavity | OSCC | p53 signaling pathway | 57/3704 | 74/8465 | 4.99e-09 | 5.07e-08 | 2.58e-08 | 57 |
| hsa0421026 | Oral cavity | LP | Apoptosis | 65/2418 | 136/8465 | 1.33e-06 | 1.48e-05 | 9.53e-06 | 65 |
| hsa0411523 | Oral cavity | LP | p53 signaling pathway | 38/2418 | 74/8465 | 2.82e-05 | 1.92e-04 | 1.24e-04 | 38 |
| hsa0421036 | Oral cavity | LP | Apoptosis | 65/2418 | 136/8465 | 1.33e-06 | 1.48e-05 | 9.53e-06 | 65 |
| hsa0411533 | Oral cavity | LP | p53 signaling pathway | 38/2418 | 74/8465 | 2.82e-05 | 1.92e-04 | 1.24e-04 | 38 |
| hsa0421043 | Oral cavity | EOLP | Apoptosis | 40/1218 | 136/8465 | 4.20e-06 | 2.91e-05 | 1.72e-05 | 40 |
| hsa0421053 | Oral cavity | EOLP | Apoptosis | 40/1218 | 136/8465 | 4.20e-06 | 2.91e-05 | 1.72e-05 | 40 |
| Page: 1 |
Top |
Cell-cell communication analysis |
| Identification of potential cell-cell interactions between two cell types and their ligand-receptor pairs for different disease states |
| Ligand | Receptor | LRpair | Pathway | Tissue | Disease Stage |
| Page: 1 |
Top |
Single-cell gene regulatory network inference analysis |
| Find out the significant the regulons (TFs) and the target genes of each regulon across cell types for different disease states |
| TF | Cell Type | Tissue | Disease Stage | Target Gene | RSS | Regulon Activity |
| ∗The dot plots of a searched regulon are shown for all cell subpopulations in each disease state of each tissue based on the regulon specific score inferred using pySCENIC and by calculating the average expression. |
| Page: 1 |
Top |
Somatic mutation of malignant transformation related genes |
| Annotation of somatic variants for genes involved in malignant transformation |
| Hugo Symbol | Variant Class | Variant Classification | dbSNP RS | HGVSc | HGVSp | HGVSp Short | SWISSPROT | BIOTYPE | SIFT | PolyPhen | Tumor Sample Barcode | Tissue | Histology | Sex | Age | Stage | Therapy Types | Drugs | Outcome |
| TP53AIP1 | SNV | Missense_Mutation | c.73G>T | p.Gly25Cys | p.G25C | Q9HCN2 | protein_coding | deleterious_low_confidence(0) | probably_damaging(0.93) | TCGA-A6-2686-01 | Colorectum | colon adenocarcinoma | Female | >=65 | I/II | Unknown | Unknown | SD | |
| TP53AIP1 | SNV | Missense_Mutation | novel | c.29G>T | p.Arg10Ile | p.R10I | Q9HCN2 | protein_coding | deleterious_low_confidence(0) | probably_damaging(0.998) | TCGA-F5-6814-01 | Colorectum | rectum adenocarcinoma | Male | <65 | I/II | Unknown | Unknown | SD |
| TP53AIP1 | SNV | Missense_Mutation | novel | c.305N>A | p.Arg102Lys | p.R102K | Q9HCN2 | protein_coding | tolerated_low_confidence(0.49) | benign(0) | TCGA-AJ-A3EK-01 | Endometrium | uterine corpus endometrioid carcinoma | Female | <65 | I/II | Chemotherapy | carboplatin | CR |
| TP53AIP1 | SNV | Missense_Mutation | rs200680167 | c.359N>T | p.Pro120Leu | p.P120L | Q9HCN2 | protein_coding | tolerated_low_confidence(1) | benign(0) | TCGA-AX-A1CE-01 | Endometrium | uterine corpus endometrioid carcinoma | Female | <65 | I/II | Unspecific | Paclitaxel | SD |
| TP53AIP1 | SNV | Missense_Mutation | novel | c.301N>T | p.Leu101Phe | p.L101F | Q9HCN2 | protein_coding | deleterious_low_confidence(0) | possibly_damaging(0.654) | TCGA-B5-A3FC-01 | Endometrium | uterine corpus endometrioid carcinoma | Female | <65 | I/II | Unknown | Unknown | SD |
| TP53AIP1 | SNV | Missense_Mutation | novel | c.34N>T | p.Ala12Ser | p.A12S | Q9HCN2 | protein_coding | deleterious_low_confidence(0) | benign(0.039) | TCGA-86-8358-01 | Lung | lung adenocarcinoma | Male | <65 | I/II | Unknown | Unknown | SD |
| Page: 1 |
Top |
Related drugs of malignant transformation related genes |
| Identification of chemicals and drugs interact with genes involved in malignant transfromation |
| (DGIdb 4.0) |
| Entrez ID | Symbol | Category | Interaction Types | Drug Claim Name | Drug Name | PMIDs |
| 63970 | TP53AIP1 | NA | epirubicin | EPIRUBICIN | ||
| 63970 | TP53AIP1 | NA | fluorouracil | FLUOROURACIL | ||
| 63970 | TP53AIP1 | NA | cyclophosphamide | CYCLOPHOSPHAMIDE |
| Page: 1 |

Copyright 2023-Present -The University of Texas Health Science Center at Houston |