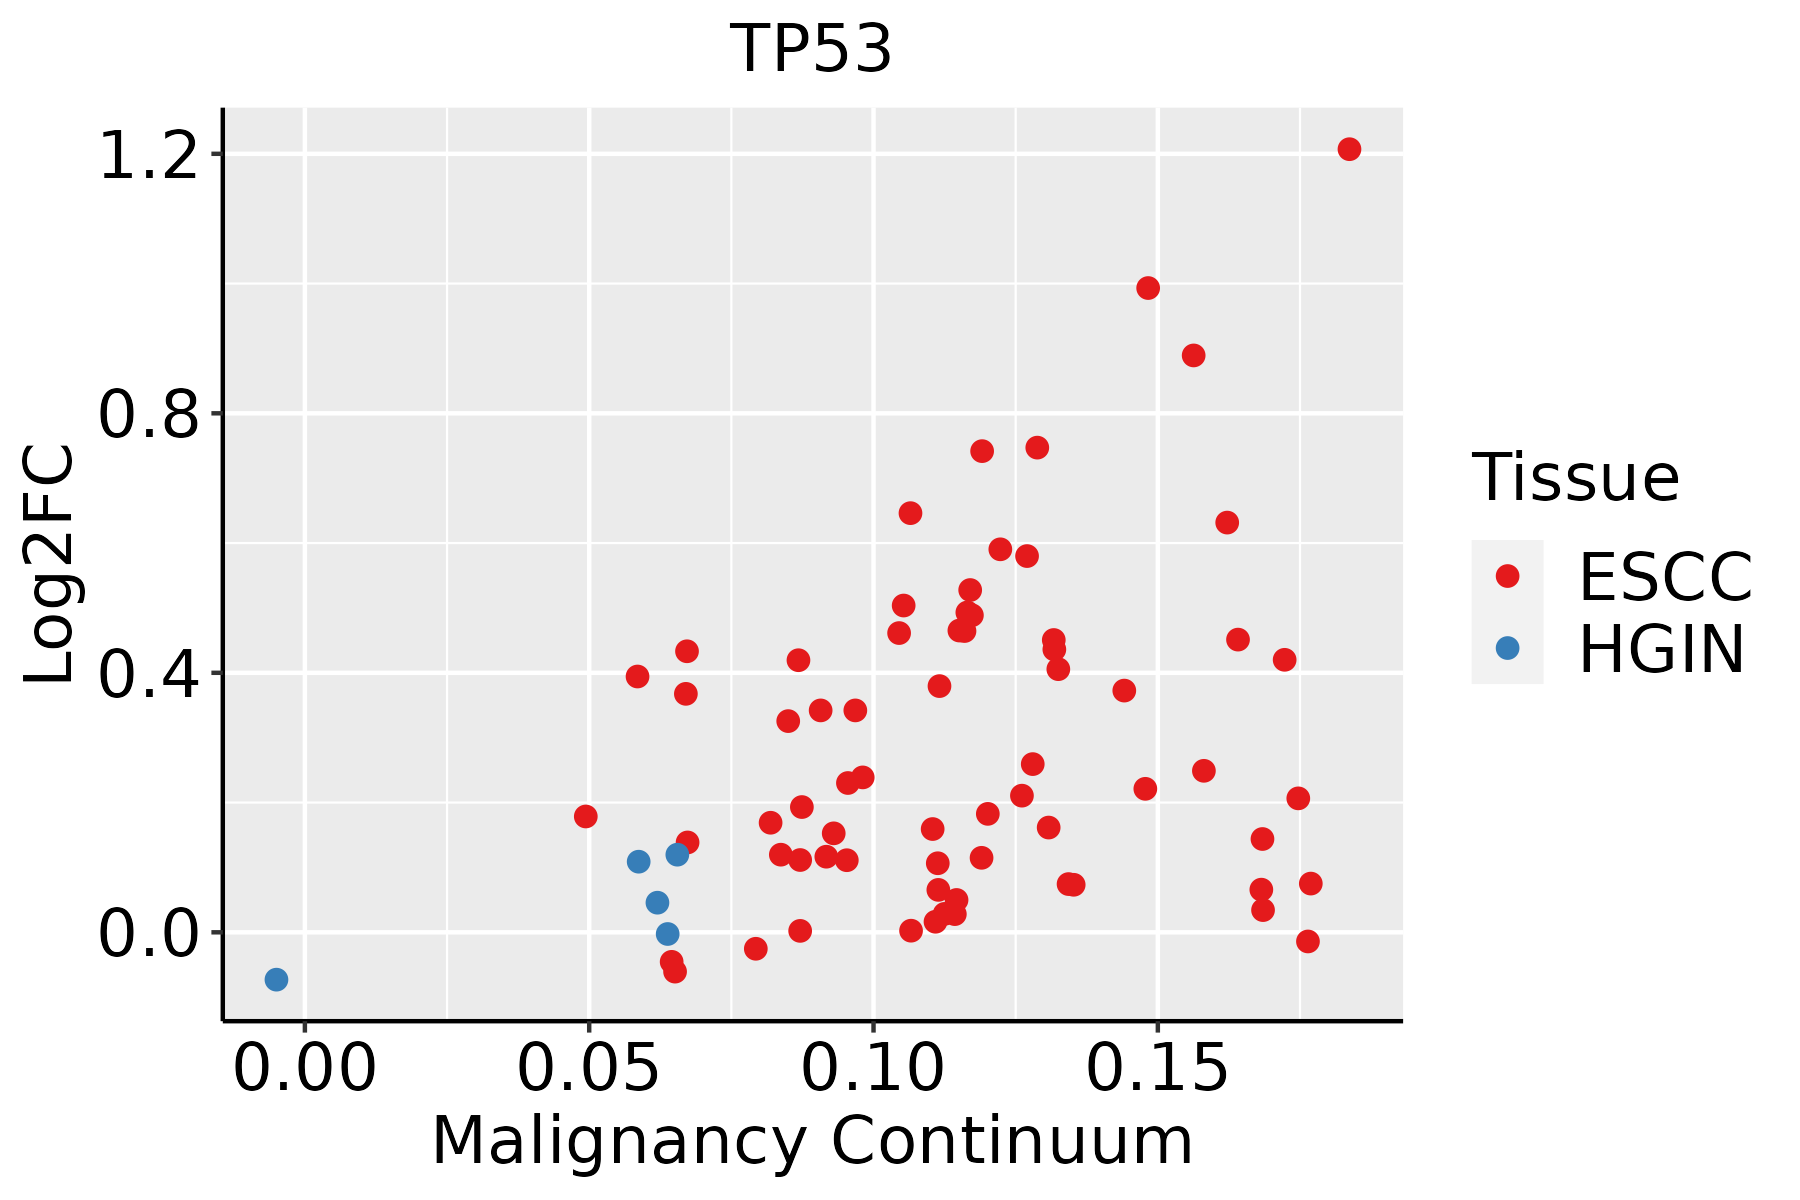
| Tissue | Expression Dynamics | Abbreviation |
| Colorectum (GSE201348) |  | FAP: Familial adenomatous polyposis |
| CRC: Colorectal cancer |
| Colorectum (HTA11) |  | AD: Adenomas |
| SER: Sessile serrated lesions |
| MSI-H: Microsatellite-high colorectal cancer |
| MSS: Microsatellite stable colorectal cancer |
| Esophagus |  | ESCC: Esophageal squamous cell carcinoma |
| HGIN: High-grade intraepithelial neoplasias |
| LGIN: Low-grade intraepithelial neoplasias |
| Oral Cavity |  | EOLP: Erosive Oral lichen planus |
| LP: leukoplakia |
| NEOLP: Non-erosive oral lichen planus |
| OSCC: Oral squamous cell carcinoma |
| Skin |  | AK: Actinic keratosis |
| cSCC: Cutaneous squamous cell carcinoma |
| SCCIS:squamous cell carcinoma in situ |
| Thyroid |  | ATC: Anaplastic thyroid cancer |
| HT: Hashimoto's thyroiditis |
| PTC: Papillary thyroid cancer |
| GO ID | Tissue | Disease Stage | Description | Gene Ratio | Bg Ratio | pvalue | p.adjust | Count |
| GO:0046034 | Colorectum | AD | ATP metabolic process | 142/3918 | 277/18723 | 2.64e-29 | 8.26e-26 | 142 |
| GO:0006091 | Colorectum | AD | generation of precursor metabolites and energy | 209/3918 | 490/18723 | 3.17e-28 | 6.61e-25 | 209 |
| GO:0015980 | Colorectum | AD | energy derivation by oxidation of organic compounds | 143/3918 | 318/18723 | 2.78e-22 | 2.49e-19 | 143 |
| GO:0016032 | Colorectum | AD | viral process | 168/3918 | 415/18723 | 4.67e-20 | 3.66e-17 | 168 |
| GO:0009896 | Colorectum | AD | positive regulation of catabolic process | 180/3918 | 492/18723 | 4.33e-16 | 1.94e-13 | 180 |
| GO:0031331 | Colorectum | AD | positive regulation of cellular catabolic process | 156/3918 | 427/18723 | 4.68e-14 | 1.05e-11 | 156 |
| GO:0009895 | Colorectum | AD | negative regulation of catabolic process | 124/3918 | 320/18723 | 1.66e-13 | 3.35e-11 | 124 |
| GO:0006839 | Colorectum | AD | mitochondrial transport | 102/3918 | 254/18723 | 1.87e-12 | 3.08e-10 | 102 |
| GO:0031330 | Colorectum | AD | negative regulation of cellular catabolic process | 104/3918 | 262/18723 | 2.66e-12 | 3.96e-10 | 104 |
| GO:0072594 | Colorectum | AD | establishment of protein localization to organelle | 148/3918 | 422/18723 | 7.95e-12 | 1.04e-09 | 148 |
| GO:0043254 | Colorectum | AD | regulation of protein-containing complex assembly | 148/3918 | 428/18723 | 2.64e-11 | 3.18e-09 | 148 |
| GO:0097193 | Colorectum | AD | intrinsic apoptotic signaling pathway | 108/3918 | 288/18723 | 6.25e-11 | 6.41e-09 | 108 |
| GO:0031334 | Colorectum | AD | positive regulation of protein-containing complex assembly | 91/3918 | 237/18723 | 4.78e-10 | 3.99e-08 | 91 |
| GO:0031647 | Colorectum | AD | regulation of protein stability | 108/3918 | 298/18723 | 6.33e-10 | 5.08e-08 | 108 |
| GO:0022411 | Colorectum | AD | cellular component disassembly | 147/3918 | 443/18723 | 8.53e-10 | 6.76e-08 | 147 |
| GO:0010506 | Colorectum | AD | regulation of autophagy | 111/3918 | 317/18723 | 3.57e-09 | 2.35e-07 | 111 |
| GO:2001242 | Colorectum | AD | regulation of intrinsic apoptotic signaling pathway | 67/3918 | 164/18723 | 4.94e-09 | 3.16e-07 | 67 |
| GO:0006979 | Colorectum | AD | response to oxidative stress | 145/3918 | 446/18723 | 5.16e-09 | 3.23e-07 | 145 |
| GO:0016236 | Colorectum | AD | macroautophagy | 103/3918 | 291/18723 | 6.76e-09 | 4.15e-07 | 103 |
| GO:2001233 | Colorectum | AD | regulation of apoptotic signaling pathway | 119/3918 | 356/18723 | 2.14e-08 | 1.21e-06 | 119 |
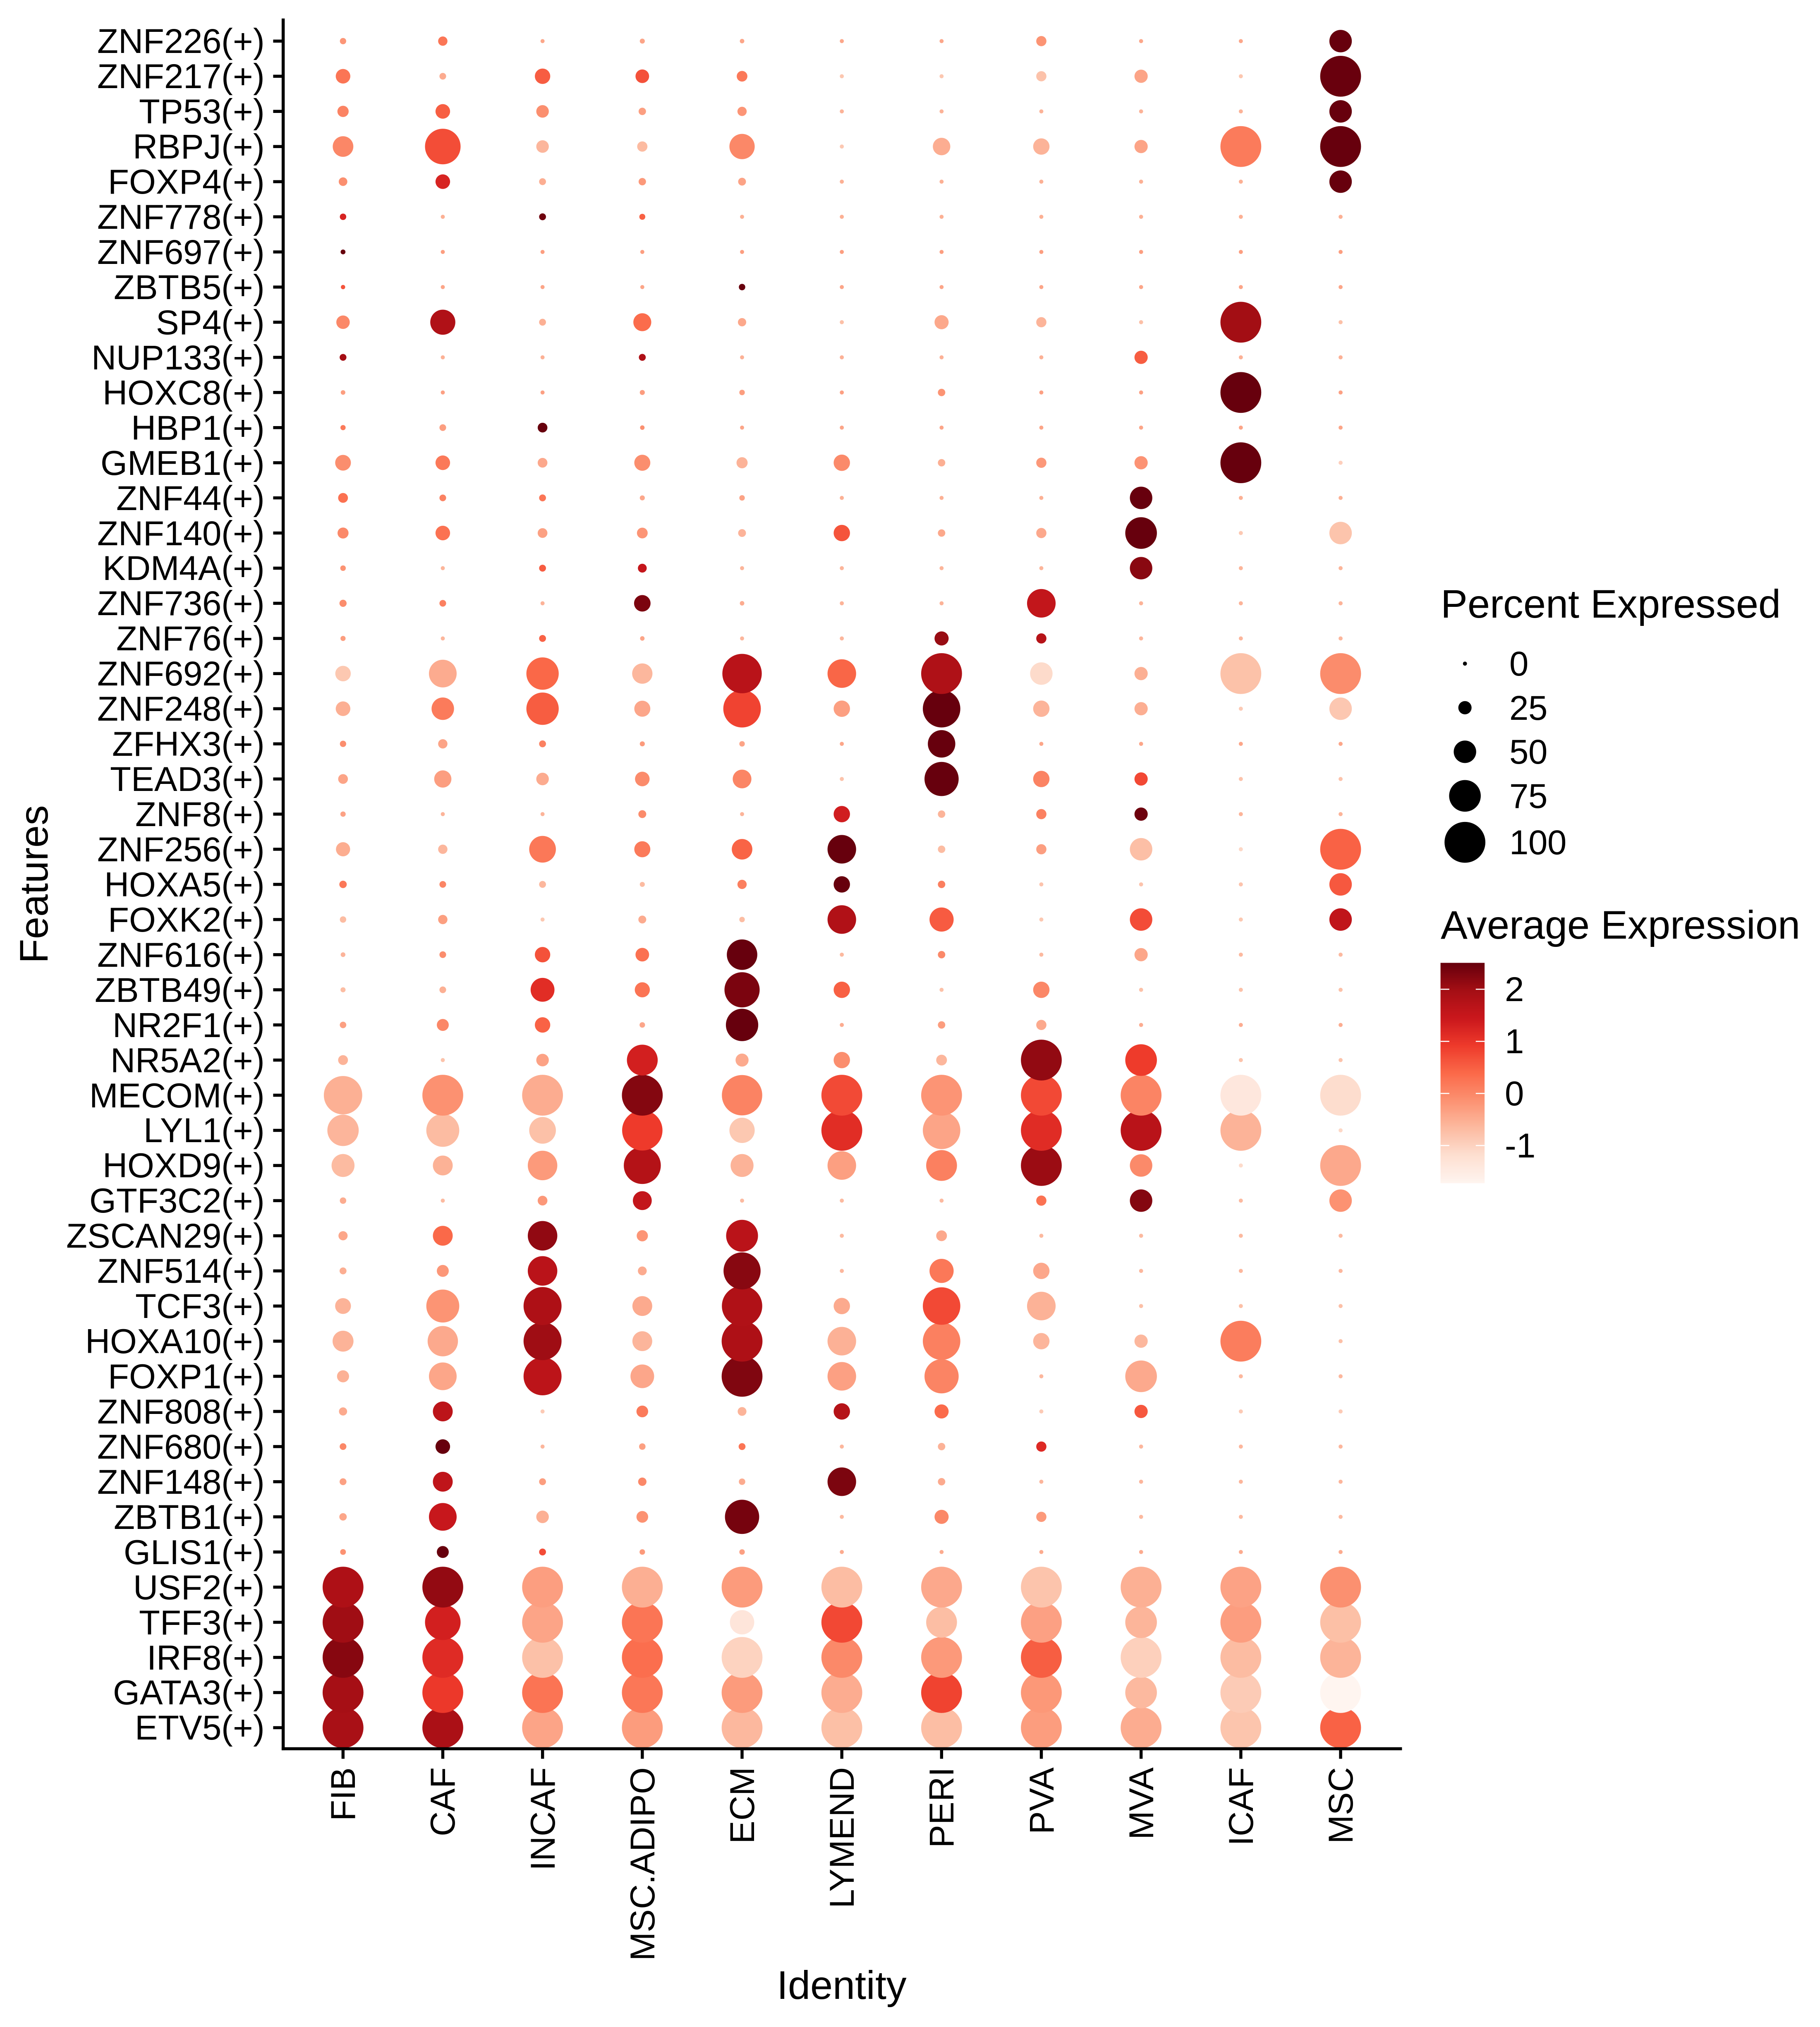
| TF | Cell Type | Tissue | Disease Stage | Target Gene | RSS | Regulon Activity |
| TP53 | MSC | Breast | DCIS | ATP1B2,CTNNB1,F2R, etc. | 1.47e-02 |  |
| TP53 | FIB | Breast | Healthy | ATP1B2,CTNNB1,F2R, etc. | 4.25e-02 |  |
| TP53 | FIB | Breast | Precancer | ATP1B2,CTNNB1,F2R, etc. | 1.56e-02 |  |
| TP53 | ASC | Colorectum | ADJ | CATSPERE,AP000446.1,TMEM69, etc. | 1.30e-01 |  |
| TP53 | TAC | Colorectum | Healthy | ESYT1,ATAD5,GNL3, etc. | 7.42e-02 |  |
| TP53 | CD8TEXINT | Lung | AAH | APOLD1,RAB27A,PHACTR2-AS1, etc. | 3.56e-01 |  |
| TP53 | TH1 | Lung | Healthy | TRAT1,MRPL43,LSM14A, etc. | 8.15e-03 |  |
| TP53 | CD8TCM | Lung | IAC | TTC4,ELMOD3,RNASE1, etc. | 4.42e-02 |  |
| TP53 | CD8TEFF | Lung | IAC | TTC4,ELMOD3,RNASE1, etc. | 3.87e-02 |  |
| TP53 | PVA | Lung | Healthy | HDX,LINC00960,NHEJ1, etc. | 1.10e-01 |  |
| Hugo Symbol | Variant Class | Variant Classification | dbSNP RS | HGVSc | HGVSp | HGVSp Short | SWISSPROT | BIOTYPE | SIFT | PolyPhen | Tumor Sample Barcode | Tissue | Histology | Sex | Age | Stage | Therapy Types | Drugs | Outcome |
| TP53 | SNV | Missense_Mutation | rs28934578 | c.524N>A | p.Arg175His | p.R175H | P04637 | protein_coding | tolerated(0.11) | benign(0.319) | TCGA-A1-A0SI-01 | Breast | breast invasive carcinoma | Female | <65 | I/II | Unknown | Unknown | SD |
| TP53 | SNV | Missense_Mutation | | c.398N>A | p.Met133Lys | p.M133K | P04637 | protein_coding | deleterious(0) | benign(0.061) | TCGA-A1-A0SK-01 | Breast | breast invasive carcinoma | Female | <65 | I/II | Unknown | Unknown | PD |
| TP53 | SNV | Missense_Mutation | rs121912666 | c.659A>G | p.Tyr220Cys | p.Y220C | P04637 | protein_coding | deleterious(0) | probably_damaging(0.998) | TCGA-A1-A0SO-01 | Breast | breast invasive carcinoma | Female | >=65 | I/II | Chemotherapy | | SD |
| TP53 | SNV | Missense_Mutation | rs28934576 | c.818N>A | p.Arg273His | p.R273H | P04637 | protein_coding | tolerated(0.13) | possibly_damaging(0.643) | TCGA-A2-A04T-01 | Breast | breast invasive carcinoma | Female | <65 | I/II | Chemotherapy | cyclophosphamide | SD |
| TP53 | SNV | Missense_Mutation | | c.623N>G | p.Asp208Gly | p.D208G | P04637 | protein_coding | deleterious(0.04) | probably_damaging(0.988) | TCGA-A2-A04T-01 | Breast | breast invasive carcinoma | Female | <65 | I/II | Chemotherapy | cyclophosphamide | SD |
| TP53 | SNV | Missense_Mutation | rs121912657 | c.814N>A | p.Val272Met | p.V272M | P04637 | protein_coding | deleterious(0) | probably_damaging(0.998) | TCGA-A2-A04W-01 | Breast | breast invasive carcinoma | Female | <65 | I/II | Chemotherapy | cytoxan | SD |
| TP53 | SNV | Missense_Mutation | rs28934576 | c.818G>T | p.Arg273Leu | p.R273L | P04637 | protein_coding | deleterious(0) | probably_damaging(0.994) | TCGA-A2-A0CL-01 | Breast | breast invasive carcinoma | Female | <65 | III/IV | Chemotherapy | cytoxan | SD |
| TP53 | SNV | Missense_Mutation | | c.691A>C | p.Thr231Pro | p.T231P | P04637 | protein_coding | deleterious(0) | probably_damaging(0.981) | TCGA-A2-A0CS-01 | Breast | breast invasive carcinoma | Female | >=65 | III/IV | Hormone Therapy | anastrozole | SD |
| TP53 | SNV | Missense_Mutation | rs587780073 | c.701N>G | p.Tyr234Cys | p.Y234C | P04637 | protein_coding | deleterious(0) | probably_damaging(0.98) | TCGA-A2-A0EY-01 | Breast | breast invasive carcinoma | Female | <65 | I/II | Chemotherapy | adriamycin | SD |
| TP53 | SNV | Missense_Mutation | rs148924904 | c.488N>G | p.Tyr163Cys | p.Y163C | P04637 | protein_coding | deleterious(0) | probably_damaging(0.999) | TCGA-A2-A0ST-01 | Breast | breast invasive carcinoma | Female | <65 | I/II | Chemotherapy | adriamycin | SD |
| Entrez ID | Symbol | Category | Interaction Types | Drug Claim Name | Drug Name | PMIDs |
| 7157 | TP53 | CLINICALLY ACTIONABLE, TRANSCRIPTION FACTOR COMPLEX, TUMOR SUPPRESSOR, DRUGGABLE GENOME, KINASE, DRUG RESISTANCE, TRANSPORTER | | CAULIBUGULONE D | CAULIBUGULONE D | |
| 7157 | TP53 | CLINICALLY ACTIONABLE, TRANSCRIPTION FACTOR COMPLEX, TUMOR SUPPRESSOR, DRUGGABLE GENOME, KINASE, DRUG RESISTANCE, TRANSPORTER | | fluorouracil | FLUOROURACIL | |
| 7157 | TP53 | CLINICALLY ACTIONABLE, TRANSCRIPTION FACTOR COMPLEX, TUMOR SUPPRESSOR, DRUGGABLE GENOME, KINASE, DRUG RESISTANCE, TRANSPORTER | | CID 867101 | CHEMBL406557 | |
| 7157 | TP53 | CLINICALLY ACTIONABLE, TRANSCRIPTION FACTOR COMPLEX, TUMOR SUPPRESSOR, DRUGGABLE GENOME, KINASE, DRUG RESISTANCE, TRANSPORTER | | SJ000276790 | CHEMBL602922 | |
| 7157 | TP53 | CLINICALLY ACTIONABLE, TRANSCRIPTION FACTOR COMPLEX, TUMOR SUPPRESSOR, DRUGGABLE GENOME, KINASE, DRUG RESISTANCE, TRANSPORTER | | OLEOYL DOPAMINE | OLEOYL DOPAMINE | |
| 7157 | TP53 | CLINICALLY ACTIONABLE, TRANSCRIPTION FACTOR COMPLEX, TUMOR SUPPRESSOR, DRUGGABLE GENOME, KINASE, DRUG RESISTANCE, TRANSPORTER | | DNDI1417085 | CHEMBL1522984 | |
| 7157 | TP53 | CLINICALLY ACTIONABLE, TRANSCRIPTION FACTOR COMPLEX, TUMOR SUPPRESSOR, DRUGGABLE GENOME, KINASE, DRUG RESISTANCE, TRANSPORTER | | DNDI1340257 | CHEMBL1702181 | |
| 7157 | TP53 | CLINICALLY ACTIONABLE, TRANSCRIPTION FACTOR COMPLEX, TUMOR SUPPRESSOR, DRUGGABLE GENOME, KINASE, DRUG RESISTANCE, TRANSPORTER | | TEBUFENPYRAD | TEBUFENPYRAD | |
| 7157 | TP53 | CLINICALLY ACTIONABLE, TRANSCRIPTION FACTOR COMPLEX, TUMOR SUPPRESSOR, DRUGGABLE GENOME, KINASE, DRUG RESISTANCE, TRANSPORTER | | CTX-1 | | 26883273 |
| 7157 | TP53 | CLINICALLY ACTIONABLE, TRANSCRIPTION FACTOR COMPLEX, TUMOR SUPPRESSOR, DRUGGABLE GENOME, KINASE, DRUG RESISTANCE, TRANSPORTER | | ZM-336372 | CHEMBL186526 | |


 Identification of the aberrant gene expression in precancerous and cancerous lesions by comparing the gene expression of stem-like cells in diseased tissues with normal stem cells
 Find out the enriched GO biological processes and KEGG pathways involved in transition from healthy to precancer to cancer


 Identification of potential cell-cell interactions between two cell types and their ligand-receptor pairs for different disease states
 Find out the significant the regulons (TFs) and the target genes of each regulon across cell types for different disease states
 Annotation of somatic variants for genes involved in malignant transformation
 Identification of chemicals and drugs interact with genes involved in malignant transfromation


