
|
|||||
|
 | |
| |
| |
| |
| |
| |
|
Gene: TOX4 |
Gene summary for TOX4 |
| Gene information | Species | Human | Gene symbol | TOX4 | Gene ID | 9878 |
| Gene name | TOX high mobility group box family member 4 | |
| Gene Alias | C14orf92 | |
| Cytomap | 14q11.2 | |
| Gene Type | protein-coding | GO ID | GO:0006139 | UniProtAcc | O94842 |
Top |
Malignant transformation analysis |
| Identification of the aberrant gene expression in precancerous and cancerous lesions by comparing the gene expression of stem-like cells in diseased tissues with normal stem cells |
| Entrez ID | Symbol | Replicates | Species | Organ | Tissue | Adj P-value | Log2FC | Malignancy |
| 9878 | TOX4 | LZE4T | Human | Esophagus | ESCC | 6.30e-26 | 7.80e-01 | 0.0811 |
| 9878 | TOX4 | LZE5T | Human | Esophagus | ESCC | 4.59e-02 | 5.75e-01 | 0.0514 |
| 9878 | TOX4 | LZE7T | Human | Esophagus | ESCC | 1.14e-07 | 2.12e-01 | 0.0667 |
| 9878 | TOX4 | LZE8T | Human | Esophagus | ESCC | 2.11e-13 | 3.82e-01 | 0.067 |
| 9878 | TOX4 | LZE20T | Human | Esophagus | ESCC | 1.89e-09 | 4.23e-01 | 0.0662 |
| 9878 | TOX4 | LZE22D1 | Human | Esophagus | HGIN | 1.01e-03 | -2.10e-02 | 0.0595 |
| 9878 | TOX4 | LZE24T | Human | Esophagus | ESCC | 1.31e-23 | 7.24e-01 | 0.0596 |
| 9878 | TOX4 | LZE21T | Human | Esophagus | ESCC | 1.10e-08 | 3.26e-01 | 0.0655 |
| 9878 | TOX4 | LZE6T | Human | Esophagus | ESCC | 1.88e-07 | 3.01e-01 | 0.0845 |
| 9878 | TOX4 | P1T-E | Human | Esophagus | ESCC | 9.13e-11 | 6.60e-01 | 0.0875 |
| 9878 | TOX4 | P2T-E | Human | Esophagus | ESCC | 6.70e-45 | 7.61e-01 | 0.1177 |
| 9878 | TOX4 | P4T-E | Human | Esophagus | ESCC | 3.19e-37 | 9.44e-01 | 0.1323 |
| 9878 | TOX4 | P5T-E | Human | Esophagus | ESCC | 7.53e-30 | 5.50e-01 | 0.1327 |
| 9878 | TOX4 | P8T-E | Human | Esophagus | ESCC | 3.79e-50 | 8.14e-01 | 0.0889 |
| 9878 | TOX4 | P9T-E | Human | Esophagus | ESCC | 4.39e-28 | 5.67e-01 | 0.1131 |
| 9878 | TOX4 | P10T-E | Human | Esophagus | ESCC | 1.60e-34 | 6.26e-01 | 0.116 |
| 9878 | TOX4 | P11T-E | Human | Esophagus | ESCC | 7.95e-13 | 7.71e-01 | 0.1426 |
| 9878 | TOX4 | P12T-E | Human | Esophagus | ESCC | 1.72e-72 | 1.28e+00 | 0.1122 |
| 9878 | TOX4 | P15T-E | Human | Esophagus | ESCC | 7.74e-68 | 1.42e+00 | 0.1149 |
| 9878 | TOX4 | P16T-E | Human | Esophagus | ESCC | 1.73e-33 | 5.69e-01 | 0.1153 |
| Page: 1 2 3 4 5 6 7 |
| Tissue | Expression Dynamics | Abbreviation |
| Esophagus |  | ESCC: Esophageal squamous cell carcinoma |
| HGIN: High-grade intraepithelial neoplasias | ||
| LGIN: Low-grade intraepithelial neoplasias | ||
| Liver | 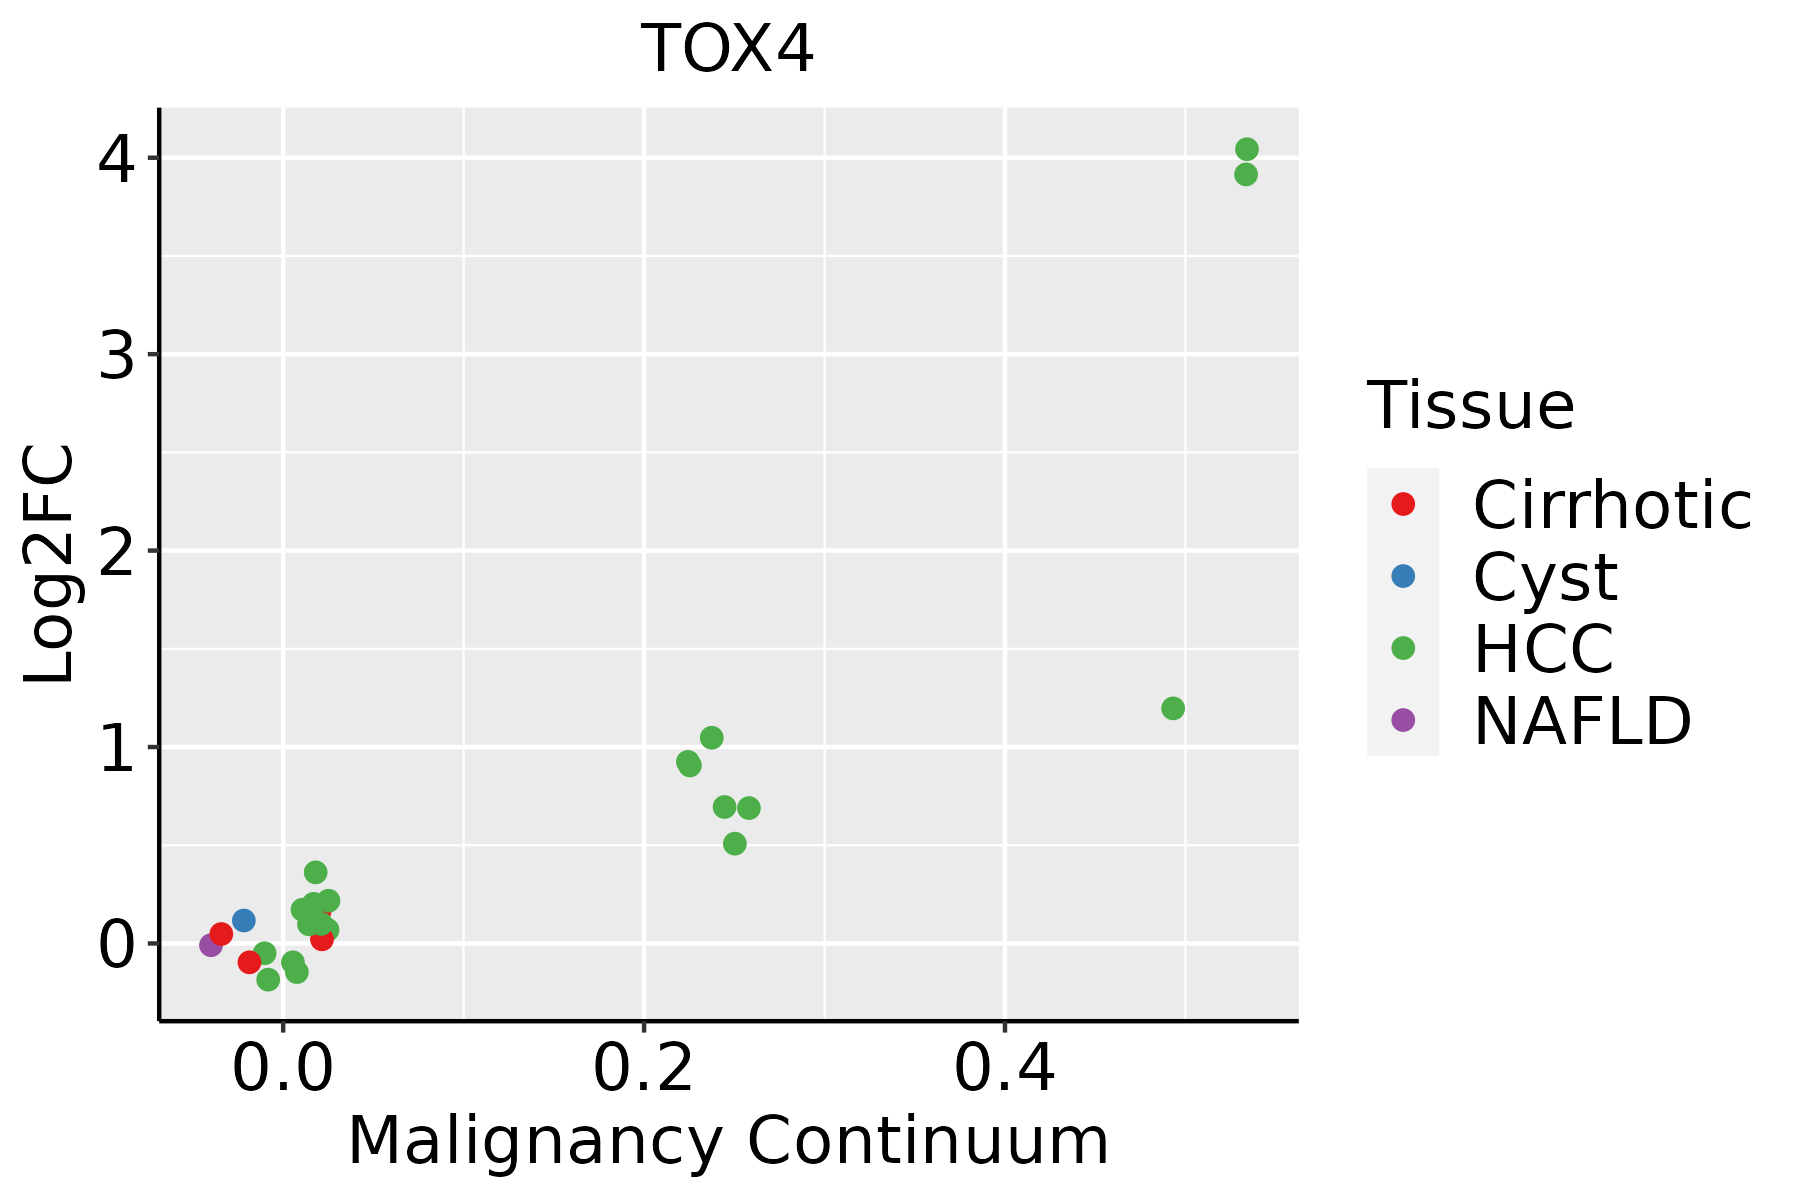 | HCC: Hepatocellular carcinoma |
| NAFLD: Non-alcoholic fatty liver disease | ||
| Oral Cavity |  | EOLP: Erosive Oral lichen planus |
| LP: leukoplakia | ||
| NEOLP: Non-erosive oral lichen planus | ||
| OSCC: Oral squamous cell carcinoma | ||
| Prostate | 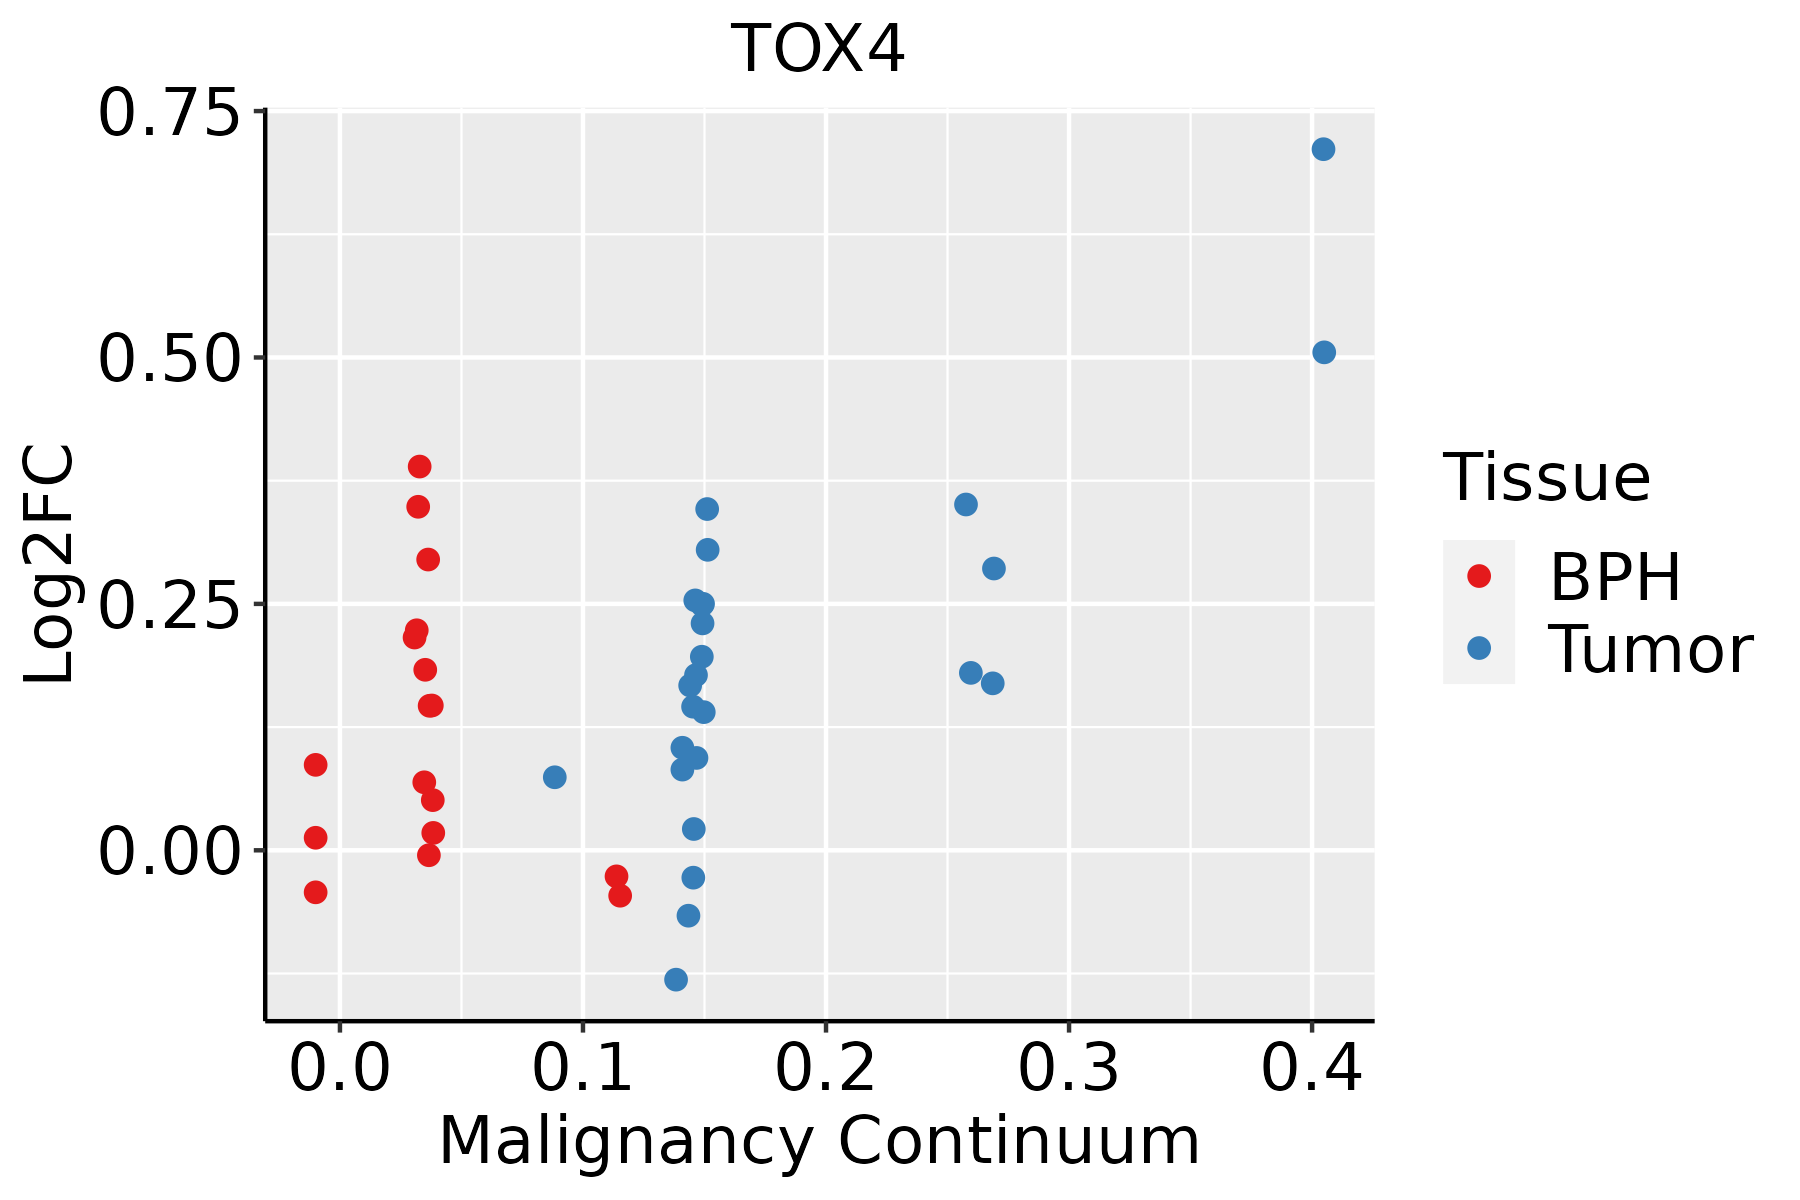 | BPH: Benign Prostatic Hyperplasia |
| Skin |  | AK: Actinic keratosis |
| cSCC: Cutaneous squamous cell carcinoma | ||
| SCCIS:squamous cell carcinoma in situ | ||
| Thyroid | 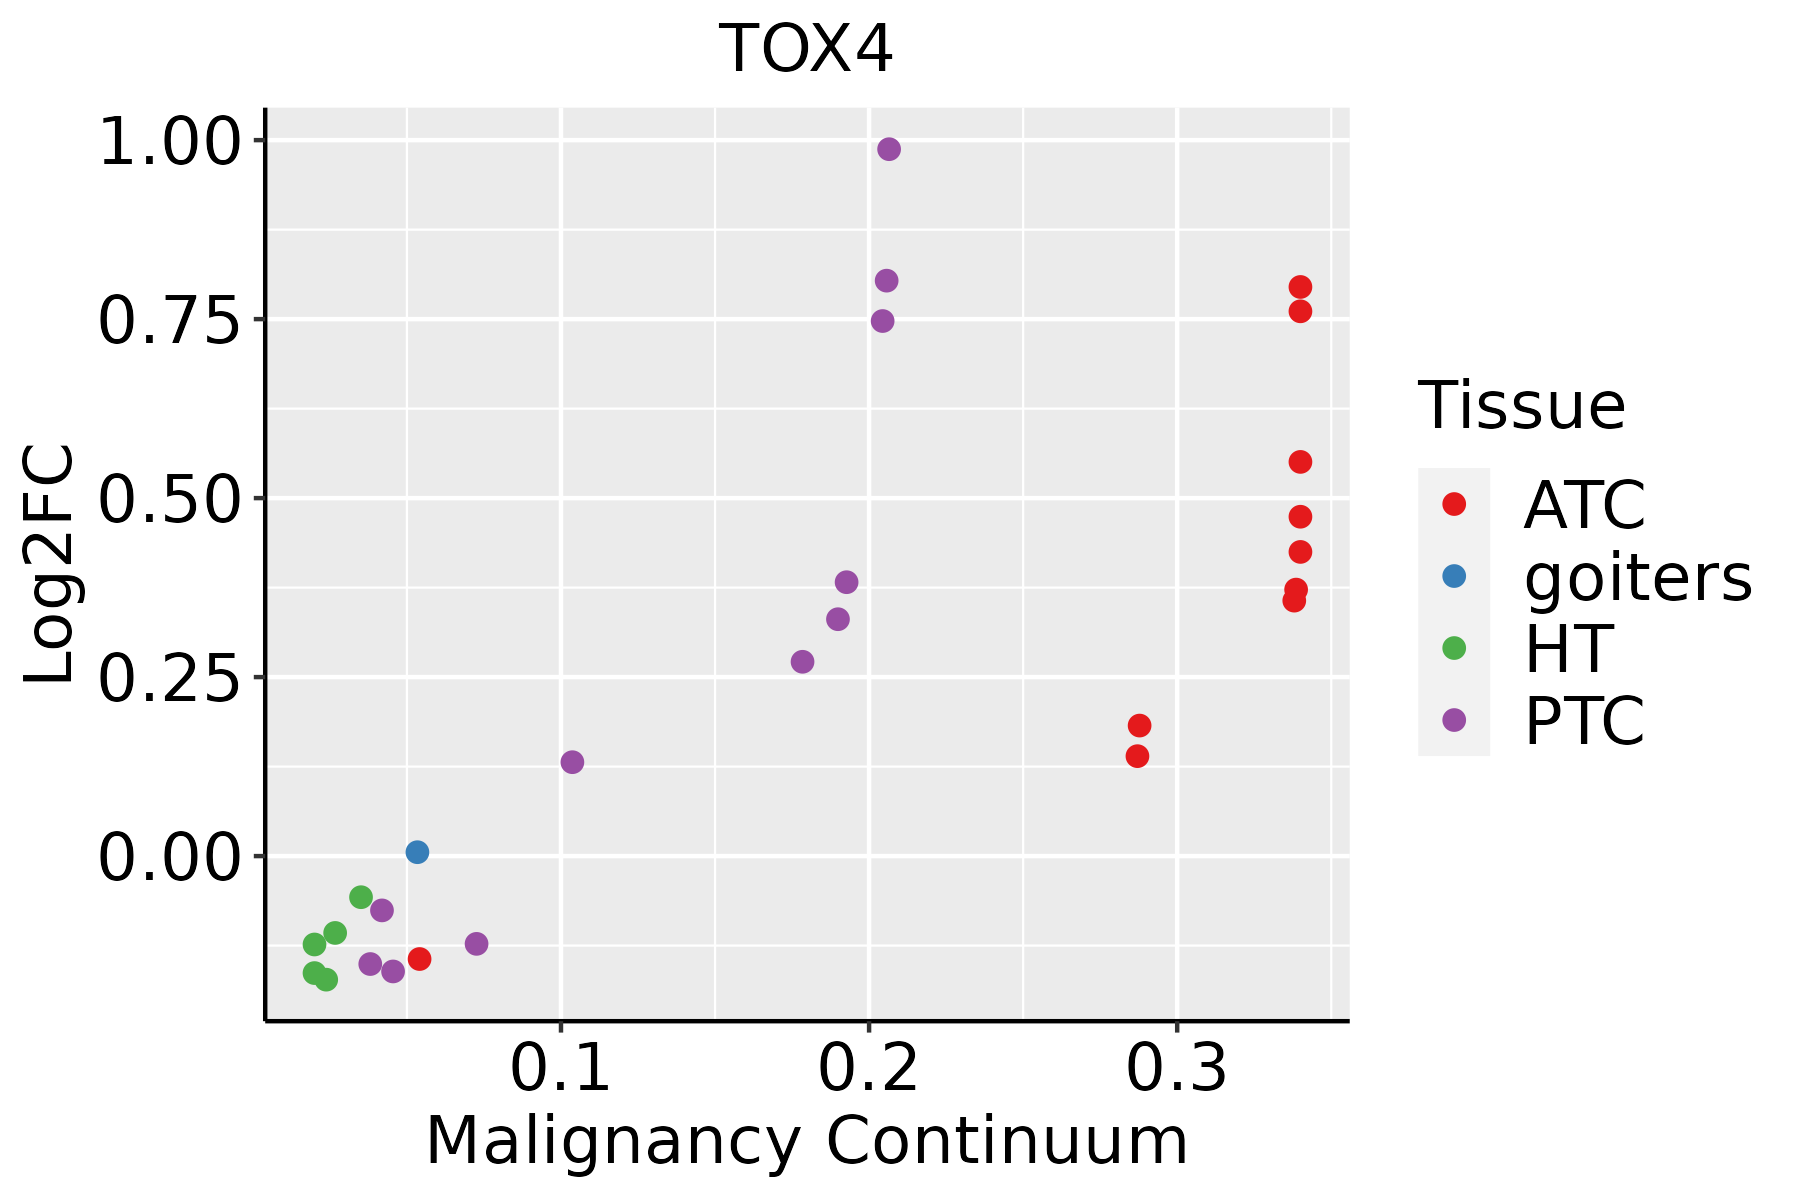 | ATC: Anaplastic thyroid cancer |
| HT: Hashimoto's thyroiditis | ||
| PTC: Papillary thyroid cancer |
| ∗log2FC in expression of this searched gene in stem-like cells from each diseased tissue sample relative to stem-like cells in normal samples in each tissue plotted against the malignancy continuum. Samples are colored based on if they are from different disease stage. |
Top |
Malignant transformation related pathway analysis |
| Find out the enriched GO biological processes and KEGG pathways involved in transition from healthy to precancer to cancer |
| Tissue | Disease Stage | Enriched GO biological Processes |
| Colorectum | AD |  |
| Colorectum | SER |  |
| Colorectum | MSS |  |
| Colorectum | MSI-H |  |
| Colorectum | FAP |  |
| ∗Top 15 enriched GO BP terms are showed in the bar plot of each disease state in each tissue. Each row represents a significant GO biological process which is colored according to the -log10(p.adjust). |
| Page: 1 2 3 4 5 6 7 8 9 |
| GO ID | Tissue | Disease Stage | Description | Gene Ratio | Bg Ratio | pvalue | p.adjust | Count |
| Page: 1 |
| Pathway ID | Tissue | Disease Stage | Description | Gene Ratio | Bg Ratio | pvalue | p.adjust | qvalue | Count |
| Page: 1 |
Top |
Cell-cell communication analysis |
| Identification of potential cell-cell interactions between two cell types and their ligand-receptor pairs for different disease states |
| Ligand | Receptor | LRpair | Pathway | Tissue | Disease Stage |
| Page: 1 |
Top |
Single-cell gene regulatory network inference analysis |
| Find out the significant the regulons (TFs) and the target genes of each regulon across cell types for different disease states |
| TF | Cell Type | Tissue | Disease Stage | Target Gene | RSS | Regulon Activity |
| ∗The dot plots of a searched regulon are shown for all cell subpopulations in each disease state of each tissue based on the regulon specific score inferred using pySCENIC and by calculating the average expression. |
| Page: 1 |
Top |
Somatic mutation of malignant transformation related genes |
| Annotation of somatic variants for genes involved in malignant transformation |
| Hugo Symbol | Variant Class | Variant Classification | dbSNP RS | HGVSc | HGVSp | HGVSp Short | SWISSPROT | BIOTYPE | SIFT | PolyPhen | Tumor Sample Barcode | Tissue | Histology | Sex | Age | Stage | Therapy Types | Drugs | Outcome |
| TOX4 | SNV | Missense_Mutation | novel | c.703N>T | p.Arg235Cys | p.R235C | O94842 | protein_coding | deleterious(0) | possibly_damaging(0.893) | TCGA-AN-A046-01 | Breast | breast invasive carcinoma | Female | >=65 | I/II | Unknown | Unknown | SD |
| TOX4 | SNV | Missense_Mutation | novel | c.1325N>T | p.Arg442Leu | p.R442L | O94842 | protein_coding | tolerated(0.5) | benign(0.4) | TCGA-AN-A0FW-01 | Breast | breast invasive carcinoma | Female | >=65 | III/IV | Unknown | Unknown | SD |
| TOX4 | SNV | Missense_Mutation | c.179N>T | p.Asp60Val | p.D60V | O94842 | protein_coding | deleterious(0.02) | possibly_damaging(0.767) | TCGA-BH-A0B0-01 | Breast | breast invasive carcinoma | Female | <65 | I/II | Chemotherapy | adriamycin | CR | |
| TOX4 | SNV | Missense_Mutation | c.1849G>A | p.Val617Met | p.V617M | O94842 | protein_coding | tolerated(0.24) | probably_damaging(0.969) | TCGA-BH-A0HK-01 | Breast | breast invasive carcinoma | Female | >=65 | I/II | Hormone Therapy | arimidex | SD | |
| TOX4 | SNV | Missense_Mutation | c.1402C>G | p.Pro468Ala | p.P468A | O94842 | protein_coding | deleterious(0) | probably_damaging(0.986) | TCGA-D8-A1J8-01 | Breast | breast invasive carcinoma | Female | >=65 | I/II | Hormone Therapy | nolvadex | SD | |
| TOX4 | SNV | Missense_Mutation | rs775810291 | c.962N>A | p.Thr321Asn | p.T321N | O94842 | protein_coding | tolerated(0.52) | benign(0.133) | TCGA-D8-A1Y1-01 | Breast | breast invasive carcinoma | Female | >=65 | III/IV | Hormone Therapy | tamoxiphen | PD |
| TOX4 | insertion | Nonsense_Mutation | novel | c.804_805insTTTAGTGTTTAATT | p.Lys269PhefsTer4 | p.K269Ffs*4 | O94842 | protein_coding | TCGA-A8-A09W-01 | Breast | breast invasive carcinoma | Female | >=65 | III/IV | Unknown | Unknown | SD | ||
| TOX4 | deletion | Frame_Shift_Del | c.1665_1672delNNNNNNNN | p.Val556GlyfsTer20 | p.V556Gfs*20 | O94842 | protein_coding | TCGA-BH-A0BZ-01 | Breast | breast invasive carcinoma | Female | <65 | III/IV | Chemotherapy | doxorubicin | CR | |||
| TOX4 | SNV | Missense_Mutation | novel | c.1261C>T | p.Arg421Trp | p.R421W | O94842 | protein_coding | tolerated(0.14) | possibly_damaging(0.853) | TCGA-C5-A8XH-01 | Cervix | cervical & endocervical cancer | Female | <65 | I/II | Unknown | Unknown | SD |
| TOX4 | SNV | Missense_Mutation | c.1639N>A | p.Glu547Lys | p.E547K | O94842 | protein_coding | deleterious(0.03) | benign(0.114) | TCGA-EK-A2RC-01 | Cervix | cervical & endocervical cancer | Female | <65 | I/II | Unknown | Unknown | SD |
| Page: 1 2 3 4 5 6 7 |
Top |
Related drugs of malignant transformation related genes |
| Identification of chemicals and drugs interact with genes involved in malignant transfromation |
| (DGIdb 4.0) |
| Entrez ID | Symbol | Category | Interaction Types | Drug Claim Name | Drug Name | PMIDs |
| Page: 1 |

Copyright 2023-Present -The University of Texas Health Science Center at Houston |