
|
|||||
|
 | |
| |
| |
| |
| |
| |
|
Gene: TOX3 |
Gene summary for TOX3 |
| Gene information | Species | Human | Gene symbol | TOX3 | Gene ID | 27324 |
| Gene name | TOX high mobility group box family member 3 | |
| Gene Alias | CAGF9 | |
| Cytomap | 16q12.1 | |
| Gene Type | protein-coding | GO ID | GO:0006139 | UniProtAcc | O15405 |
Top |
Malignant transformation analysis |
| Identification of the aberrant gene expression in precancerous and cancerous lesions by comparing the gene expression of stem-like cells in diseased tissues with normal stem cells |
| Entrez ID | Symbol | Replicates | Species | Organ | Tissue | Adj P-value | Log2FC | Malignancy |
| 27324 | TOX3 | HTA11_3410_2000001011 | Human | Colorectum | AD | 1.35e-38 | -8.86e-01 | 0.0155 |
| 27324 | TOX3 | HTA11_2487_2000001011 | Human | Colorectum | SER | 2.32e-06 | -4.02e-01 | -0.1808 |
| 27324 | TOX3 | HTA11_2951_2000001011 | Human | Colorectum | AD | 2.89e-06 | -8.57e-01 | 0.0216 |
| 27324 | TOX3 | HTA11_1938_2000001011 | Human | Colorectum | AD | 8.17e-07 | -5.13e-01 | -0.0811 |
| 27324 | TOX3 | HTA11_78_2000001011 | Human | Colorectum | AD | 1.60e-06 | -5.52e-01 | -0.1088 |
| 27324 | TOX3 | HTA11_3361_2000001011 | Human | Colorectum | AD | 6.33e-09 | -6.72e-01 | -0.1207 |
| 27324 | TOX3 | HTA11_83_2000001011 | Human | Colorectum | SER | 2.84e-05 | -4.22e-01 | -0.1526 |
| 27324 | TOX3 | HTA11_696_2000001011 | Human | Colorectum | AD | 8.44e-11 | -4.16e-01 | -0.1464 |
| 27324 | TOX3 | HTA11_866_2000001011 | Human | Colorectum | AD | 1.07e-18 | -5.35e-01 | -0.1001 |
| 27324 | TOX3 | HTA11_1391_2000001011 | Human | Colorectum | AD | 5.29e-15 | -6.18e-01 | -0.059 |
| 27324 | TOX3 | HTA11_5212_2000001011 | Human | Colorectum | AD | 6.76e-05 | -5.18e-01 | -0.2061 |
| 27324 | TOX3 | HTA11_5216_2000001011 | Human | Colorectum | SER | 1.37e-03 | -5.07e-01 | -0.1462 |
| 27324 | TOX3 | HTA11_9341_2000001011 | Human | Colorectum | SER | 2.91e-04 | -6.65e-01 | -0.00410000000000005 |
| 27324 | TOX3 | HTA11_7862_2000001011 | Human | Colorectum | AD | 8.54e-04 | -5.52e-01 | -0.0179 |
| 27324 | TOX3 | HTA11_866_3004761011 | Human | Colorectum | AD | 2.04e-21 | -6.69e-01 | 0.096 |
| 27324 | TOX3 | HTA11_4255_2000001011 | Human | Colorectum | SER | 3.63e-02 | -4.42e-01 | 0.0446 |
| 27324 | TOX3 | HTA11_9408_2000001011 | Human | Colorectum | AD | 6.05e-03 | -7.98e-01 | 0.0451 |
| 27324 | TOX3 | HTA11_8622_2000001021 | Human | Colorectum | SER | 4.93e-05 | -5.93e-01 | 0.0528 |
| 27324 | TOX3 | HTA11_10623_2000001011 | Human | Colorectum | AD | 3.21e-10 | -4.32e-01 | -0.0177 |
| 27324 | TOX3 | HTA11_10711_2000001011 | Human | Colorectum | AD | 4.46e-21 | -8.79e-01 | 0.0338 |
| Page: 1 2 3 4 |
| Tissue | Expression Dynamics | Abbreviation |
| Colorectum (GSE201348) |  | FAP: Familial adenomatous polyposis |
| CRC: Colorectal cancer | ||
| Colorectum (HTA11) |  | AD: Adenomas |
| SER: Sessile serrated lesions | ||
| MSI-H: Microsatellite-high colorectal cancer | ||
| MSS: Microsatellite stable colorectal cancer | ||
| Liver | 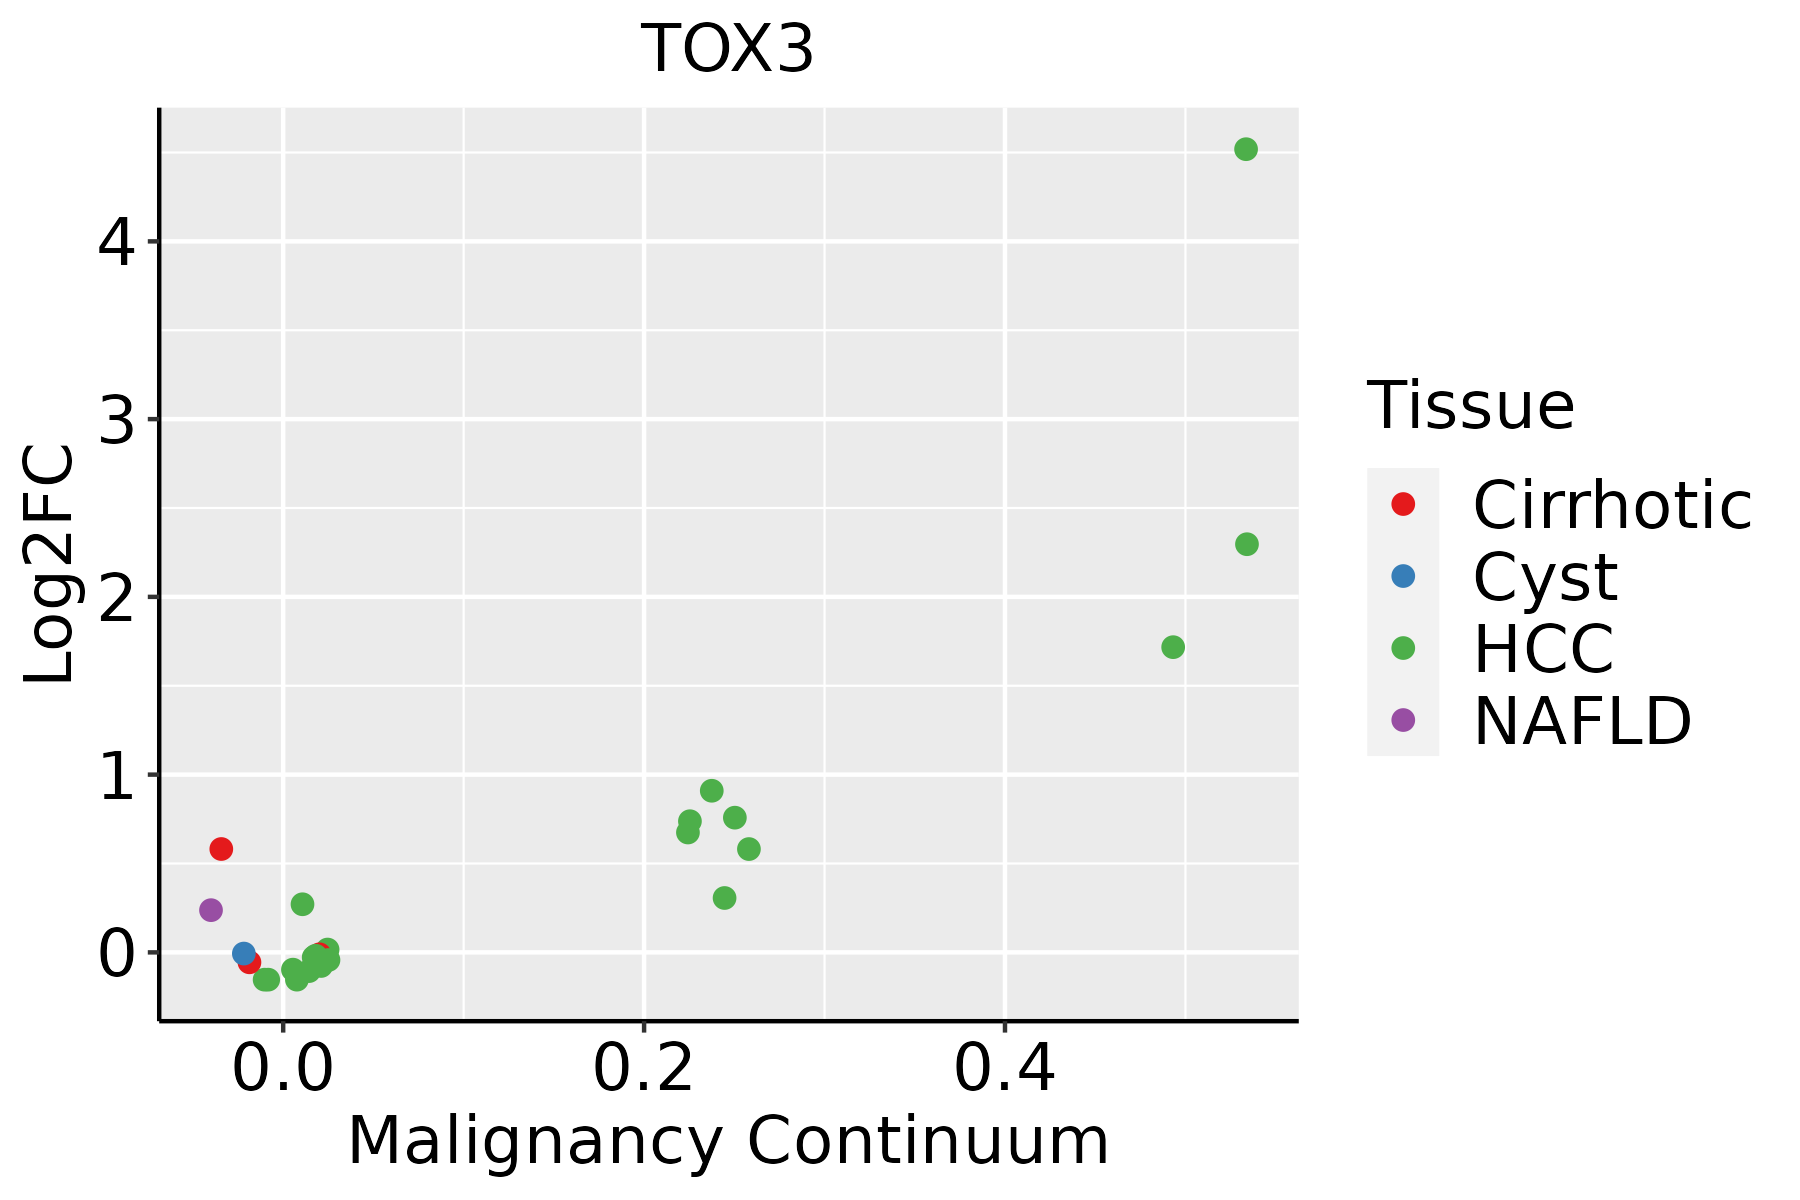 | HCC: Hepatocellular carcinoma |
| NAFLD: Non-alcoholic fatty liver disease |
| ∗log2FC in expression of this searched gene in stem-like cells from each diseased tissue sample relative to stem-like cells in normal samples in each tissue plotted against the malignancy continuum. Samples are colored based on if they are from different disease stage. |
Top |
Malignant transformation related pathway analysis |
| Find out the enriched GO biological processes and KEGG pathways involved in transition from healthy to precancer to cancer |
| Tissue | Disease Stage | Enriched GO biological Processes |
| Colorectum | AD |  |
| Colorectum | SER |  |
| Colorectum | MSS |  |
| Colorectum | MSI-H |  |
| Colorectum | FAP |  |
| ∗Top 15 enriched GO BP terms are showed in the bar plot of each disease state in each tissue. Each row represents a significant GO biological process which is colored according to the -log10(p.adjust). |
| Page: 1 2 3 4 5 6 7 8 9 |
| GO ID | Tissue | Disease Stage | Description | Gene Ratio | Bg Ratio | pvalue | p.adjust | Count |
| GO:0070997 | Colorectum | AD | neuron death | 114/3918 | 361/18723 | 1.13e-06 | 3.72e-05 | 114 |
| GO:1901214 | Colorectum | AD | regulation of neuron death | 99/3918 | 319/18723 | 1.26e-05 | 2.76e-04 | 99 |
| GO:0051402 | Colorectum | AD | neuron apoptotic process | 77/3918 | 246/18723 | 8.07e-05 | 1.28e-03 | 77 |
| GO:1901215 | Colorectum | AD | negative regulation of neuron death | 67/3918 | 208/18723 | 8.81e-05 | 1.35e-03 | 67 |
| GO:0043523 | Colorectum | AD | regulation of neuron apoptotic process | 64/3918 | 212/18723 | 8.95e-04 | 8.63e-03 | 64 |
| GO:0043524 | Colorectum | AD | negative regulation of neuron apoptotic process | 43/3918 | 145/18723 | 8.04e-03 | 4.73e-02 | 43 |
| GO:00709971 | Colorectum | SER | neuron death | 84/2897 | 361/18723 | 5.76e-05 | 1.35e-03 | 84 |
| GO:00514021 | Colorectum | SER | neuron apoptotic process | 60/2897 | 246/18723 | 1.65e-04 | 3.13e-03 | 60 |
| GO:19012141 | Colorectum | SER | regulation of neuron death | 71/2897 | 319/18723 | 7.95e-04 | 1.00e-02 | 71 |
| GO:19012151 | Colorectum | SER | negative regulation of neuron death | 49/2897 | 208/18723 | 1.40e-03 | 1.53e-02 | 49 |
| GO:00435231 | Colorectum | SER | regulation of neuron apoptotic process | 48/2897 | 212/18723 | 3.63e-03 | 3.04e-02 | 48 |
| GO:00709972 | Colorectum | MSS | neuron death | 97/3467 | 361/18723 | 5.21e-05 | 9.31e-04 | 97 |
| GO:19012142 | Colorectum | MSS | regulation of neuron death | 83/3467 | 319/18723 | 5.28e-04 | 5.99e-03 | 83 |
| GO:00514022 | Colorectum | MSS | neuron apoptotic process | 66/3467 | 246/18723 | 7.94e-04 | 8.36e-03 | 66 |
| GO:19012152 | Colorectum | MSS | negative regulation of neuron death | 53/3467 | 208/18723 | 7.60e-03 | 4.77e-02 | 53 |
| GO:00709974 | Colorectum | FAP | neuron death | 81/2622 | 361/18723 | 8.35e-06 | 2.46e-04 | 81 |
| GO:00514024 | Colorectum | FAP | neuron apoptotic process | 55/2622 | 246/18723 | 2.42e-04 | 3.37e-03 | 55 |
| GO:19012144 | Colorectum | FAP | regulation of neuron death | 67/2622 | 319/18723 | 3.73e-04 | 4.63e-03 | 67 |
| GO:19012153 | Colorectum | FAP | negative regulation of neuron death | 46/2622 | 208/18723 | 9.52e-04 | 9.42e-03 | 46 |
| GO:00435233 | Colorectum | FAP | regulation of neuron apoptotic process | 43/2622 | 212/18723 | 7.28e-03 | 4.38e-02 | 43 |
| Page: 1 2 |
| Pathway ID | Tissue | Disease Stage | Description | Gene Ratio | Bg Ratio | pvalue | p.adjust | qvalue | Count |
| Page: 1 |
Top |
Cell-cell communication analysis |
| Identification of potential cell-cell interactions between two cell types and their ligand-receptor pairs for different disease states |
| Ligand | Receptor | LRpair | Pathway | Tissue | Disease Stage |
| Page: 1 |
Top |
Single-cell gene regulatory network inference analysis |
| Find out the significant the regulons (TFs) and the target genes of each regulon across cell types for different disease states |
| TF | Cell Type | Tissue | Disease Stage | Target Gene | RSS | Regulon Activity |
| ∗The dot plots of a searched regulon are shown for all cell subpopulations in each disease state of each tissue based on the regulon specific score inferred using pySCENIC and by calculating the average expression. |
| Page: 1 |
Top |
Somatic mutation of malignant transformation related genes |
| Annotation of somatic variants for genes involved in malignant transformation |
| Hugo Symbol | Variant Class | Variant Classification | dbSNP RS | HGVSc | HGVSp | HGVSp Short | SWISSPROT | BIOTYPE | SIFT | PolyPhen | Tumor Sample Barcode | Tissue | Histology | Sex | Age | Stage | Therapy Types | Drugs | Outcome |
| TOX3 | SNV | Missense_Mutation | c.1223N>T | p.Pro408Leu | p.P408L | O15405 | protein_coding | tolerated_low_confidence(0.06) | benign(0.321) | TCGA-A8-A07G-01 | Breast | breast invasive carcinoma | Female | >=65 | I/II | Chemotherapy | 5-fluorouracil | CR | |
| TOX3 | SNV | Missense_Mutation | c.193G>A | p.Glu65Lys | p.E65K | O15405 | protein_coding | deleterious(0) | probably_damaging(0.981) | TCGA-AN-A046-01 | Breast | breast invasive carcinoma | Female | >=65 | I/II | Unknown | Unknown | SD | |
| TOX3 | SNV | Missense_Mutation | rs573103587 | c.439N>T | p.Arg147Trp | p.R147W | O15405 | protein_coding | deleterious(0.05) | possibly_damaging(0.446) | TCGA-D8-A1Y1-01 | Breast | breast invasive carcinoma | Female | >=65 | III/IV | Hormone Therapy | tamoxiphen | PD |
| TOX3 | SNV | Missense_Mutation | c.99N>A | p.Asn33Lys | p.N33K | O15405 | protein_coding | deleterious_low_confidence(0.01) | benign(0.265) | TCGA-DS-A1OD-01 | Cervix | cervical & endocervical cancer | Female | <65 | I/II | Chemotherapy | cisplatin | SD | |
| TOX3 | SNV | Missense_Mutation | c.214C>T | p.Pro72Ser | p.P72S | O15405 | protein_coding | deleterious(0.01) | probably_damaging(0.941) | TCGA-EK-A3GK-01 | Cervix | cervical & endocervical cancer | Female | <65 | I/II | Unknown | Unknown | SD | |
| TOX3 | SNV | Missense_Mutation | c.1270G>T | p.Val424Phe | p.V424F | O15405 | protein_coding | deleterious_low_confidence(0) | benign(0.368) | TCGA-4N-A93T-01 | Colorectum | colon adenocarcinoma | Male | >=65 | III/IV | Chemotherapy | xeloda | SD | |
| TOX3 | SNV | Missense_Mutation | c.1057A>T | p.Thr353Ser | p.T353S | O15405 | protein_coding | tolerated_low_confidence(0.73) | benign(0) | TCGA-A6-A565-01 | Colorectum | colon adenocarcinoma | Female | <65 | III/IV | Unspecific | 5FU | PD | |
| TOX3 | SNV | Missense_Mutation | c.193G>A | p.Glu65Lys | p.E65K | O15405 | protein_coding | deleterious(0) | probably_damaging(0.981) | TCGA-AA-3510-01 | Colorectum | colon adenocarcinoma | Male | >=65 | I/II | Unknown | Unknown | SD | |
| TOX3 | SNV | Missense_Mutation | c.1190N>A | p.Ile397Asn | p.I397N | O15405 | protein_coding | deleterious_low_confidence(0) | benign(0.347) | TCGA-AA-3811-01 | Colorectum | colon adenocarcinoma | Female | >=65 | III/IV | Unknown | Unknown | PD | |
| TOX3 | SNV | Missense_Mutation | c.968G>A | p.Arg323Lys | p.R323K | O15405 | protein_coding | tolerated(0.09) | possibly_damaging(0.831) | TCGA-AD-6895-01 | Colorectum | colon adenocarcinoma | Male | >=65 | III/IV | Unknown | Unknown | SD |
| Page: 1 2 3 4 5 6 7 |
Top |
Related drugs of malignant transformation related genes |
| Identification of chemicals and drugs interact with genes involved in malignant transfromation |
| (DGIdb 4.0) |
| Entrez ID | Symbol | Category | Interaction Types | Drug Claim Name | Drug Name | PMIDs |
| Page: 1 |

Copyright 2023-Present -The University of Texas Health Science Center at Houston |