
|
|||||
|
 | |
| |
| |
| |
| |
| |
|
Gene: TOX2 |
Gene summary for TOX2 |
| Gene information | Species | Human | Gene symbol | TOX2 | Gene ID | 84969 |
| Gene name | TOX high mobility group box family member 2 | |
| Gene Alias | C20orf100 | |
| Cytomap | 20q13.12 | |
| Gene Type | protein-coding | GO ID | GO:0006139 | UniProtAcc | Q96NM4 |
Top |
Malignant transformation analysis |
| Identification of the aberrant gene expression in precancerous and cancerous lesions by comparing the gene expression of stem-like cells in diseased tissues with normal stem cells |
| Entrez ID | Symbol | Replicates | Species | Organ | Tissue | Adj P-value | Log2FC | Malignancy |
| 84969 | TOX2 | P2T-E | Human | Esophagus | ESCC | 3.95e-03 | 1.60e-01 | 0.1177 |
| 84969 | TOX2 | P4T-E | Human | Esophagus | ESCC | 1.29e-02 | 1.12e-01 | 0.1323 |
| 84969 | TOX2 | P8T-E | Human | Esophagus | ESCC | 1.32e-02 | 1.47e-01 | 0.0889 |
| 84969 | TOX2 | P10T-E | Human | Esophagus | ESCC | 5.24e-07 | 2.02e-01 | 0.116 |
| 84969 | TOX2 | P11T-E | Human | Esophagus | ESCC | 1.88e-13 | 5.16e-01 | 0.1426 |
| 84969 | TOX2 | P15T-E | Human | Esophagus | ESCC | 2.95e-12 | 2.73e-01 | 0.1149 |
| 84969 | TOX2 | P17T-E | Human | Esophagus | ESCC | 1.11e-04 | 2.12e-01 | 0.1278 |
| 84969 | TOX2 | P19T-E | Human | Esophagus | ESCC | 4.41e-02 | 2.06e-01 | 0.1662 |
| 84969 | TOX2 | P20T-E | Human | Esophagus | ESCC | 6.29e-03 | 9.71e-02 | 0.1124 |
| 84969 | TOX2 | P24T-E | Human | Esophagus | ESCC | 4.00e-06 | 1.32e-01 | 0.1287 |
| 84969 | TOX2 | P26T-E | Human | Esophagus | ESCC | 9.87e-09 | 1.78e-01 | 0.1276 |
| 84969 | TOX2 | P31T-E | Human | Esophagus | ESCC | 1.35e-15 | 3.43e-01 | 0.1251 |
| 84969 | TOX2 | P32T-E | Human | Esophagus | ESCC | 4.38e-09 | 2.11e-01 | 0.1666 |
| 84969 | TOX2 | P40T-E | Human | Esophagus | ESCC | 1.59e-02 | 1.62e-01 | 0.109 |
| 84969 | TOX2 | P47T-E | Human | Esophagus | ESCC | 1.19e-03 | 6.75e-02 | 0.1067 |
| 84969 | TOX2 | P49T-E | Human | Esophagus | ESCC | 7.22e-13 | 8.67e-01 | 0.1768 |
| 84969 | TOX2 | P52T-E | Human | Esophagus | ESCC | 1.18e-15 | 3.61e-01 | 0.1555 |
| 84969 | TOX2 | P54T-E | Human | Esophagus | ESCC | 1.61e-04 | 1.80e-01 | 0.0975 |
| 84969 | TOX2 | P61T-E | Human | Esophagus | ESCC | 3.98e-07 | 2.17e-01 | 0.099 |
| 84969 | TOX2 | P62T-E | Human | Esophagus | ESCC | 3.35e-08 | 2.40e-01 | 0.1302 |
| Page: 1 2 |
| Tissue | Expression Dynamics | Abbreviation |
| Esophagus |  | ESCC: Esophageal squamous cell carcinoma |
| HGIN: High-grade intraepithelial neoplasias | ||
| LGIN: Low-grade intraepithelial neoplasias | ||
| Thyroid | 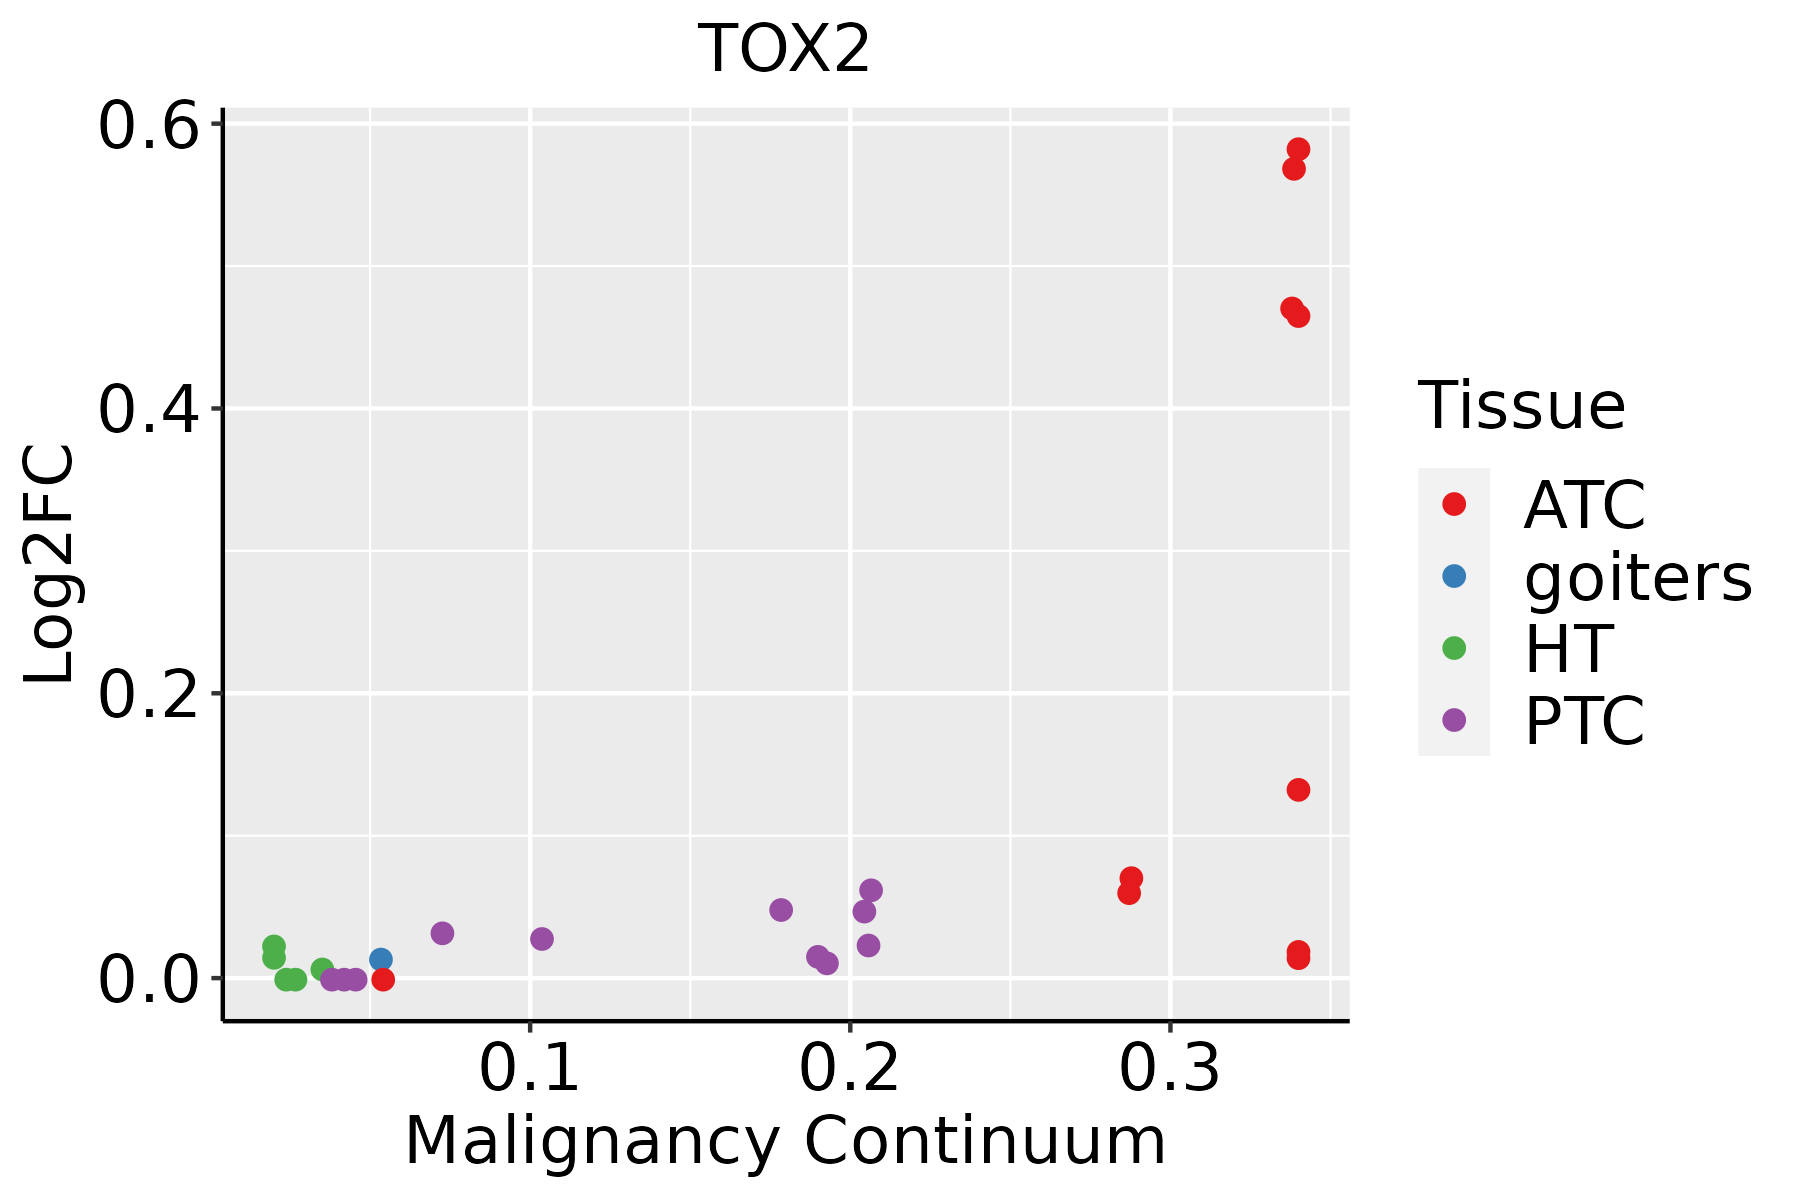 | ATC: Anaplastic thyroid cancer |
| HT: Hashimoto's thyroiditis | ||
| PTC: Papillary thyroid cancer |
| ∗log2FC in expression of this searched gene in stem-like cells from each diseased tissue sample relative to stem-like cells in normal samples in each tissue plotted against the malignancy continuum. Samples are colored based on if they are from different disease stage. |
Top |
Malignant transformation related pathway analysis |
| Find out the enriched GO biological processes and KEGG pathways involved in transition from healthy to precancer to cancer |
| Tissue | Disease Stage | Enriched GO biological Processes |
| Colorectum | AD |  |
| Colorectum | SER |  |
| Colorectum | MSS |  |
| Colorectum | MSI-H |  |
| Colorectum | FAP |  |
| ∗Top 15 enriched GO BP terms are showed in the bar plot of each disease state in each tissue. Each row represents a significant GO biological process which is colored according to the -log10(p.adjust). |
| Page: 1 2 3 4 5 6 7 8 9 |
| GO ID | Tissue | Disease Stage | Description | Gene Ratio | Bg Ratio | pvalue | p.adjust | Count |
| GO:00018908 | Cervix | CC | placenta development | 40/2311 | 144/18723 | 4.59e-07 | 1.77e-05 | 40 |
| GO:00614588 | Cervix | CC | reproductive system development | 87/2311 | 427/18723 | 1.37e-06 | 4.55e-05 | 87 |
| GO:00486088 | Cervix | CC | reproductive structure development | 86/2311 | 424/18723 | 1.90e-06 | 5.97e-05 | 86 |
| GO:00075654 | Cervix | CC | female pregnancy | 43/2311 | 193/18723 | 7.62e-05 | 1.04e-03 | 43 |
| GO:00447064 | Cervix | CC | multi-multicellular organism process | 45/2311 | 220/18723 | 4.14e-04 | 4.21e-03 | 45 |
| GO:00601353 | Cervix | CC | maternal process involved in female pregnancy | 15/2311 | 62/18723 | 7.30e-03 | 3.92e-02 | 15 |
| GO:0001890 | Colorectum | AD | placenta development | 51/3918 | 144/18723 | 3.99e-05 | 7.16e-04 | 51 |
| GO:0061458 | Colorectum | AD | reproductive system development | 116/3918 | 427/18723 | 1.11e-03 | 1.01e-02 | 116 |
| GO:0048608 | Colorectum | AD | reproductive structure development | 114/3918 | 424/18723 | 1.78e-03 | 1.47e-02 | 114 |
| GO:00018902 | Colorectum | MSS | placenta development | 51/3467 | 144/18723 | 1.10e-06 | 3.77e-05 | 51 |
| GO:00614582 | Colorectum | MSS | reproductive system development | 115/3467 | 427/18723 | 9.86e-06 | 2.39e-04 | 115 |
| GO:00486082 | Colorectum | MSS | reproductive structure development | 113/3467 | 424/18723 | 1.94e-05 | 4.18e-04 | 113 |
| GO:0001893 | Colorectum | MSS | maternal placenta development | 13/3467 | 35/18723 | 7.38e-03 | 4.68e-02 | 13 |
| GO:00018903 | Colorectum | FAP | placenta development | 38/2622 | 144/18723 | 6.22e-05 | 1.21e-03 | 38 |
| GO:00614583 | Colorectum | FAP | reproductive system development | 85/2622 | 427/18723 | 4.30e-04 | 5.13e-03 | 85 |
| GO:00486083 | Colorectum | FAP | reproductive structure development | 84/2622 | 424/18723 | 5.40e-04 | 6.10e-03 | 84 |
| GO:00614589 | Endometrium | AEH | reproductive system development | 88/2100 | 427/18723 | 9.50e-09 | 6.41e-07 | 88 |
| GO:00486089 | Endometrium | AEH | reproductive structure development | 87/2100 | 424/18723 | 1.43e-08 | 9.12e-07 | 87 |
| GO:00018909 | Endometrium | AEH | placenta development | 39/2100 | 144/18723 | 1.07e-07 | 5.20e-06 | 39 |
| GO:00075655 | Endometrium | AEH | female pregnancy | 43/2100 | 193/18723 | 7.52e-06 | 1.80e-04 | 43 |
| Page: 1 2 3 |
| Pathway ID | Tissue | Disease Stage | Description | Gene Ratio | Bg Ratio | pvalue | p.adjust | qvalue | Count |
| Page: 1 |
Top |
Cell-cell communication analysis |
| Identification of potential cell-cell interactions between two cell types and their ligand-receptor pairs for different disease states |
| Ligand | Receptor | LRpair | Pathway | Tissue | Disease Stage |
| Page: 1 |
Top |
Single-cell gene regulatory network inference analysis |
| Find out the significant the regulons (TFs) and the target genes of each regulon across cell types for different disease states |
| TF | Cell Type | Tissue | Disease Stage | Target Gene | RSS | Regulon Activity |
| ∗The dot plots of a searched regulon are shown for all cell subpopulations in each disease state of each tissue based on the regulon specific score inferred using pySCENIC and by calculating the average expression. |
| Page: 1 |
Top |
Somatic mutation of malignant transformation related genes |
| Annotation of somatic variants for genes involved in malignant transformation |
| Hugo Symbol | Variant Class | Variant Classification | dbSNP RS | HGVSc | HGVSp | HGVSp Short | SWISSPROT | BIOTYPE | SIFT | PolyPhen | Tumor Sample Barcode | Tissue | Histology | Sex | Age | Stage | Therapy Types | Drugs | Outcome |
| TOX2 | SNV | Missense_Mutation | c.260N>G | p.Asp87Gly | p.D87G | Q96NM4 | protein_coding | deleterious(0) | probably_damaging(0.995) | TCGA-A8-A0A9-01 | Breast | breast invasive carcinoma | Female | >=65 | I/II | Hormone Therapy | anastrozole | SD | |
| TOX2 | SNV | Missense_Mutation | c.1373C>G | p.Ser458Cys | p.S458C | Q96NM4 | protein_coding | deleterious(0.02) | possibly_damaging(0.855) | TCGA-AC-A23H-01 | Breast | breast invasive carcinoma | Female | >=65 | I/II | Unknown | Unknown | PD | |
| TOX2 | SNV | Missense_Mutation | c.722N>T | p.Lys241Met | p.K241M | Q96NM4 | protein_coding | deleterious(0) | probably_damaging(0.998) | TCGA-AR-A1AP-01 | Breast | breast invasive carcinoma | Female | >=65 | I/II | Hormone Therapy | anastrozole | SD | |
| TOX2 | SNV | Missense_Mutation | novel | c.615N>A | p.Ser205Arg | p.S205R | Q96NM4 | protein_coding | deleterious(0) | probably_damaging(0.994) | TCGA-E2-A576-01 | Breast | breast invasive carcinoma | Female | >=65 | I/II | Chemotherapy | taxotere | SD |
| TOX2 | insertion | In_Frame_Ins | novel | c.680_681insTATACACATATACACACATGCACACACACT | p.Asp227_Pro228insIleHisIleTyrThrHisAlaHisThrLeu | p.D227_P228insIHIYTHAHTL | Q96NM4 | protein_coding | TCGA-AR-A0TY-01 | Breast | breast invasive carcinoma | Female | <65 | I/II | Unspecific | Paclitaxel | PD | ||
| TOX2 | insertion | Frame_Shift_Ins | novel | c.810_811insTATACACACATGCACACACACTCCAAACTTGGAAATAG | p.Ala271TyrfsTer50 | p.A271Yfs*50 | Q96NM4 | protein_coding | TCGA-B6-A0IE-01 | Breast | breast invasive carcinoma | Female | <65 | III/IV | Unknown | Unknown | PD | ||
| TOX2 | insertion | Nonsense_Mutation | novel | c.695_696insTCTATTGGGCACTAACCAGTTTCACGTGTAATTTAGTAAT | p.Lys233LeufsTer10 | p.K233Lfs*10 | Q96NM4 | protein_coding | TCGA-BH-A0AY-01 | Breast | breast invasive carcinoma | Female | <65 | I/II | Chemotherapy | SD | |||
| TOX2 | SNV | Missense_Mutation | rs755716363 | c.362N>T | p.Ser121Phe | p.S121F | Q96NM4 | protein_coding | deleterious(0) | probably_damaging(0.996) | TCGA-IR-A3LA-01 | Cervix | cervical & endocervical cancer | Female | <65 | I/II | Chemotherapy | cisplatin | CR |
| TOX2 | SNV | Missense_Mutation | c.774N>T | p.Arg258Ser | p.R258S | Q96NM4 | protein_coding | deleterious(0) | probably_damaging(0.974) | TCGA-IR-A3LK-01 | Cervix | cervical & endocervical cancer | Female | >=65 | I/II | Chemotherapy | cisplatin | PD | |
| TOX2 | SNV | Missense_Mutation | novel | c.449N>T | p.Asp150Val | p.D150V | Q96NM4 | protein_coding | deleterious(0.04) | probably_damaging(0.925) | TCGA-MY-A5BE-01 | Cervix | cervical & endocervical cancer | Female | <65 | I/II | Unknown | Unknown | SD |
| Page: 1 2 3 4 5 6 7 8 |
Top |
Related drugs of malignant transformation related genes |
| Identification of chemicals and drugs interact with genes involved in malignant transfromation |
| (DGIdb 4.0) |
| Entrez ID | Symbol | Category | Interaction Types | Drug Claim Name | Drug Name | PMIDs |
| Page: 1 |

Copyright 2023-Present -The University of Texas Health Science Center at Houston |