
|
|||||
|
 | |
| |
| |
| |
| |
| |
|
Gene: TOX |
Gene summary for TOX |
| Gene information | Species | Human | Gene symbol | TOX | Gene ID | 9760 |
| Gene name | thymocyte selection associated high mobility group box | |
| Gene Alias | TOX1 | |
| Cytomap | 8q12.1 | |
| Gene Type | protein-coding | GO ID | GO:0001775 | UniProtAcc | O94900 |
Top |
Malignant transformation analysis |
| Identification of the aberrant gene expression in precancerous and cancerous lesions by comparing the gene expression of stem-like cells in diseased tissues with normal stem cells |
| Entrez ID | Symbol | Replicates | Species | Organ | Tissue | Adj P-value | Log2FC | Malignancy |
| 9760 | TOX | HTA11_3410_2000001011 | Human | Colorectum | AD | 1.28e-31 | -7.92e-01 | 0.0155 |
| 9760 | TOX | HTA11_2487_2000001011 | Human | Colorectum | SER | 6.43e-06 | -5.56e-01 | -0.1808 |
| 9760 | TOX | HTA11_2951_2000001011 | Human | Colorectum | AD | 4.46e-04 | -8.58e-01 | 0.0216 |
| 9760 | TOX | HTA11_1938_2000001011 | Human | Colorectum | AD | 1.09e-05 | -6.39e-01 | -0.0811 |
| 9760 | TOX | HTA11_5212_2000001011 | Human | Colorectum | AD | 7.75e-06 | -8.37e-01 | -0.2061 |
| 9760 | TOX | HTA11_7862_2000001011 | Human | Colorectum | AD | 7.70e-06 | -5.67e-01 | -0.0179 |
| 9760 | TOX | HTA11_866_3004761011 | Human | Colorectum | AD | 4.98e-24 | -7.83e-01 | 0.096 |
| 9760 | TOX | HTA11_4255_2000001011 | Human | Colorectum | SER | 4.25e-02 | -6.23e-01 | 0.0446 |
| 9760 | TOX | HTA11_9408_2000001011 | Human | Colorectum | AD | 5.85e-03 | -8.68e-01 | 0.0451 |
| 9760 | TOX | HTA11_8622_2000001021 | Human | Colorectum | SER | 8.55e-07 | -6.81e-01 | 0.0528 |
| 9760 | TOX | HTA11_6801_2000001011 | Human | Colorectum | SER | 5.39e-03 | -7.51e-01 | 0.0171 |
| 9760 | TOX | HTA11_10711_2000001011 | Human | Colorectum | AD | 1.89e-14 | -8.18e-01 | 0.0338 |
| 9760 | TOX | HTA11_7696_3000711011 | Human | Colorectum | AD | 1.26e-40 | -8.93e-01 | 0.0674 |
| 9760 | TOX | HTA11_6818_2000001011 | Human | Colorectum | AD | 5.36e-11 | -8.12e-01 | 0.0112 |
| 9760 | TOX | HTA11_6818_2000001021 | Human | Colorectum | AD | 4.40e-03 | -5.25e-01 | 0.0588 |
| 9760 | TOX | HTA11_99999970781_79442 | Human | Colorectum | MSS | 2.05e-51 | -9.88e-01 | 0.294 |
| 9760 | TOX | HTA11_99999965062_69753 | Human | Colorectum | MSI-H | 3.50e-02 | 8.26e-01 | 0.3487 |
| 9760 | TOX | HTA11_99999965104_69814 | Human | Colorectum | MSS | 6.48e-20 | -9.92e-01 | 0.281 |
| 9760 | TOX | HTA11_99999971662_82457 | Human | Colorectum | MSS | 3.28e-65 | -1.12e+00 | 0.3859 |
| 9760 | TOX | HTA11_99999973899_84307 | Human | Colorectum | MSS | 1.71e-13 | -8.69e-01 | 0.2585 |
| Page: 1 2 3 4 |
| Tissue | Expression Dynamics | Abbreviation |
| Colorectum (GSE201348) |  | FAP: Familial adenomatous polyposis |
| CRC: Colorectal cancer | ||
| Colorectum (HTA11) |  | AD: Adenomas |
| SER: Sessile serrated lesions | ||
| MSI-H: Microsatellite-high colorectal cancer | ||
| MSS: Microsatellite stable colorectal cancer | ||
| Lung | 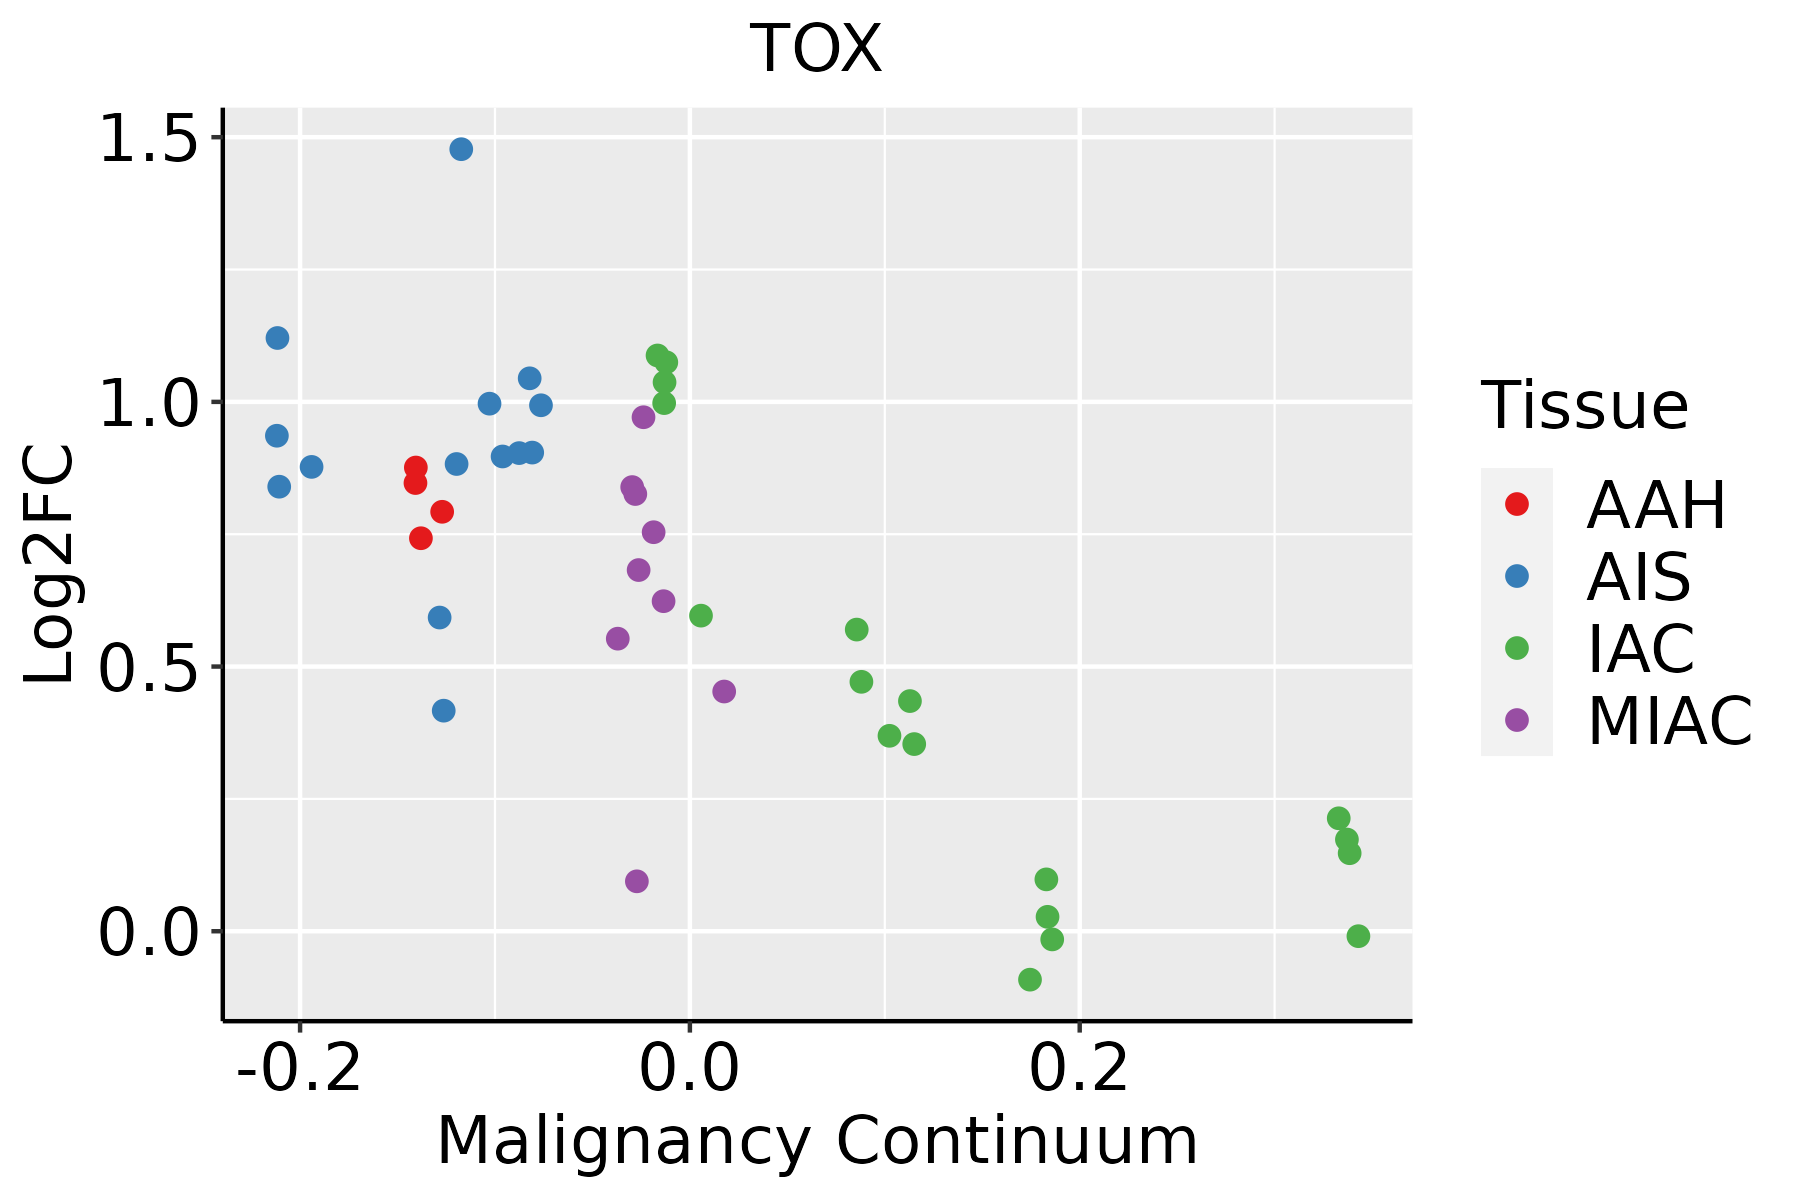 | AAH: Atypical adenomatous hyperplasia |
| AIS: Adenocarcinoma in situ | ||
| IAC: Invasive lung adenocarcinoma | ||
| MIA: Minimally invasive adenocarcinoma |
| ∗log2FC in expression of this searched gene in stem-like cells from each diseased tissue sample relative to stem-like cells in normal samples in each tissue plotted against the malignancy continuum. Samples are colored based on if they are from different disease stage. |
Top |
Malignant transformation related pathway analysis |
| Find out the enriched GO biological processes and KEGG pathways involved in transition from healthy to precancer to cancer |
| Tissue | Disease Stage | Enriched GO biological Processes |
| Colorectum | AD |  |
| Colorectum | SER |  |
| Colorectum | MSS |  |
| Colorectum | MSI-H |  |
| Colorectum | FAP |  |
| ∗Top 15 enriched GO BP terms are showed in the bar plot of each disease state in each tissue. Each row represents a significant GO biological process which is colored according to the -log10(p.adjust). |
| Page: 1 2 3 4 5 6 7 8 9 |
| GO ID | Tissue | Disease Stage | Description | Gene Ratio | Bg Ratio | pvalue | p.adjust | Count |
| GO:00000412 | Breast | Precancer | transition metal ion transport | 13/1080 | 105/18723 | 7.35e-03 | 4.89e-02 | 13 |
| GO:0070839 | Breast | IDC | metal ion export | 10/1434 | 54/18723 | 7.22e-03 | 4.96e-02 | 10 |
| GO:00708391 | Breast | DCIS | metal ion export | 10/1390 | 54/18723 | 5.83e-03 | 4.18e-02 | 10 |
| GO:00018908 | Cervix | CC | placenta development | 40/2311 | 144/18723 | 4.59e-07 | 1.77e-05 | 40 |
| GO:00614588 | Cervix | CC | reproductive system development | 87/2311 | 427/18723 | 1.37e-06 | 4.55e-05 | 87 |
| GO:00486088 | Cervix | CC | reproductive structure development | 86/2311 | 424/18723 | 1.90e-06 | 5.97e-05 | 86 |
| GO:00075654 | Cervix | CC | female pregnancy | 43/2311 | 193/18723 | 7.62e-05 | 1.04e-03 | 43 |
| GO:00447064 | Cervix | CC | multi-multicellular organism process | 45/2311 | 220/18723 | 4.14e-04 | 4.21e-03 | 45 |
| GO:00601353 | Cervix | CC | maternal process involved in female pregnancy | 15/2311 | 62/18723 | 7.30e-03 | 3.92e-02 | 15 |
| GO:0051052 | Colorectum | AD | regulation of DNA metabolic process | 116/3918 | 359/18723 | 2.47e-07 | 1.00e-05 | 116 |
| GO:0051054 | Colorectum | AD | positive regulation of DNA metabolic process | 73/3918 | 201/18723 | 3.27e-07 | 1.29e-05 | 73 |
| GO:0070997 | Colorectum | AD | neuron death | 114/3918 | 361/18723 | 1.13e-06 | 3.72e-05 | 114 |
| GO:1901214 | Colorectum | AD | regulation of neuron death | 99/3918 | 319/18723 | 1.26e-05 | 2.76e-04 | 99 |
| GO:0010975 | Colorectum | AD | regulation of neuron projection development | 129/3918 | 445/18723 | 2.88e-05 | 5.37e-04 | 129 |
| GO:0001890 | Colorectum | AD | placenta development | 51/3918 | 144/18723 | 3.99e-05 | 7.16e-04 | 51 |
| GO:0006325 | Colorectum | AD | chromatin organization | 119/3918 | 409/18723 | 4.85e-05 | 8.33e-04 | 119 |
| GO:0051402 | Colorectum | AD | neuron apoptotic process | 77/3918 | 246/18723 | 8.07e-05 | 1.28e-03 | 77 |
| GO:0031346 | Colorectum | AD | positive regulation of cell projection organization | 104/3918 | 353/18723 | 8.26e-05 | 1.30e-03 | 104 |
| GO:1901215 | Colorectum | AD | negative regulation of neuron death | 67/3918 | 208/18723 | 8.81e-05 | 1.35e-03 | 67 |
| GO:0043523 | Colorectum | AD | regulation of neuron apoptotic process | 64/3918 | 212/18723 | 8.95e-04 | 8.63e-03 | 64 |
| Page: 1 2 3 4 5 6 7 8 9 10 |
| Pathway ID | Tissue | Disease Stage | Description | Gene Ratio | Bg Ratio | pvalue | p.adjust | qvalue | Count |
| Page: 1 |
Top |
Cell-cell communication analysis |
| Identification of potential cell-cell interactions between two cell types and their ligand-receptor pairs for different disease states |
| Ligand | Receptor | LRpair | Pathway | Tissue | Disease Stage |
| Page: 1 |
Top |
Single-cell gene regulatory network inference analysis |
| Find out the significant the regulons (TFs) and the target genes of each regulon across cell types for different disease states |
| TF | Cell Type | Tissue | Disease Stage | Target Gene | RSS | Regulon Activity |
| ∗The dot plots of a searched regulon are shown for all cell subpopulations in each disease state of each tissue based on the regulon specific score inferred using pySCENIC and by calculating the average expression. |
| Page: 1 |
Top |
Somatic mutation of malignant transformation related genes |
| Annotation of somatic variants for genes involved in malignant transformation |
| Hugo Symbol | Variant Class | Variant Classification | dbSNP RS | HGVSc | HGVSp | HGVSp Short | SWISSPROT | BIOTYPE | SIFT | PolyPhen | Tumor Sample Barcode | Tissue | Histology | Sex | Age | Stage | Therapy Types | Drugs | Outcome |
| TOX | SNV | Missense_Mutation | rs764849044 | c.1325N>G | p.Gln442Arg | p.Q442R | O94900 | protein_coding | tolerated(0.14) | probably_damaging(0.932) | TCGA-BH-A0RX-01 | Breast | breast invasive carcinoma | Female | <65 | I/II | Chemotherapy | fluorouracil | SD |
| TOX | SNV | Missense_Mutation | c.820G>T | p.Asp274Tyr | p.D274Y | O94900 | protein_coding | deleterious(0) | probably_damaging(1) | TCGA-E2-A10C-01 | Breast | breast invasive carcinoma | Female | <65 | I/II | Chemotherapy | cytoxan | SD | |
| TOX | insertion | Nonsense_Mutation | novel | c.17_18insAGGA | p.Tyr6Ter | p.Y6* | O94900 | protein_coding | TCGA-A8-A06Q-01 | Breast | breast invasive carcinoma | Female | <65 | III/IV | Unknown | Unknown | SD | ||
| TOX | insertion | Frame_Shift_Ins | novel | c.15_16insGCTCGGATTCTTTCCTTCCTGCTGTTCGCGGC | p.Tyr6AlafsTer48 | p.Y6Afs*48 | O94900 | protein_coding | TCGA-A8-A06Q-01 | Breast | breast invasive carcinoma | Female | <65 | III/IV | Unknown | Unknown | SD | ||
| TOX | insertion | Frame_Shift_Ins | novel | c.1082_1083insAAATAATATT | p.Pro362AsnfsTer33 | p.P362Nfs*33 | O94900 | protein_coding | TCGA-B6-A0IA-01 | Breast | breast invasive carcinoma | Female | <65 | I/II | Unknown | Unknown | SD | ||
| TOX | insertion | In_Frame_Ins | novel | c.1081_1082insTGTCATTTGCTAAATTGAAAGAAAGTAAAATAATGT | p.Gly361delinsValSerPheAlaLysLeuLysGluSerLysIleMetTrp | p.G361delinsVSFAKLKESKIMW | O94900 | protein_coding | TCGA-B6-A0IA-01 | Breast | breast invasive carcinoma | Female | <65 | I/II | Unknown | Unknown | SD | ||
| TOX | SNV | Missense_Mutation | rs751683918 | c.140N>T | p.Pro47Leu | p.P47L | O94900 | protein_coding | tolerated(0.08) | probably_damaging(0.995) | TCGA-EK-A2GZ-01 | Cervix | cervical & endocervical cancer | Female | <65 | III/IV | Unknown | Unknown | SD |
| TOX | SNV | Missense_Mutation | c.395N>A | p.Ser132Tyr | p.S132Y | O94900 | protein_coding | deleterious(0) | benign(0.103) | TCGA-FU-A40J-01 | Cervix | cervical & endocervical cancer | Female | <65 | III/IV | Chemotherapy | carboplatin | CR | |
| TOX | SNV | Missense_Mutation | c.415N>T | p.Pro139Ser | p.P139S | O94900 | protein_coding | tolerated(0.22) | benign(0) | TCGA-5M-AAT6-01 | Colorectum | colon adenocarcinoma | Female | <65 | III/IV | Unknown | Unknown | PD | |
| TOX | SNV | Missense_Mutation | rs200969018 | c.1061C>T | p.Ser354Leu | p.S354L | O94900 | protein_coding | deleterious(0.01) | benign(0.017) | TCGA-A6-6141-01 | Colorectum | colon adenocarcinoma | Male | <65 | I/II | Chemotherapy | 5-fu | SD |
| Page: 1 2 3 4 5 6 7 8 9 |
Top |
Related drugs of malignant transformation related genes |
| Identification of chemicals and drugs interact with genes involved in malignant transfromation |
| (DGIdb 4.0) |
| Entrez ID | Symbol | Category | Interaction Types | Drug Claim Name | Drug Name | PMIDs |
| Page: 1 |

Copyright 2023-Present -The University of Texas Health Science Center at Houston |