
|
|||||
|
 | |
| |
| |
| |
| |
| |
|
Gene: TOR3A |
Gene summary for TOR3A |
| Gene information | Species | Human | Gene symbol | TOR3A | Gene ID | 64222 |
| Gene name | torsin family 3 member A | |
| Gene Alias | ADIR | |
| Cytomap | 1q25.2 | |
| Gene Type | protein-coding | GO ID | GO:0005575 | UniProtAcc | Q9H497 |
Top |
Malignant transformation analysis |
| Identification of the aberrant gene expression in precancerous and cancerous lesions by comparing the gene expression of stem-like cells in diseased tissues with normal stem cells |
| Entrez ID | Symbol | Replicates | Species | Organ | Tissue | Adj P-value | Log2FC | Malignancy |
| 64222 | TOR3A | LZE2T | Human | Esophagus | ESCC | 1.05e-03 | 8.81e-01 | 0.082 |
| 64222 | TOR3A | LZE4T | Human | Esophagus | ESCC | 6.19e-13 | 5.24e-01 | 0.0811 |
| 64222 | TOR3A | LZE7T | Human | Esophagus | ESCC | 1.06e-20 | 9.26e-01 | 0.0667 |
| 64222 | TOR3A | LZE24T | Human | Esophagus | ESCC | 1.52e-21 | 5.85e-01 | 0.0596 |
| 64222 | TOR3A | LZE21T | Human | Esophagus | ESCC | 1.28e-02 | 3.65e-01 | 0.0655 |
| 64222 | TOR3A | P1T-E | Human | Esophagus | ESCC | 2.83e-06 | 5.01e-01 | 0.0875 |
| 64222 | TOR3A | P2T-E | Human | Esophagus | ESCC | 5.07e-41 | 8.62e-01 | 0.1177 |
| 64222 | TOR3A | P4T-E | Human | Esophagus | ESCC | 5.71e-35 | 8.74e-01 | 0.1323 |
| 64222 | TOR3A | P5T-E | Human | Esophagus | ESCC | 4.35e-12 | 4.41e-01 | 0.1327 |
| 64222 | TOR3A | P8T-E | Human | Esophagus | ESCC | 2.64e-18 | 4.58e-01 | 0.0889 |
| 64222 | TOR3A | P9T-E | Human | Esophagus | ESCC | 1.70e-35 | 8.27e-01 | 0.1131 |
| 64222 | TOR3A | P10T-E | Human | Esophagus | ESCC | 7.75e-33 | 7.10e-01 | 0.116 |
| 64222 | TOR3A | P11T-E | Human | Esophagus | ESCC | 2.31e-11 | 5.90e-01 | 0.1426 |
| 64222 | TOR3A | P12T-E | Human | Esophagus | ESCC | 3.12e-19 | 4.64e-01 | 0.1122 |
| 64222 | TOR3A | P15T-E | Human | Esophagus | ESCC | 2.50e-42 | 1.01e+00 | 0.1149 |
| 64222 | TOR3A | P16T-E | Human | Esophagus | ESCC | 1.18e-23 | 6.30e-01 | 0.1153 |
| 64222 | TOR3A | P17T-E | Human | Esophagus | ESCC | 7.29e-08 | 3.99e-01 | 0.1278 |
| 64222 | TOR3A | P19T-E | Human | Esophagus | ESCC | 5.79e-08 | 5.65e-01 | 0.1662 |
| 64222 | TOR3A | P20T-E | Human | Esophagus | ESCC | 3.38e-29 | 5.33e-01 | 0.1124 |
| 64222 | TOR3A | P21T-E | Human | Esophagus | ESCC | 2.87e-30 | 8.15e-01 | 0.1617 |
| Page: 1 2 3 4 5 |
| Tissue | Expression Dynamics | Abbreviation |
| Esophagus | 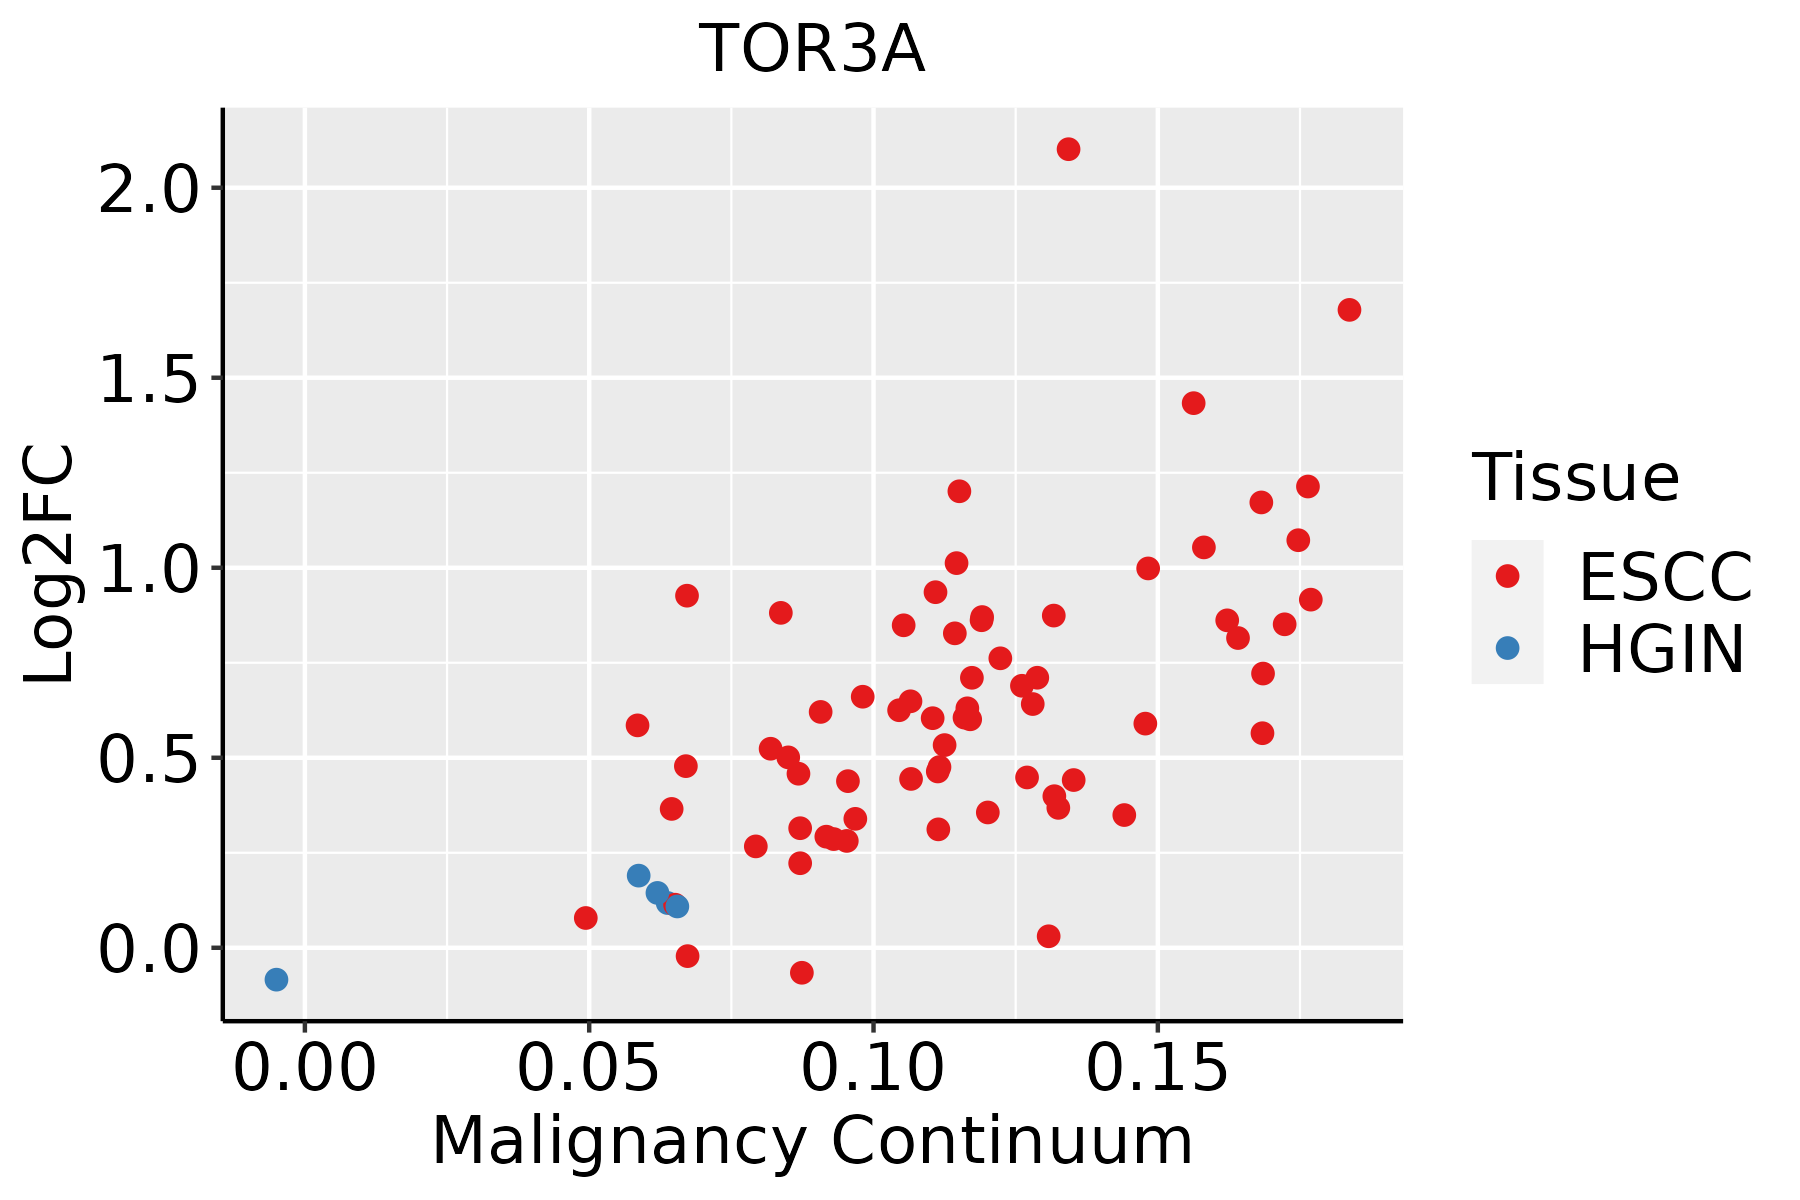 | ESCC: Esophageal squamous cell carcinoma |
| HGIN: High-grade intraepithelial neoplasias | ||
| LGIN: Low-grade intraepithelial neoplasias | ||
| Liver |  | HCC: Hepatocellular carcinoma |
| NAFLD: Non-alcoholic fatty liver disease | ||
| Oral Cavity |  | EOLP: Erosive Oral lichen planus |
| LP: leukoplakia | ||
| NEOLP: Non-erosive oral lichen planus | ||
| OSCC: Oral squamous cell carcinoma | ||
| Skin | 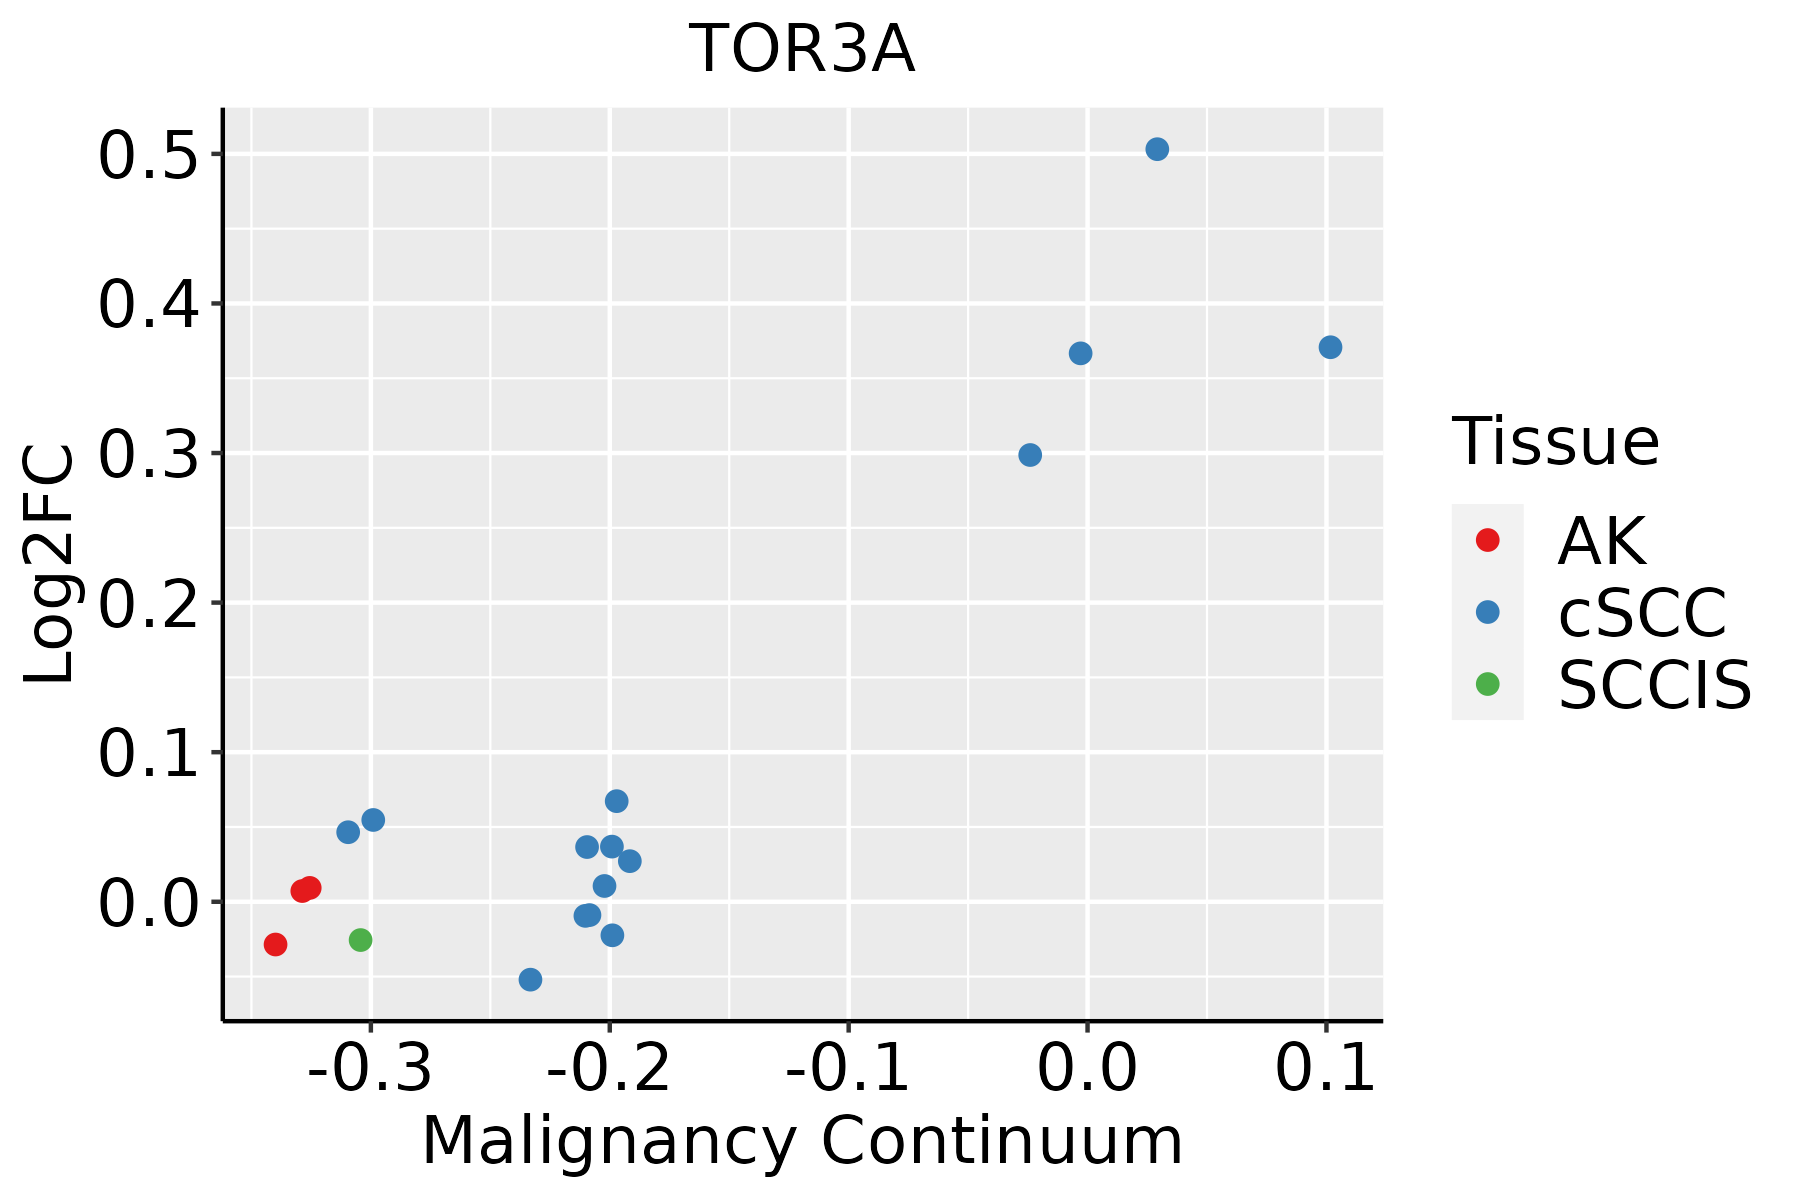 | AK: Actinic keratosis |
| cSCC: Cutaneous squamous cell carcinoma | ||
| SCCIS:squamous cell carcinoma in situ |
| ∗log2FC in expression of this searched gene in stem-like cells from each diseased tissue sample relative to stem-like cells in normal samples in each tissue plotted against the malignancy continuum. Samples are colored based on if they are from different disease stage. |
Top |
Malignant transformation related pathway analysis |
| Find out the enriched GO biological processes and KEGG pathways involved in transition from healthy to precancer to cancer |
| Tissue | Disease Stage | Enriched GO biological Processes |
| Colorectum | AD |  |
| Colorectum | SER |  |
| Colorectum | MSS |  |
| Colorectum | MSI-H |  |
| Colorectum | FAP |  |
| ∗Top 15 enriched GO BP terms are showed in the bar plot of each disease state in each tissue. Each row represents a significant GO biological process which is colored according to the -log10(p.adjust). |
| Page: 1 2 3 4 5 6 7 8 9 |
| GO ID | Tissue | Disease Stage | Description | Gene Ratio | Bg Ratio | pvalue | p.adjust | Count |
| Page: 1 |
| Pathway ID | Tissue | Disease Stage | Description | Gene Ratio | Bg Ratio | pvalue | p.adjust | qvalue | Count |
| Page: 1 |
Top |
Cell-cell communication analysis |
| Identification of potential cell-cell interactions between two cell types and their ligand-receptor pairs for different disease states |
| Ligand | Receptor | LRpair | Pathway | Tissue | Disease Stage |
| Page: 1 |
Top |
Single-cell gene regulatory network inference analysis |
| Find out the significant the regulons (TFs) and the target genes of each regulon across cell types for different disease states |
| TF | Cell Type | Tissue | Disease Stage | Target Gene | RSS | Regulon Activity |
| ∗The dot plots of a searched regulon are shown for all cell subpopulations in each disease state of each tissue based on the regulon specific score inferred using pySCENIC and by calculating the average expression. |
| Page: 1 |
Top |
Somatic mutation of malignant transformation related genes |
| Annotation of somatic variants for genes involved in malignant transformation |
| Hugo Symbol | Variant Class | Variant Classification | dbSNP RS | HGVSc | HGVSp | HGVSp Short | SWISSPROT | BIOTYPE | SIFT | PolyPhen | Tumor Sample Barcode | Tissue | Histology | Sex | Age | Stage | Therapy Types | Drugs | Outcome |
| TOR3A | SNV | Missense_Mutation | novel | c.505N>G | p.Ser169Ala | p.S169A | Q9H497 | protein_coding | tolerated(0.23) | possibly_damaging(0.873) | TCGA-AQ-A1H3-01 | Breast | breast invasive carcinoma | Female | <65 | III/IV | Chemotherapy | adriamycin | SD |
| TOR3A | SNV | Missense_Mutation | c.379G>A | p.Glu127Lys | p.E127K | Q9H497 | protein_coding | tolerated(0.46) | benign(0.015) | TCGA-C8-A12K-01 | Breast | breast invasive carcinoma | Female | >=65 | I/II | Unknown | Unknown | SD | |
| TOR3A | SNV | Missense_Mutation | c.862C>T | p.Leu288Phe | p.L288F | Q9H497 | protein_coding | deleterious(0) | possibly_damaging(0.794) | TCGA-D8-A1XC-01 | Breast | breast invasive carcinoma | Female | >=65 | III/IV | Unknown | Unknown | PD | |
| TOR3A | insertion | Frame_Shift_Ins | novel | c.479_480insA | p.Leu161ProfsTer32 | p.L161Pfs*32 | Q9H497 | protein_coding | TCGA-AO-A0JB-01 | Breast | breast invasive carcinoma | Female | <65 | III/IV | Chemotherapy | cyclophosphamide | SD | ||
| TOR3A | insertion | Nonsense_Mutation | novel | c.480_481insTCTCCCTGAGTCCCAT | p.Leu161SerfsTer3 | p.L161Sfs*3 | Q9H497 | protein_coding | TCGA-AO-A0JB-01 | Breast | breast invasive carcinoma | Female | <65 | III/IV | Chemotherapy | cyclophosphamide | SD | ||
| TOR3A | insertion | Frame_Shift_Ins | novel | c.1114_1115insCTACTAAAAAAATTAGCTGGGCATTGTGGCATGTGCCTGTA | p.Tyr372SerfsTer43 | p.Y372Sfs*43 | Q9H497 | protein_coding | TCGA-BH-A0EB-01 | Breast | breast invasive carcinoma | Female | >=65 | I/II | Hormone Therapy | arimidex | SD | ||
| TOR3A | deletion | Frame_Shift_Del | novel | c.770delC | p.Pro257LeufsTer23 | p.P257Lfs*23 | Q9H497 | protein_coding | TCGA-EW-A2FV-01 | Breast | breast invasive carcinoma | Female | <65 | III/IV | Chemotherapy | docetaxel | SD | ||
| TOR3A | deletion | Frame_Shift_Del | novel | c.1063delG | p.Glu355SerfsTer12 | p.E355Sfs*12 | Q9H497 | protein_coding | TCGA-EW-A2FV-01 | Breast | breast invasive carcinoma | Female | <65 | III/IV | Chemotherapy | docetaxel | SD | ||
| TOR3A | SNV | Missense_Mutation | c.266G>A | p.Arg89His | p.R89H | Q9H497 | protein_coding | tolerated(0.07) | benign(0.107) | TCGA-AA-3710-01 | Colorectum | colon adenocarcinoma | Female | >=65 | I/II | Unknown | Unknown | SD | |
| TOR3A | SNV | Missense_Mutation | c.557N>A | p.Arg186Gln | p.R186Q | Q9H497 | protein_coding | tolerated(0.05) | benign(0.154) | TCGA-AA-3966-01 | Colorectum | colon adenocarcinoma | Female | >=65 | I/II | Unknown | Unknown | SD |
| Page: 1 2 3 4 |
Top |
Related drugs of malignant transformation related genes |
| Identification of chemicals and drugs interact with genes involved in malignant transfromation |
| (DGIdb 4.0) |
| Entrez ID | Symbol | Category | Interaction Types | Drug Claim Name | Drug Name | PMIDs |
| Page: 1 |

Copyright 2023-Present -The University of Texas Health Science Center at Houston |