
|
|||||
|
 | |
| |
| |
| |
| |
| |
|
Gene: TOR2A |
Gene summary for TOR2A |
| Gene information | Species | Human | Gene symbol | TOR2A | Gene ID | 27433 |
| Gene name | torsin family 2 member A | |
| Gene Alias | TORP1 | |
| Cytomap | 9q34.11 | |
| Gene Type | protein-coding | GO ID | GO:0006457 | UniProtAcc | Q5JU69 |
Top |
Malignant transformation analysis |
| Identification of the aberrant gene expression in precancerous and cancerous lesions by comparing the gene expression of stem-like cells in diseased tissues with normal stem cells |
| Entrez ID | Symbol | Replicates | Species | Organ | Tissue | Adj P-value | Log2FC | Malignancy |
| 27433 | TOR2A | LZE4T | Human | Esophagus | ESCC | 9.04e-03 | 1.64e-01 | 0.0811 |
| 27433 | TOR2A | LZE20T | Human | Esophagus | ESCC | 9.76e-11 | 4.73e-01 | 0.0662 |
| 27433 | TOR2A | LZE24T | Human | Esophagus | ESCC | 1.95e-11 | 3.70e-01 | 0.0596 |
| 27433 | TOR2A | P2T-E | Human | Esophagus | ESCC | 2.78e-38 | 5.48e-01 | 0.1177 |
| 27433 | TOR2A | P4T-E | Human | Esophagus | ESCC | 4.14e-08 | 2.33e-01 | 0.1323 |
| 27433 | TOR2A | P5T-E | Human | Esophagus | ESCC | 3.50e-02 | 6.45e-02 | 0.1327 |
| 27433 | TOR2A | P8T-E | Human | Esophagus | ESCC | 2.55e-31 | 5.15e-01 | 0.0889 |
| 27433 | TOR2A | P9T-E | Human | Esophagus | ESCC | 8.01e-03 | 1.13e-01 | 0.1131 |
| 27433 | TOR2A | P10T-E | Human | Esophagus | ESCC | 7.98e-13 | 1.92e-01 | 0.116 |
| 27433 | TOR2A | P11T-E | Human | Esophagus | ESCC | 1.82e-03 | 2.14e-01 | 0.1426 |
| 27433 | TOR2A | P12T-E | Human | Esophagus | ESCC | 3.89e-12 | 2.10e-01 | 0.1122 |
| 27433 | TOR2A | P15T-E | Human | Esophagus | ESCC | 6.80e-18 | 4.11e-01 | 0.1149 |
| 27433 | TOR2A | P16T-E | Human | Esophagus | ESCC | 6.56e-15 | 2.89e-01 | 0.1153 |
| 27433 | TOR2A | P17T-E | Human | Esophagus | ESCC | 9.57e-05 | 3.21e-01 | 0.1278 |
| 27433 | TOR2A | P20T-E | Human | Esophagus | ESCC | 2.71e-05 | 1.87e-01 | 0.1124 |
| 27433 | TOR2A | P21T-E | Human | Esophagus | ESCC | 4.19e-25 | 4.25e-01 | 0.1617 |
| 27433 | TOR2A | P22T-E | Human | Esophagus | ESCC | 5.30e-21 | 3.38e-01 | 0.1236 |
| 27433 | TOR2A | P23T-E | Human | Esophagus | ESCC | 1.07e-04 | 2.12e-01 | 0.108 |
| 27433 | TOR2A | P24T-E | Human | Esophagus | ESCC | 5.30e-21 | 3.94e-01 | 0.1287 |
| 27433 | TOR2A | P26T-E | Human | Esophagus | ESCC | 7.98e-13 | 2.92e-01 | 0.1276 |
| Page: 1 2 3 4 5 |
| Tissue | Expression Dynamics | Abbreviation |
| Esophagus | 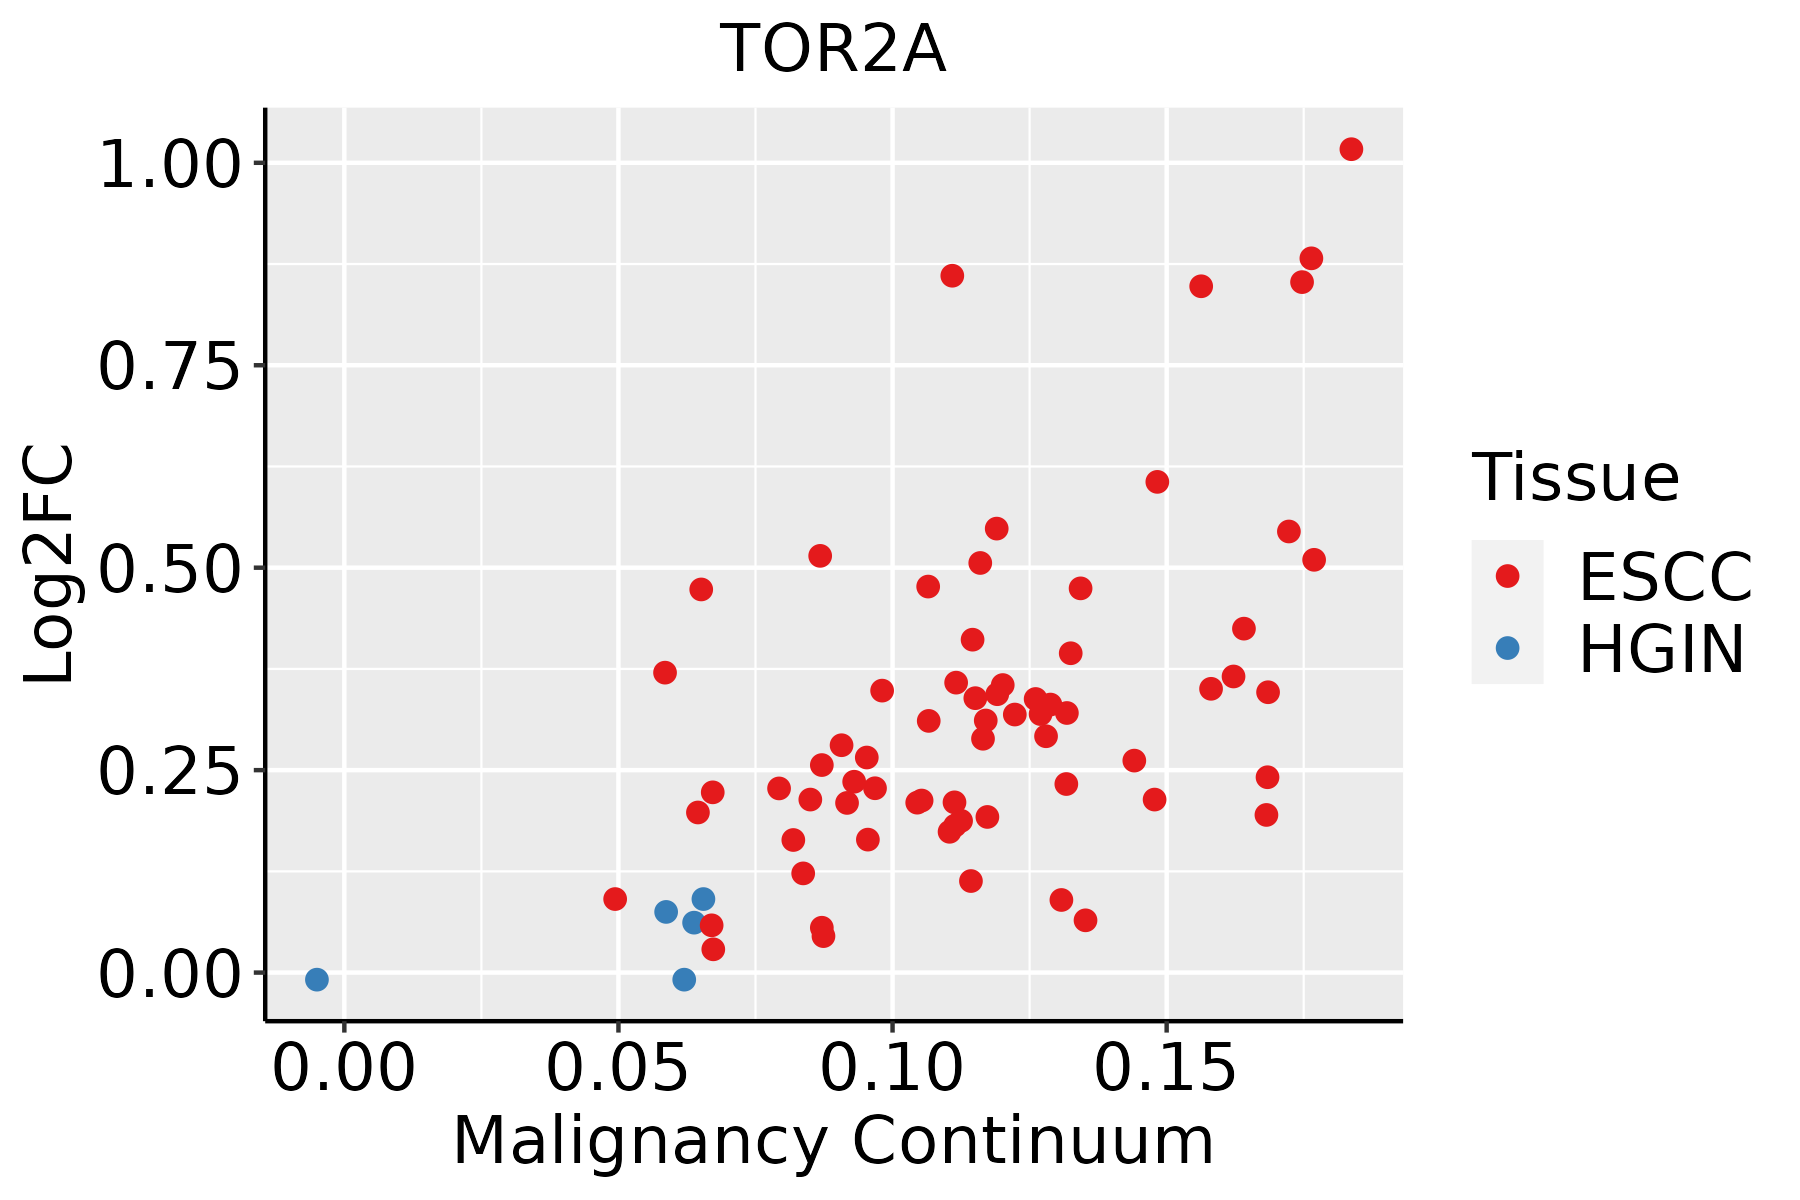 | ESCC: Esophageal squamous cell carcinoma |
| HGIN: High-grade intraepithelial neoplasias | ||
| LGIN: Low-grade intraepithelial neoplasias | ||
| Liver |  | HCC: Hepatocellular carcinoma |
| NAFLD: Non-alcoholic fatty liver disease | ||
| Oral Cavity | 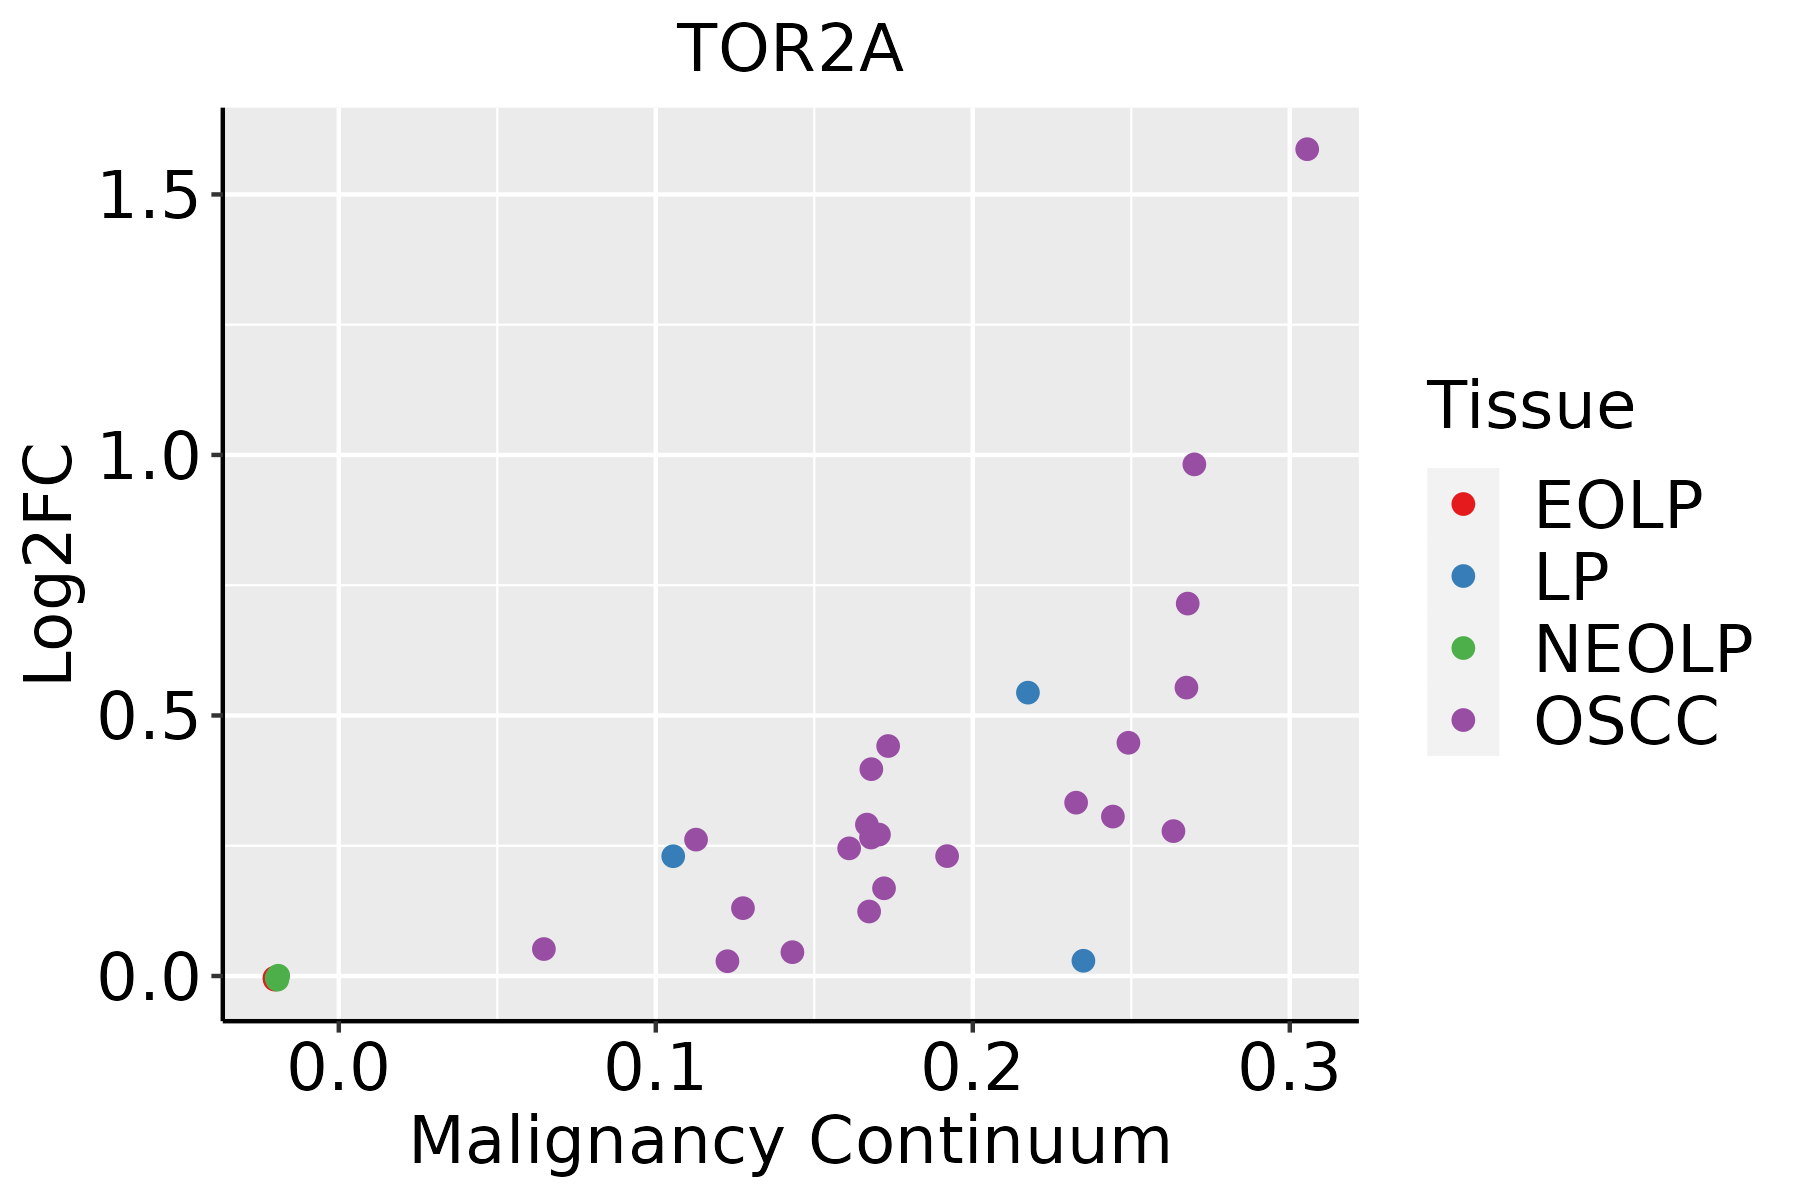 | EOLP: Erosive Oral lichen planus |
| LP: leukoplakia | ||
| NEOLP: Non-erosive oral lichen planus | ||
| OSCC: Oral squamous cell carcinoma | ||
| Skin | 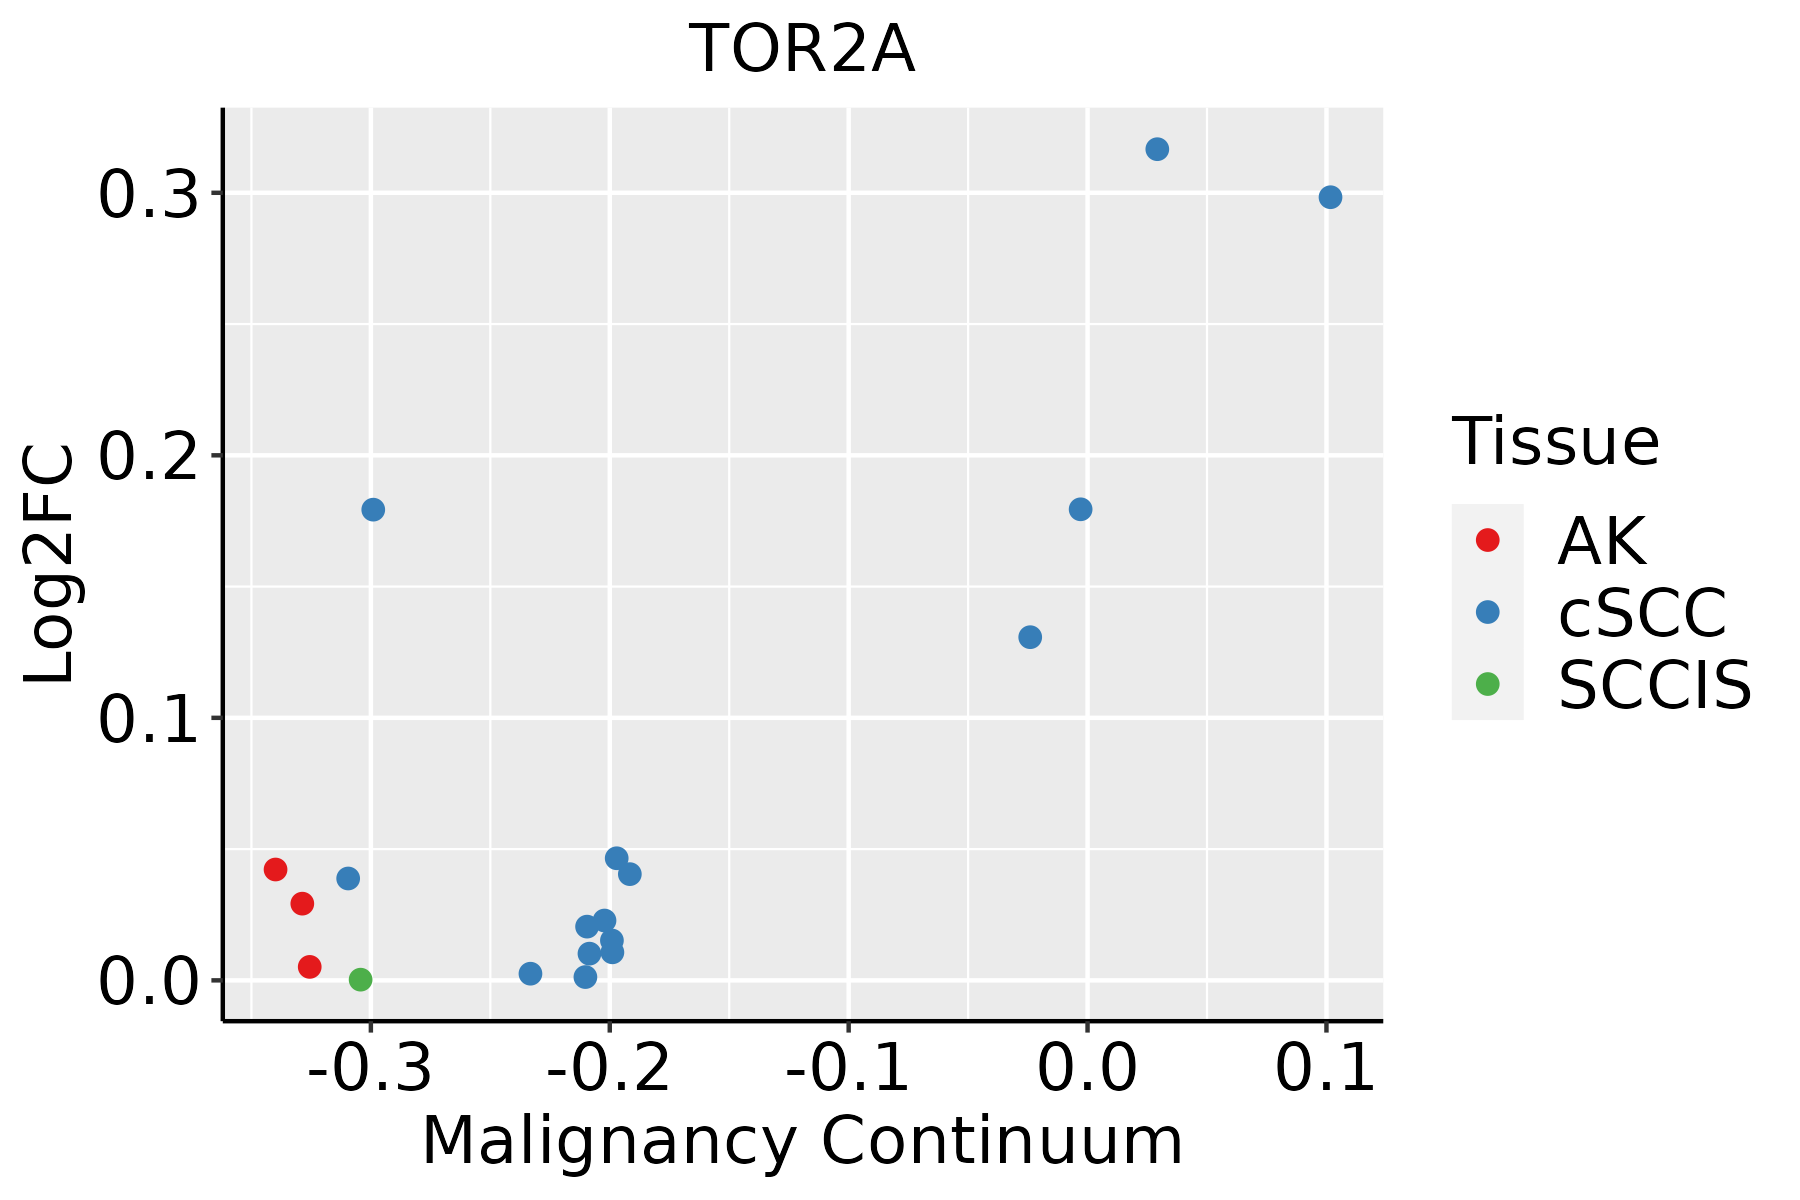 | AK: Actinic keratosis |
| cSCC: Cutaneous squamous cell carcinoma | ||
| SCCIS:squamous cell carcinoma in situ |
| ∗log2FC in expression of this searched gene in stem-like cells from each diseased tissue sample relative to stem-like cells in normal samples in each tissue plotted against the malignancy continuum. Samples are colored based on if they are from different disease stage. |
Top |
Malignant transformation related pathway analysis |
| Find out the enriched GO biological processes and KEGG pathways involved in transition from healthy to precancer to cancer |
| Tissue | Disease Stage | Enriched GO biological Processes |
| Colorectum | AD |  |
| Colorectum | SER |  |
| Colorectum | MSS |  |
| Colorectum | MSI-H |  |
| Colorectum | FAP |  |
| ∗Top 15 enriched GO BP terms are showed in the bar plot of each disease state in each tissue. Each row represents a significant GO biological process which is colored according to the -log10(p.adjust). |
| Page: 1 2 3 4 5 6 7 8 9 |
| GO ID | Tissue | Disease Stage | Description | Gene Ratio | Bg Ratio | pvalue | p.adjust | Count |
| GO:0006457110 | Esophagus | ESCC | protein folding | 163/8552 | 212/18723 | 1.13e-20 | 1.74e-18 | 163 |
| GO:0061077110 | Esophagus | ESCC | chaperone-mediated protein folding | 56/8552 | 67/18723 | 1.52e-10 | 4.36e-09 | 56 |
| GO:0006458110 | Esophagus | ESCC | 'de novo' protein folding | 36/8552 | 43/18723 | 2.90e-07 | 4.20e-06 | 36 |
| GO:0051084110 | Esophagus | ESCC | 'de novo' posttranslational protein folding | 32/8552 | 39/18723 | 3.27e-06 | 3.65e-05 | 32 |
| GO:0051085110 | Esophagus | ESCC | chaperone cofactor-dependent protein refolding | 27/8552 | 34/18723 | 6.01e-05 | 4.62e-04 | 27 |
| GO:00064577 | Liver | Cirrhotic | protein folding | 114/4634 | 212/18723 | 9.23e-20 | 2.31e-17 | 114 |
| GO:00610777 | Liver | Cirrhotic | chaperone-mediated protein folding | 40/4634 | 67/18723 | 1.24e-09 | 5.43e-08 | 40 |
| GO:00510857 | Liver | Cirrhotic | chaperone cofactor-dependent protein refolding | 19/4634 | 34/18723 | 1.01e-04 | 1.05e-03 | 19 |
| GO:00064587 | Liver | Cirrhotic | 'de novo' protein folding | 22/4634 | 43/18723 | 1.69e-04 | 1.59e-03 | 22 |
| GO:00510847 | Liver | Cirrhotic | 'de novo' posttranslational protein folding | 20/4634 | 39/18723 | 3.19e-04 | 2.77e-03 | 20 |
| GO:000645712 | Liver | HCC | protein folding | 160/7958 | 212/18723 | 1.07e-22 | 1.88e-20 | 160 |
| GO:006107712 | Liver | HCC | chaperone-mediated protein folding | 56/7958 | 67/18723 | 4.86e-12 | 2.14e-10 | 56 |
| GO:000645812 | Liver | HCC | 'de novo' protein folding | 36/7958 | 43/18723 | 3.15e-08 | 7.10e-07 | 36 |
| GO:005108412 | Liver | HCC | 'de novo' posttranslational protein folding | 32/7958 | 39/18723 | 4.73e-07 | 7.69e-06 | 32 |
| GO:005108512 | Liver | HCC | chaperone cofactor-dependent protein refolding | 27/7958 | 34/18723 | 1.24e-05 | 1.39e-04 | 27 |
| GO:000645718 | Oral cavity | OSCC | protein folding | 154/7305 | 212/18723 | 1.89e-23 | 4.60e-21 | 154 |
| GO:006107718 | Oral cavity | OSCC | chaperone-mediated protein folding | 54/7305 | 67/18723 | 3.73e-12 | 1.45e-10 | 54 |
| GO:000645818 | Oral cavity | OSCC | 'de novo' protein folding | 34/7305 | 43/18723 | 9.60e-08 | 1.66e-06 | 34 |
| GO:005108418 | Oral cavity | OSCC | 'de novo' posttranslational protein folding | 30/7305 | 39/18723 | 1.61e-06 | 2.11e-05 | 30 |
| GO:005108518 | Oral cavity | OSCC | chaperone cofactor-dependent protein refolding | 27/7305 | 34/18723 | 1.80e-06 | 2.33e-05 | 27 |
| Page: 1 2 |
| Pathway ID | Tissue | Disease Stage | Description | Gene Ratio | Bg Ratio | pvalue | p.adjust | qvalue | Count |
| Page: 1 |
Top |
Cell-cell communication analysis |
| Identification of potential cell-cell interactions between two cell types and their ligand-receptor pairs for different disease states |
| Ligand | Receptor | LRpair | Pathway | Tissue | Disease Stage |
| Page: 1 |
Top |
Single-cell gene regulatory network inference analysis |
| Find out the significant the regulons (TFs) and the target genes of each regulon across cell types for different disease states |
| TF | Cell Type | Tissue | Disease Stage | Target Gene | RSS | Regulon Activity |
| ∗The dot plots of a searched regulon are shown for all cell subpopulations in each disease state of each tissue based on the regulon specific score inferred using pySCENIC and by calculating the average expression. |
| Page: 1 |
Top |
Somatic mutation of malignant transformation related genes |
| Annotation of somatic variants for genes involved in malignant transformation |
| Hugo Symbol | Variant Class | Variant Classification | dbSNP RS | HGVSc | HGVSp | HGVSp Short | SWISSPROT | BIOTYPE | SIFT | PolyPhen | Tumor Sample Barcode | Tissue | Histology | Sex | Age | Stage | Therapy Types | Drugs | Outcome |
| TOR2A | SNV | Missense_Mutation | novel | c.269N>T | p.Ser90Phe | p.S90F | Q5JU69 | protein_coding | deleterious(0) | probably_damaging(0.999) | TCGA-4J-AA1J-01 | Cervix | cervical & endocervical cancer | Female | <65 | I/II | Unknown | Unknown | SD |
| TOR2A | SNV | Missense_Mutation | c.898N>A | p.Glu300Lys | p.E300K | Q5JU69 | protein_coding | tolerated(1) | possibly_damaging(0.549) | TCGA-DS-A1OC-01 | Cervix | cervical & endocervical cancer | Female | <65 | I/II | Chemotherapy | gemcitabine | SD | |
| TOR2A | SNV | Missense_Mutation | rs752309151 | c.766G>A | p.Ala256Thr | p.A256T | Q5JU69 | protein_coding | deleterious(0.03) | benign(0.017) | TCGA-A6-2686-01 | Colorectum | colon adenocarcinoma | Female | >=65 | I/II | Unknown | Unknown | SD |
| TOR2A | SNV | Missense_Mutation | rs200744648 | c.686N>T | p.Pro229Leu | p.P229L | Q5JU69 | protein_coding | tolerated(0.1) | benign(0.001) | TCGA-CK-4951-01 | Colorectum | colon adenocarcinoma | Female | >=65 | I/II | Unknown | Unknown | PD |
| TOR2A | SNV | Missense_Mutation | rs376074923 | c.568N>T | p.Arg190Cys | p.R190C | Q5JU69 | protein_coding | deleterious(0) | probably_damaging(0.998) | TCGA-AG-4022-01 | Colorectum | rectum adenocarcinoma | Female | <65 | I/II | Chemotherapy | 5-fluorouracil | CR |
| TOR2A | SNV | Missense_Mutation | novel | c.601N>A | p.Gly201Ser | p.G201S | Q5JU69 | protein_coding | deleterious(0) | probably_damaging(0.999) | TCGA-AX-A2HD-01 | Endometrium | uterine corpus endometrioid carcinoma | Female | >=65 | III/IV | Unknown | Unknown | SD |
| TOR2A | SNV | Missense_Mutation | c.287N>A | p.Gly96Asp | p.G96D | Q5JU69 | protein_coding | deleterious(0) | probably_damaging(1) | TCGA-B5-A0K9-01 | Endometrium | uterine corpus endometrioid carcinoma | Female | >=65 | I/II | Unknown | Unknown | SD | |
| TOR2A | SNV | Missense_Mutation | rs767435607 | c.952G>A | p.Ala318Thr | p.A318T | Q5JU69 | protein_coding | tolerated(0.26) | benign(0) | TCGA-B5-A3FC-01 | Endometrium | uterine corpus endometrioid carcinoma | Female | <65 | I/II | Unknown | Unknown | SD |
| TOR2A | SNV | Missense_Mutation | novel | c.613N>G | p.Ile205Val | p.I205V | Q5JU69 | protein_coding | deleterious(0.02) | benign(0.152) | TCGA-DI-A1BU-01 | Endometrium | uterine corpus endometrioid carcinoma | Female | <65 | I/II | Chemotherapy | paclitaxel | SD |
| TOR2A | SNV | Missense_Mutation | novel | c.961N>T | p.Leu321Phe | p.L321F | Q5JU69 | protein_coding | tolerated(0.16) | benign(0.03) | TCGA-E6-A1LX-01 | Endometrium | uterine corpus endometrioid carcinoma | Female | <65 | I/II | Unknown | Unknown | SD |
| Page: 1 2 3 |
Top |
Related drugs of malignant transformation related genes |
| Identification of chemicals and drugs interact with genes involved in malignant transfromation |
| (DGIdb 4.0) |
| Entrez ID | Symbol | Category | Interaction Types | Drug Claim Name | Drug Name | PMIDs |
| Page: 1 |

Copyright 2023-Present -The University of Texas Health Science Center at Houston |