
|
|||||
|
 | |
| |
| |
| |
| |
| |
|
Gene: TOR1B |
Gene summary for TOR1B |
| Gene information | Species | Human | Gene symbol | TOR1B | Gene ID | 27348 |
| Gene name | torsin family 1 member B | |
| Gene Alias | DQ1 | |
| Cytomap | 9q34.11 | |
| Gene Type | protein-coding | GO ID | GO:0006457 | UniProtAcc | O14657 |
Top |
Malignant transformation analysis |
| Identification of the aberrant gene expression in precancerous and cancerous lesions by comparing the gene expression of stem-like cells in diseased tissues with normal stem cells |
| Entrez ID | Symbol | Replicates | Species | Organ | Tissue | Adj P-value | Log2FC | Malignancy |
| 27348 | TOR1B | LZE4T | Human | Esophagus | ESCC | 3.44e-13 | 3.71e-01 | 0.0811 |
| 27348 | TOR1B | LZE5T | Human | Esophagus | ESCC | 7.77e-05 | 2.65e-01 | 0.0514 |
| 27348 | TOR1B | LZE7T | Human | Esophagus | ESCC | 2.75e-06 | 2.74e-01 | 0.0667 |
| 27348 | TOR1B | LZE20T | Human | Esophagus | ESCC | 3.71e-12 | 4.11e-01 | 0.0662 |
| 27348 | TOR1B | LZE21D1 | Human | Esophagus | HGIN | 1.79e-02 | 3.19e-01 | 0.0632 |
| 27348 | TOR1B | LZE24T | Human | Esophagus | ESCC | 1.17e-23 | 5.28e-01 | 0.0596 |
| 27348 | TOR1B | P1T-E | Human | Esophagus | ESCC | 5.29e-04 | 4.04e-01 | 0.0875 |
| 27348 | TOR1B | P2T-E | Human | Esophagus | ESCC | 2.40e-30 | 4.74e-01 | 0.1177 |
| 27348 | TOR1B | P4T-E | Human | Esophagus | ESCC | 7.39e-16 | 4.54e-01 | 0.1323 |
| 27348 | TOR1B | P5T-E | Human | Esophagus | ESCC | 4.27e-14 | 2.70e-01 | 0.1327 |
| 27348 | TOR1B | P8T-E | Human | Esophagus | ESCC | 2.17e-32 | 6.11e-01 | 0.0889 |
| 27348 | TOR1B | P9T-E | Human | Esophagus | ESCC | 3.07e-14 | 2.95e-01 | 0.1131 |
| 27348 | TOR1B | P10T-E | Human | Esophagus | ESCC | 1.04e-21 | 2.96e-01 | 0.116 |
| 27348 | TOR1B | P11T-E | Human | Esophagus | ESCC | 1.09e-14 | 5.53e-01 | 0.1426 |
| 27348 | TOR1B | P12T-E | Human | Esophagus | ESCC | 2.85e-18 | 2.94e-01 | 0.1122 |
| 27348 | TOR1B | P15T-E | Human | Esophagus | ESCC | 4.10e-13 | 3.67e-01 | 0.1149 |
| 27348 | TOR1B | P16T-E | Human | Esophagus | ESCC | 4.27e-15 | 3.05e-01 | 0.1153 |
| 27348 | TOR1B | P17T-E | Human | Esophagus | ESCC | 3.74e-09 | 3.00e-01 | 0.1278 |
| 27348 | TOR1B | P20T-E | Human | Esophagus | ESCC | 1.69e-08 | 1.89e-01 | 0.1124 |
| 27348 | TOR1B | P21T-E | Human | Esophagus | ESCC | 2.65e-39 | 6.57e-01 | 0.1617 |
| Page: 1 2 3 4 |
| Tissue | Expression Dynamics | Abbreviation |
| Esophagus | 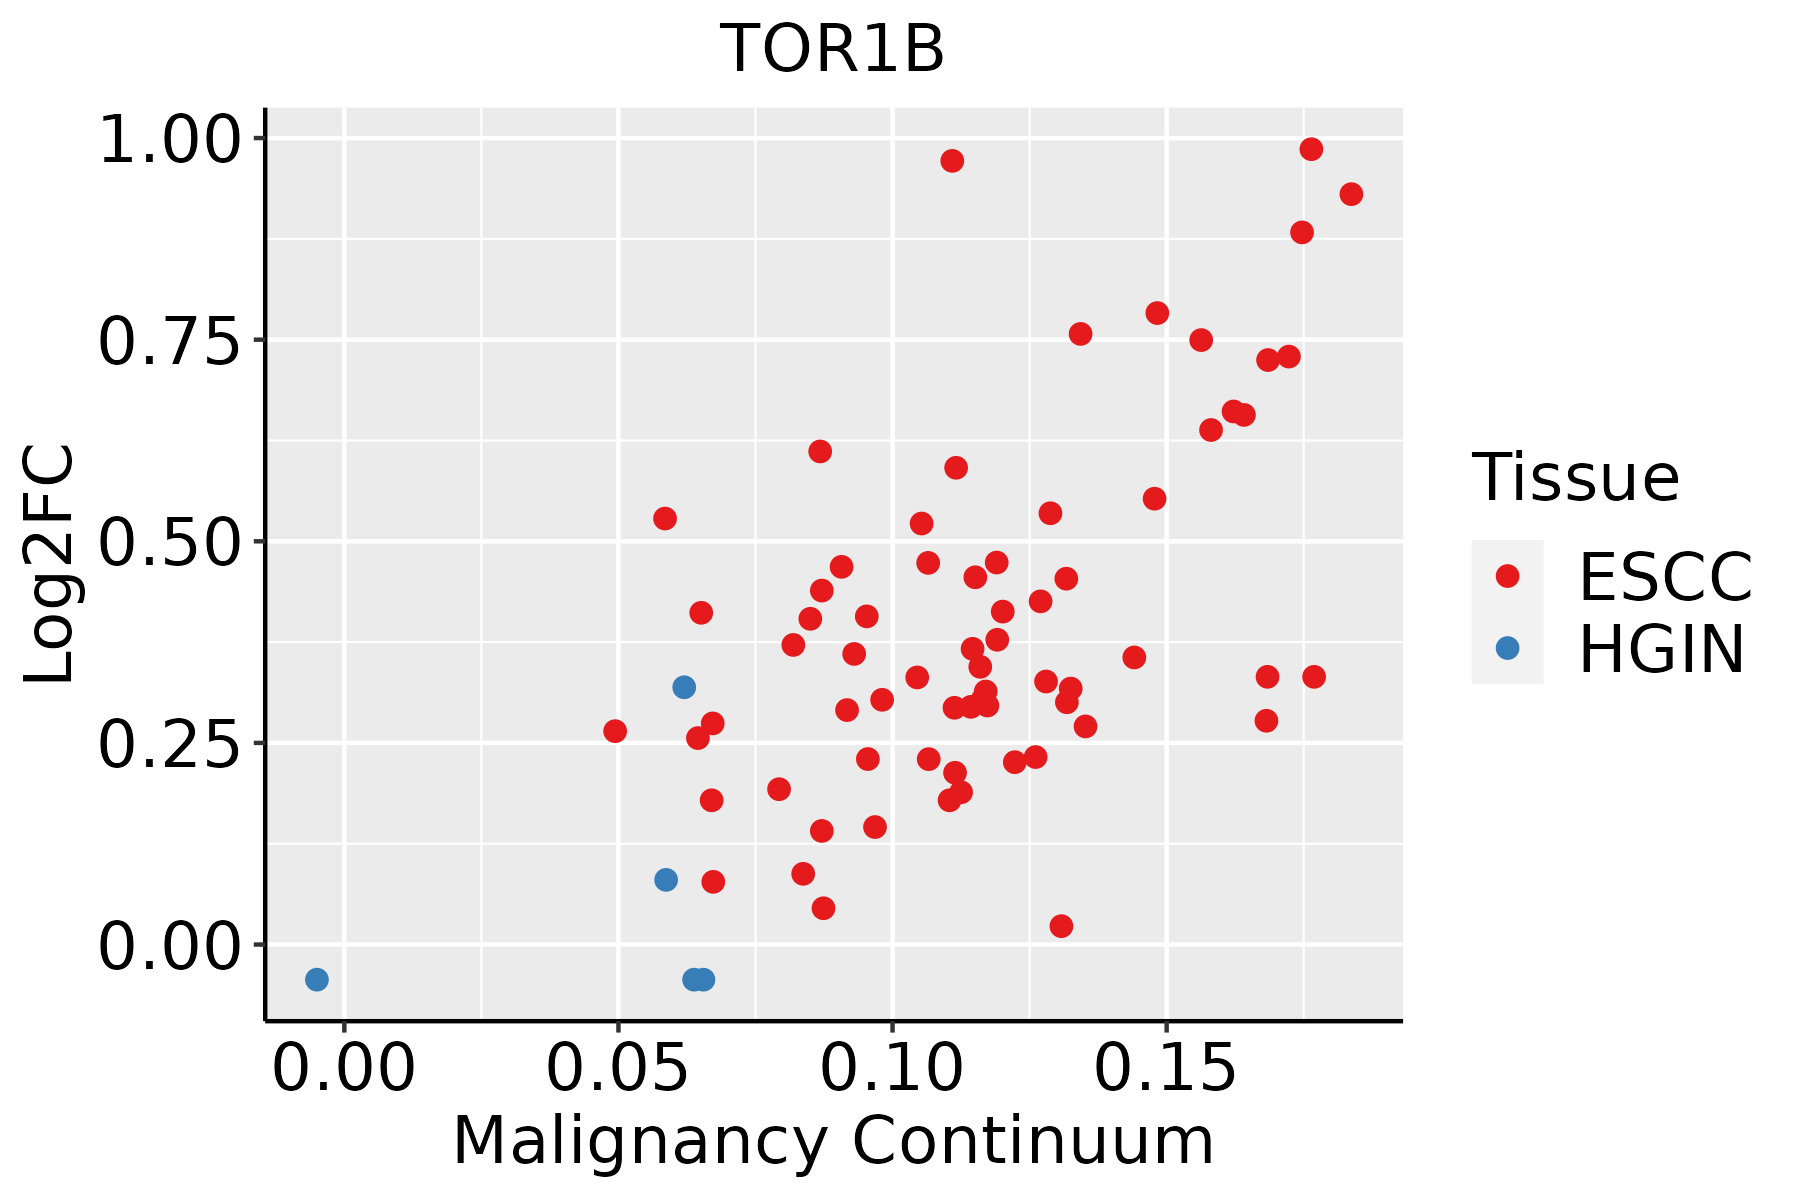 | ESCC: Esophageal squamous cell carcinoma |
| HGIN: High-grade intraepithelial neoplasias | ||
| LGIN: Low-grade intraepithelial neoplasias | ||
| Liver | 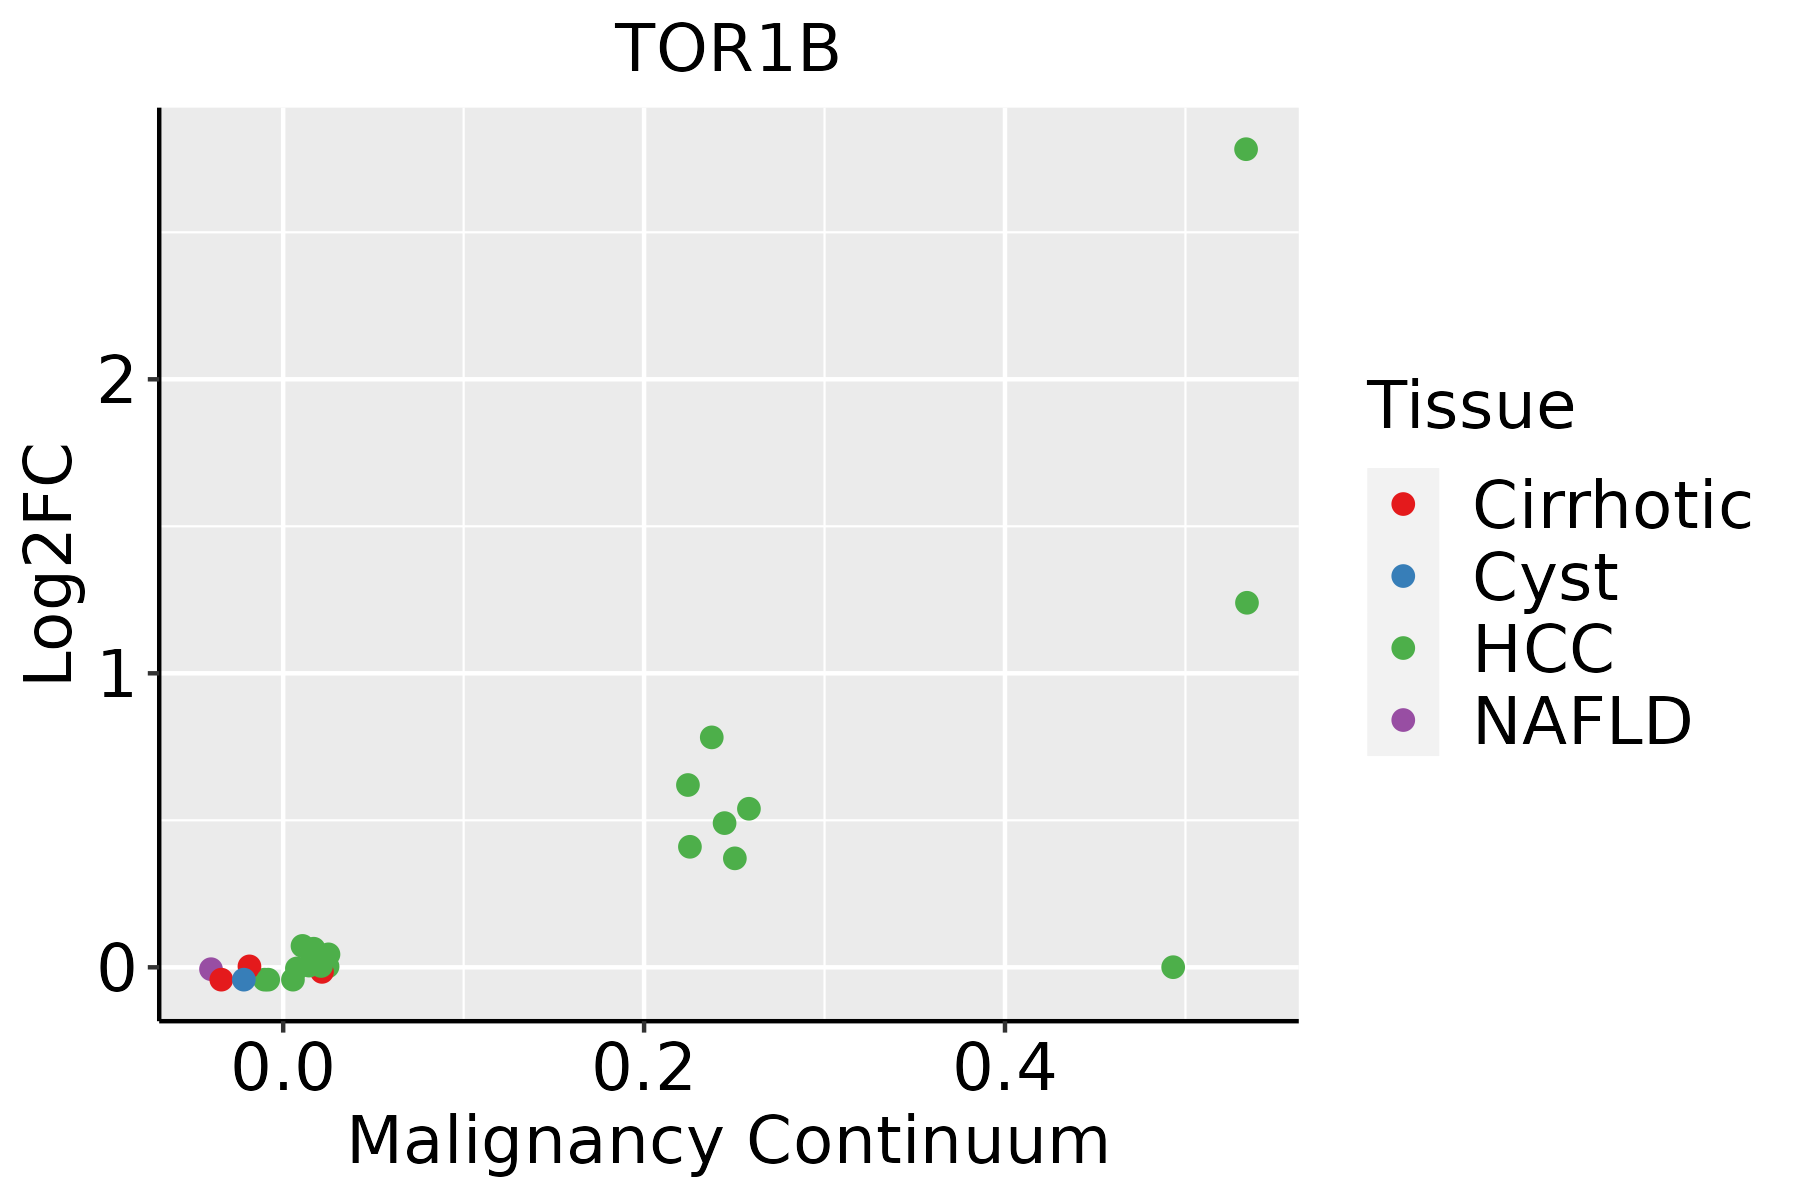 | HCC: Hepatocellular carcinoma |
| NAFLD: Non-alcoholic fatty liver disease | ||
| Oral Cavity |  | EOLP: Erosive Oral lichen planus |
| LP: leukoplakia | ||
| NEOLP: Non-erosive oral lichen planus | ||
| OSCC: Oral squamous cell carcinoma |
| ∗log2FC in expression of this searched gene in stem-like cells from each diseased tissue sample relative to stem-like cells in normal samples in each tissue plotted against the malignancy continuum. Samples are colored based on if they are from different disease stage. |
Top |
Malignant transformation related pathway analysis |
| Find out the enriched GO biological processes and KEGG pathways involved in transition from healthy to precancer to cancer |
| Tissue | Disease Stage | Enriched GO biological Processes |
| Colorectum | AD |  |
| Colorectum | SER |  |
| Colorectum | MSS |  |
| Colorectum | MSI-H |  |
| Colorectum | FAP |  |
| ∗Top 15 enriched GO BP terms are showed in the bar plot of each disease state in each tissue. Each row represents a significant GO biological process which is colored according to the -log10(p.adjust). |
| Page: 1 2 3 4 5 6 7 8 9 |
| GO ID | Tissue | Disease Stage | Description | Gene Ratio | Bg Ratio | pvalue | p.adjust | Count |
| GO:000645720 | Esophagus | HGIN | protein folding | 75/2587 | 212/18723 | 1.61e-15 | 3.86e-13 | 75 |
| GO:003450417 | Esophagus | HGIN | protein localization to nucleus | 84/2587 | 290/18723 | 1.06e-11 | 1.24e-09 | 84 |
| GO:003596625 | Esophagus | HGIN | response to topologically incorrect protein | 54/2587 | 159/18723 | 8.53e-11 | 8.89e-09 | 54 |
| GO:000698625 | Esophagus | HGIN | response to unfolded protein | 48/2587 | 137/18723 | 2.80e-10 | 2.54e-08 | 48 |
| GO:006107720 | Esophagus | HGIN | chaperone-mediated protein folding | 27/2587 | 67/18723 | 7.99e-08 | 4.20e-06 | 27 |
| GO:000645820 | Esophagus | HGIN | 'de novo' protein folding | 19/2587 | 43/18723 | 1.25e-06 | 4.83e-05 | 19 |
| GO:005108420 | Esophagus | HGIN | 'de novo' posttranslational protein folding | 16/2587 | 39/18723 | 2.70e-05 | 7.03e-04 | 16 |
| GO:005108520 | Esophagus | HGIN | chaperone cofactor-dependent protein refolding | 14/2587 | 34/18723 | 8.15e-05 | 1.80e-03 | 14 |
| GO:00069975 | Esophagus | HGIN | nucleus organization | 34/2587 | 133/18723 | 2.20e-04 | 4.00e-03 | 34 |
| GO:00717634 | Esophagus | HGIN | nuclear membrane organization | 12/2587 | 33/18723 | 9.97e-04 | 1.25e-02 | 12 |
| GO:00070295 | Esophagus | HGIN | endoplasmic reticulum organization | 22/2587 | 87/18723 | 3.07e-03 | 2.90e-02 | 22 |
| GO:00069983 | Esophagus | HGIN | nuclear envelope organization | 14/2587 | 47/18723 | 3.49e-03 | 3.23e-02 | 14 |
| GO:003450418 | Esophagus | ESCC | protein localization to nucleus | 211/8552 | 290/18723 | 4.06e-21 | 6.60e-19 | 211 |
| GO:0006457110 | Esophagus | ESCC | protein folding | 163/8552 | 212/18723 | 1.13e-20 | 1.74e-18 | 163 |
| GO:0035966111 | Esophagus | ESCC | response to topologically incorrect protein | 125/8552 | 159/18723 | 1.44e-17 | 1.27e-15 | 125 |
| GO:0006986111 | Esophagus | ESCC | response to unfolded protein | 107/8552 | 137/18723 | 7.01e-15 | 3.87e-13 | 107 |
| GO:0061077110 | Esophagus | ESCC | chaperone-mediated protein folding | 56/8552 | 67/18723 | 1.52e-10 | 4.36e-09 | 56 |
| GO:000699713 | Esophagus | ESCC | nucleus organization | 96/8552 | 133/18723 | 4.66e-10 | 1.21e-08 | 96 |
| GO:000702914 | Esophagus | ESCC | endoplasmic reticulum organization | 65/8552 | 87/18723 | 3.28e-08 | 6.08e-07 | 65 |
| GO:000699811 | Esophagus | ESCC | nuclear envelope organization | 39/8552 | 47/18723 | 1.48e-07 | 2.35e-06 | 39 |
| Page: 1 2 3 |
| Pathway ID | Tissue | Disease Stage | Description | Gene Ratio | Bg Ratio | pvalue | p.adjust | qvalue | Count |
| Page: 1 |
Top |
Cell-cell communication analysis |
| Identification of potential cell-cell interactions between two cell types and their ligand-receptor pairs for different disease states |
| Ligand | Receptor | LRpair | Pathway | Tissue | Disease Stage |
| Page: 1 |
Top |
Single-cell gene regulatory network inference analysis |
| Find out the significant the regulons (TFs) and the target genes of each regulon across cell types for different disease states |
| TF | Cell Type | Tissue | Disease Stage | Target Gene | RSS | Regulon Activity |
| ∗The dot plots of a searched regulon are shown for all cell subpopulations in each disease state of each tissue based on the regulon specific score inferred using pySCENIC and by calculating the average expression. |
| Page: 1 |
Top |
Somatic mutation of malignant transformation related genes |
| Annotation of somatic variants for genes involved in malignant transformation |
| Hugo Symbol | Variant Class | Variant Classification | dbSNP RS | HGVSc | HGVSp | HGVSp Short | SWISSPROT | BIOTYPE | SIFT | PolyPhen | Tumor Sample Barcode | Tissue | Histology | Sex | Age | Stage | Therapy Types | Drugs | Outcome |
| TOR1B | SNV | Missense_Mutation | rs748859799 | c.560T>C | p.Ile187Thr | p.I187T | O14657 | protein_coding | deleterious(0) | probably_damaging(0.986) | TCGA-A8-A09Z-01 | Breast | breast invasive carcinoma | Female | >=65 | I/II | Unknown | Unknown | SD |
| TOR1B | insertion | Nonsense_Mutation | novel | c.422_423insATAATCTTGAAAGTGGCATCGTTT | p.Ser141_Thr142insTer | p.S141_T142ins* | O14657 | protein_coding | TCGA-A2-A0CM-01 | Breast | breast invasive carcinoma | Female | <65 | I/II | Chemotherapy | adriamycin | PD | ||
| TOR1B | SNV | Missense_Mutation | novel | c.170N>C | p.Cys57Ser | p.C57S | O14657 | protein_coding | deleterious(0.01) | probably_damaging(0.987) | TCGA-VS-A8EH-01 | Cervix | cervical & endocervical cancer | Female | <65 | III/IV | Chemotherapy | cisplatin | CR |
| TOR1B | SNV | Missense_Mutation | c.269N>C | p.Leu90Pro | p.L90P | O14657 | protein_coding | deleterious(0) | probably_damaging(0.974) | TCGA-AA-3492-01 | Colorectum | colon adenocarcinoma | Female | >=65 | I/II | Unknown | Unknown | SD | |
| TOR1B | SNV | Missense_Mutation | c.640N>G | p.Ser214Gly | p.S214G | O14657 | protein_coding | deleterious(0) | benign(0.176) | TCGA-AZ-4615-01 | Colorectum | colon adenocarcinoma | Male | >=65 | III/IV | Chemotherapy | xeloda | PD | |
| TOR1B | SNV | Missense_Mutation | novel | c.812A>C | p.Asp271Ala | p.D271A | O14657 | protein_coding | deleterious(0) | probably_damaging(0.988) | TCGA-CA-6717-01 | Colorectum | colon adenocarcinoma | Male | <65 | I/II | Chemotherapy | oxaliplatin | CR |
| TOR1B | SNV | Missense_Mutation | rs777793156 | c.796G>A | p.Asp266Asn | p.D266N | O14657 | protein_coding | deleterious(0.04) | benign(0.043) | TCGA-CM-4743-01 | Colorectum | colon adenocarcinoma | Male | >=65 | I/II | Chemotherapy | capecitabine | SD |
| TOR1B | SNV | Missense_Mutation | c.908T>C | p.Ile303Thr | p.I303T | O14657 | protein_coding | tolerated(0.21) | benign(0.027) | TCGA-G4-6588-01 | Colorectum | colon adenocarcinoma | Female | <65 | I/II | Unknown | Unknown | SD | |
| TOR1B | SNV | Missense_Mutation | novel | c.880N>A | p.Ala294Thr | p.A294T | O14657 | protein_coding | tolerated(0.1) | benign(0.104) | TCGA-A5-A0G2-01 | Endometrium | uterine corpus endometrioid carcinoma | Female | <65 | III/IV | Unknown | Unknown | SD |
| TOR1B | SNV | Missense_Mutation | novel | c.300N>T | p.Lys100Asn | p.K100N | O14657 | protein_coding | tolerated(0.11) | benign(0.241) | TCGA-AJ-A3EK-01 | Endometrium | uterine corpus endometrioid carcinoma | Female | <65 | I/II | Chemotherapy | carboplatin | CR |
| Page: 1 2 3 4 |
Top |
Related drugs of malignant transformation related genes |
| Identification of chemicals and drugs interact with genes involved in malignant transfromation |
| (DGIdb 4.0) |
| Entrez ID | Symbol | Category | Interaction Types | Drug Claim Name | Drug Name | PMIDs |
| Page: 1 |

Copyright 2023-Present -The University of Texas Health Science Center at Houston |