
|
|||||
|
 | |
| |
| |
| |
| |
| |
|
Gene: TOR1AIP2 |
Gene summary for TOR1AIP2 |
| Gene information | Species | Human | Gene symbol | TOR1AIP2 | Gene ID | 163590 |
| Gene name | torsin 1A interacting protein 2 | |
| Gene Alias | IFRG15 | |
| Cytomap | 1q25.2 | |
| Gene Type | protein-coding | GO ID | GO:0006996 | UniProtAcc | A0A024R957 |
Top |
Malignant transformation analysis |
| Identification of the aberrant gene expression in precancerous and cancerous lesions by comparing the gene expression of stem-like cells in diseased tissues with normal stem cells |
| Entrez ID | Symbol | Replicates | Species | Organ | Tissue | Adj P-value | Log2FC | Malignancy |
| 163590 | TOR1AIP2 | LZE2T | Human | Esophagus | ESCC | 1.96e-05 | 5.84e-01 | 0.082 |
| 163590 | TOR1AIP2 | LZE4T | Human | Esophagus | ESCC | 5.38e-12 | 4.24e-01 | 0.0811 |
| 163590 | TOR1AIP2 | LZE7T | Human | Esophagus | ESCC | 3.91e-15 | 3.82e-01 | 0.0667 |
| 163590 | TOR1AIP2 | LZE8T | Human | Esophagus | ESCC | 5.68e-10 | 3.54e-01 | 0.067 |
| 163590 | TOR1AIP2 | LZE20T | Human | Esophagus | ESCC | 7.06e-08 | 1.39e-01 | 0.0662 |
| 163590 | TOR1AIP2 | LZE22T | Human | Esophagus | ESCC | 1.85e-03 | 3.85e-01 | 0.068 |
| 163590 | TOR1AIP2 | LZE24T | Human | Esophagus | ESCC | 5.08e-13 | 2.91e-01 | 0.0596 |
| 163590 | TOR1AIP2 | LZE21T | Human | Esophagus | ESCC | 2.85e-06 | 2.96e-01 | 0.0655 |
| 163590 | TOR1AIP2 | P1T-E | Human | Esophagus | ESCC | 6.09e-08 | 4.17e-01 | 0.0875 |
| 163590 | TOR1AIP2 | P2T-E | Human | Esophagus | ESCC | 3.62e-16 | 3.69e-01 | 0.1177 |
| 163590 | TOR1AIP2 | P4T-E | Human | Esophagus | ESCC | 3.41e-29 | 5.38e-01 | 0.1323 |
| 163590 | TOR1AIP2 | P5T-E | Human | Esophagus | ESCC | 3.92e-29 | 5.30e-01 | 0.1327 |
| 163590 | TOR1AIP2 | P8T-E | Human | Esophagus | ESCC | 2.62e-18 | 3.53e-01 | 0.0889 |
| 163590 | TOR1AIP2 | P9T-E | Human | Esophagus | ESCC | 6.19e-16 | 4.14e-01 | 0.1131 |
| 163590 | TOR1AIP2 | P10T-E | Human | Esophagus | ESCC | 1.24e-16 | 3.89e-01 | 0.116 |
| 163590 | TOR1AIP2 | P11T-E | Human | Esophagus | ESCC | 2.77e-12 | 8.30e-01 | 0.1426 |
| 163590 | TOR1AIP2 | P12T-E | Human | Esophagus | ESCC | 4.15e-09 | 1.82e-01 | 0.1122 |
| 163590 | TOR1AIP2 | P15T-E | Human | Esophagus | ESCC | 7.88e-23 | 3.95e-01 | 0.1149 |
| 163590 | TOR1AIP2 | P16T-E | Human | Esophagus | ESCC | 6.45e-21 | 3.60e-01 | 0.1153 |
| 163590 | TOR1AIP2 | P17T-E | Human | Esophagus | ESCC | 5.50e-07 | 2.34e-01 | 0.1278 |
| Page: 1 2 3 4 5 6 7 |
| Tissue | Expression Dynamics | Abbreviation |
| Esophagus |  | ESCC: Esophageal squamous cell carcinoma |
| HGIN: High-grade intraepithelial neoplasias | ||
| LGIN: Low-grade intraepithelial neoplasias | ||
| Liver | 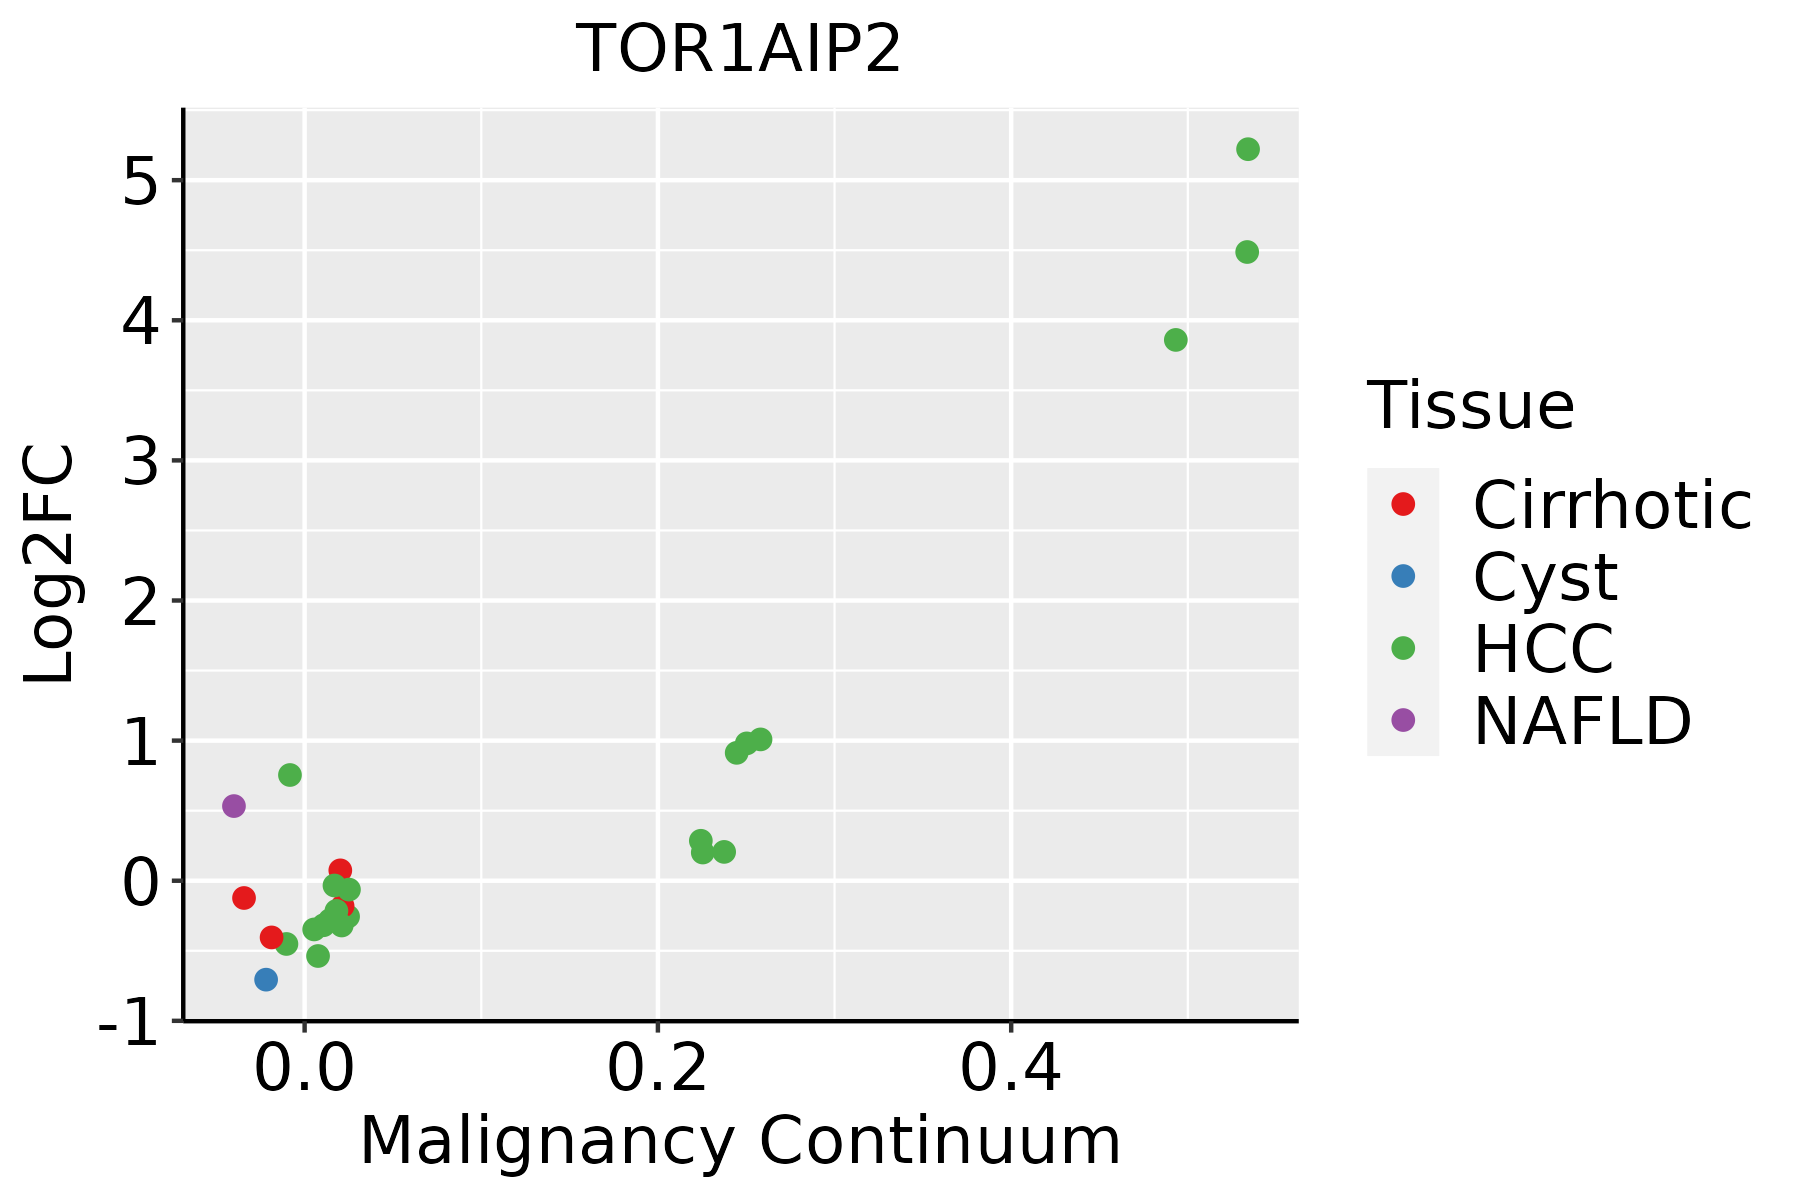 | HCC: Hepatocellular carcinoma |
| NAFLD: Non-alcoholic fatty liver disease | ||
| Oral Cavity | 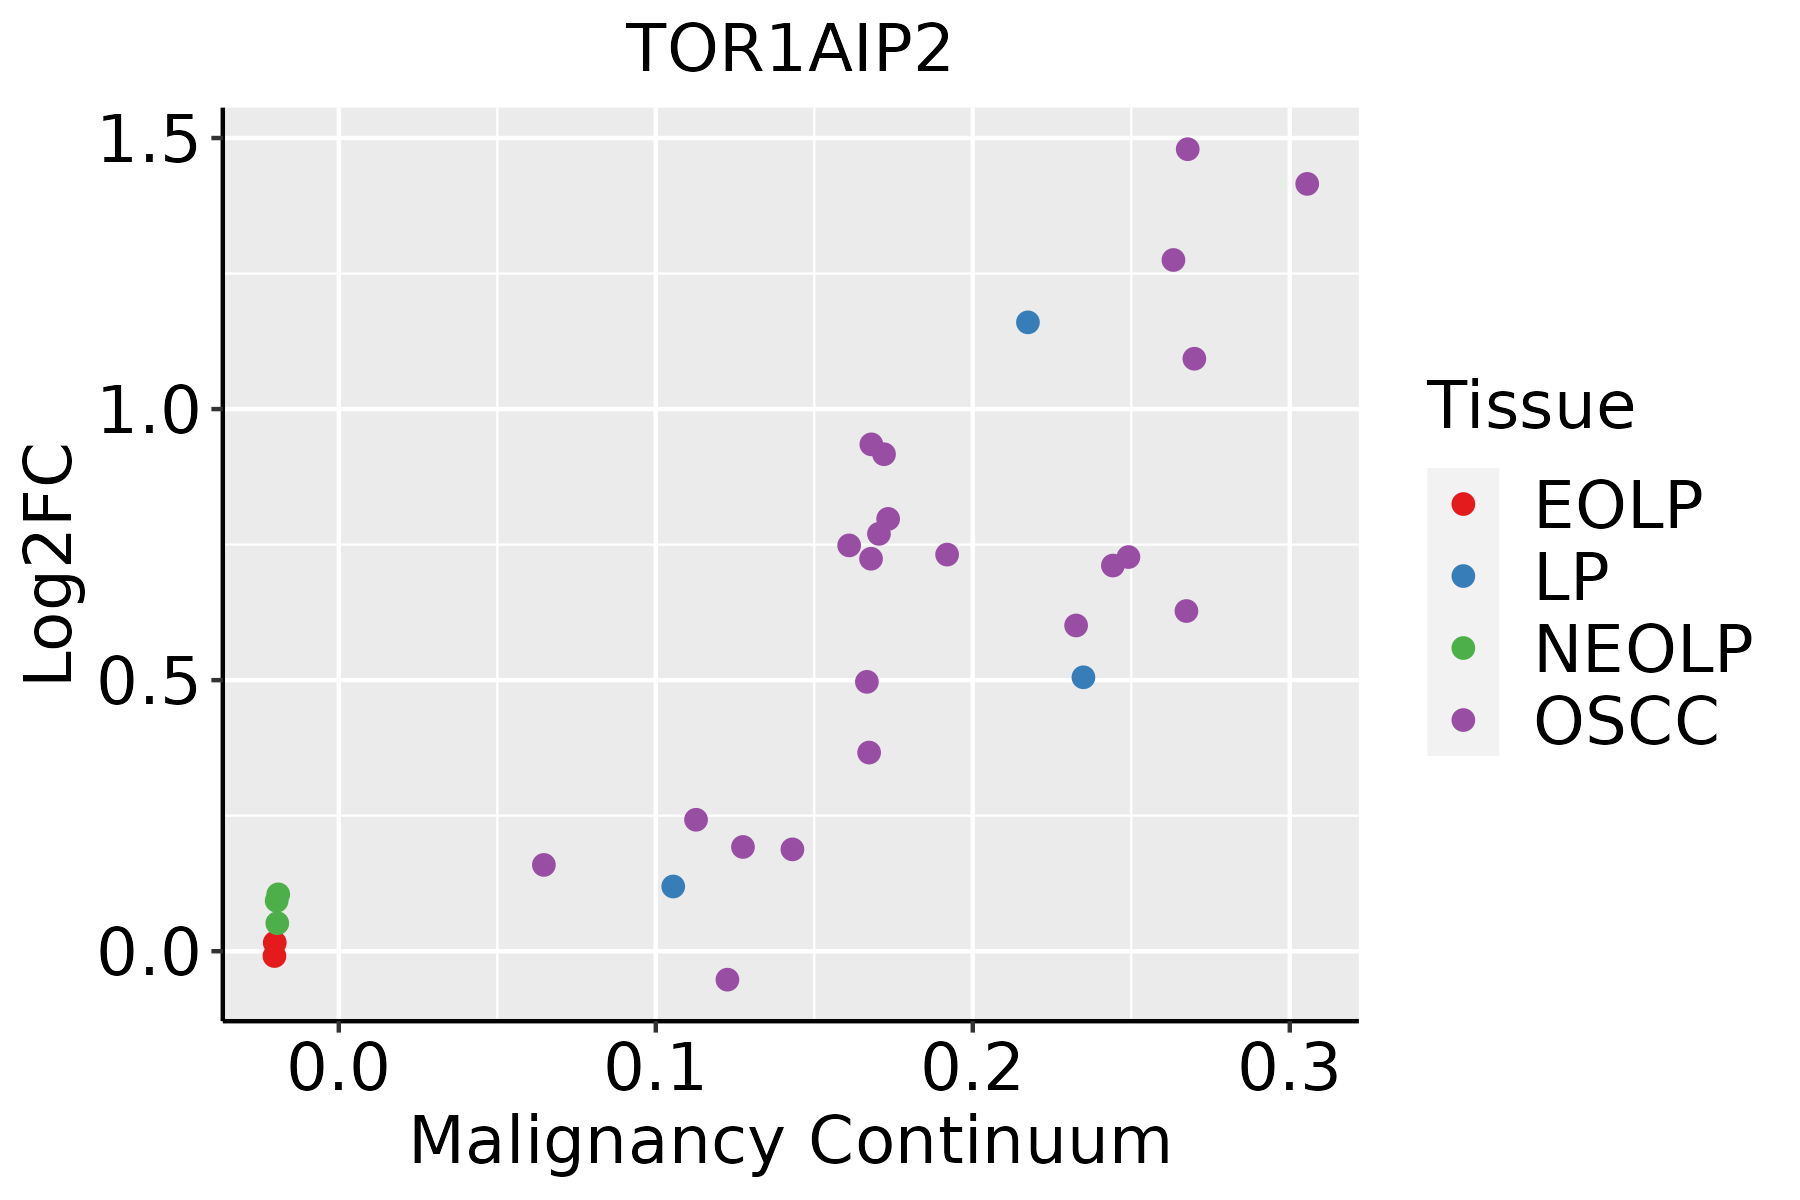 | EOLP: Erosive Oral lichen planus |
| LP: leukoplakia | ||
| NEOLP: Non-erosive oral lichen planus | ||
| OSCC: Oral squamous cell carcinoma | ||
| Skin |  | AK: Actinic keratosis |
| cSCC: Cutaneous squamous cell carcinoma | ||
| SCCIS:squamous cell carcinoma in situ | ||
| Thyroid |  | ATC: Anaplastic thyroid cancer |
| HT: Hashimoto's thyroiditis | ||
| PTC: Papillary thyroid cancer |
| ∗log2FC in expression of this searched gene in stem-like cells from each diseased tissue sample relative to stem-like cells in normal samples in each tissue plotted against the malignancy continuum. Samples are colored based on if they are from different disease stage. |
Top |
Malignant transformation related pathway analysis |
| Find out the enriched GO biological processes and KEGG pathways involved in transition from healthy to precancer to cancer |
| Tissue | Disease Stage | Enriched GO biological Processes |
| Colorectum | AD |  |
| Colorectum | SER |  |
| Colorectum | MSS |  |
| Colorectum | MSI-H |  |
| Colorectum | FAP |  |
| ∗Top 15 enriched GO BP terms are showed in the bar plot of each disease state in each tissue. Each row represents a significant GO biological process which is colored according to the -log10(p.adjust). |
| Page: 1 2 3 4 5 6 7 8 9 |
| GO ID | Tissue | Disease Stage | Description | Gene Ratio | Bg Ratio | pvalue | p.adjust | Count |
| GO:003450418 | Esophagus | ESCC | protein localization to nucleus | 211/8552 | 290/18723 | 4.06e-21 | 6.60e-19 | 211 |
| GO:000702914 | Esophagus | ESCC | endoplasmic reticulum organization | 65/8552 | 87/18723 | 3.28e-08 | 6.08e-07 | 65 |
| GO:00434627 | Esophagus | ESCC | regulation of ATPase activity | 30/8552 | 46/18723 | 5.91e-03 | 2.18e-02 | 30 |
| GO:00345046 | Liver | NAFLD | protein localization to nucleus | 45/1882 | 290/18723 | 2.16e-03 | 2.10e-02 | 45 |
| GO:003450411 | Liver | Cirrhotic | protein localization to nucleus | 113/4634 | 290/18723 | 5.00e-08 | 1.58e-06 | 113 |
| GO:00070292 | Liver | Cirrhotic | endoplasmic reticulum organization | 42/4634 | 87/18723 | 1.67e-06 | 3.22e-05 | 42 |
| GO:00327812 | Liver | Cirrhotic | positive regulation of ATPase activity | 16/4634 | 27/18723 | 1.41e-04 | 1.36e-03 | 16 |
| GO:00434623 | Liver | Cirrhotic | regulation of ATPase activity | 21/4634 | 46/18723 | 1.61e-03 | 1.04e-02 | 21 |
| GO:003450421 | Liver | HCC | protein localization to nucleus | 194/7958 | 290/18723 | 2.84e-17 | 2.85e-15 | 194 |
| GO:000702911 | Liver | HCC | endoplasmic reticulum organization | 64/7958 | 87/18723 | 3.92e-09 | 1.04e-07 | 64 |
| GO:00327811 | Liver | HCC | positive regulation of ATPase activity | 19/7958 | 27/18723 | 3.18e-03 | 1.47e-02 | 19 |
| GO:004346211 | Liver | HCC | regulation of ATPase activity | 29/7958 | 46/18723 | 3.95e-03 | 1.74e-02 | 29 |
| GO:003450431 | Liver | Cyst | protein localization to nucleus | 17/496 | 290/18723 | 1.97e-03 | 4.15e-02 | 17 |
| GO:003450415 | Oral cavity | OSCC | protein localization to nucleus | 193/7305 | 290/18723 | 1.22e-21 | 2.35e-19 | 193 |
| GO:00070294 | Oral cavity | OSCC | endoplasmic reticulum organization | 58/7305 | 87/18723 | 1.59e-07 | 2.61e-06 | 58 |
| GO:00327815 | Oral cavity | OSCC | positive regulation of ATPase activity | 18/7305 | 27/18723 | 3.34e-03 | 1.42e-02 | 18 |
| GO:00434626 | Oral cavity | OSCC | regulation of ATPase activity | 27/7305 | 46/18723 | 5.33e-03 | 2.07e-02 | 27 |
| GO:003450416 | Oral cavity | LP | protein localization to nucleus | 133/4623 | 290/18723 | 2.41e-15 | 3.35e-13 | 133 |
| GO:000702913 | Oral cavity | LP | endoplasmic reticulum organization | 41/4623 | 87/18723 | 4.49e-06 | 9.16e-05 | 41 |
| GO:003278113 | Oral cavity | LP | positive regulation of ATPase activity | 13/4623 | 27/18723 | 6.92e-03 | 3.96e-02 | 13 |
| Page: 1 2 |
| Pathway ID | Tissue | Disease Stage | Description | Gene Ratio | Bg Ratio | pvalue | p.adjust | qvalue | Count |
| Page: 1 |
Top |
Cell-cell communication analysis |
| Identification of potential cell-cell interactions between two cell types and their ligand-receptor pairs for different disease states |
| Ligand | Receptor | LRpair | Pathway | Tissue | Disease Stage |
| Page: 1 |
Top |
Single-cell gene regulatory network inference analysis |
| Find out the significant the regulons (TFs) and the target genes of each regulon across cell types for different disease states |
| TF | Cell Type | Tissue | Disease Stage | Target Gene | RSS | Regulon Activity |
| ∗The dot plots of a searched regulon are shown for all cell subpopulations in each disease state of each tissue based on the regulon specific score inferred using pySCENIC and by calculating the average expression. |
| Page: 1 |
Top |
Somatic mutation of malignant transformation related genes |
| Annotation of somatic variants for genes involved in malignant transformation |
| Hugo Symbol | Variant Class | Variant Classification | dbSNP RS | HGVSc | HGVSp | HGVSp Short | SWISSPROT | BIOTYPE | SIFT | PolyPhen | Tumor Sample Barcode | Tissue | Histology | Sex | Age | Stage | Therapy Types | Drugs | Outcome |
| TOR1AIP2 | SNV | Missense_Mutation | c.648N>T | p.Trp216Cys | p.W216C | Q8NFQ8 | protein_coding | deleterious(0.03) | benign(0.012) | TCGA-AR-A1AY-01 | Breast | breast invasive carcinoma | Female | >=65 | I/II | Unspecific | Doxorubicin | SD | |
| TOR1AIP2 | SNV | Missense_Mutation | novel | c.724N>G | p.Pro242Ala | p.P242A | Q8NFQ8 | protein_coding | deleterious(0.02) | benign(0.192) | TCGA-C5-A905-01 | Cervix | cervical & endocervical cancer | Female | <65 | I/II | Unknown | Unknown | SD |
| TOR1AIP2 | SNV | Missense_Mutation | c.314N>T | p.Ser105Leu | p.S105L | Q8NFQ8 | protein_coding | tolerated_low_confidence(0.05) | benign(0.018) | TCGA-DR-A0ZM-01 | Cervix | cervical & endocervical cancer | Female | <65 | III/IV | Unspecific | Cisplatin | SD | |
| TOR1AIP2 | SNV | Missense_Mutation | novel | c.667N>G | p.Leu223Val | p.L223V | Q8NFQ8 | protein_coding | tolerated(0.26) | benign(0.015) | TCGA-RA-A741-01 | Cervix | cervical & endocervical cancer | Female | <65 | I/II | Chemotherapy | cisplatin | SD |
| TOR1AIP2 | SNV | Missense_Mutation | c.1091N>A | p.Val364Glu | p.V364E | Q8NFQ8 | protein_coding | deleterious(0) | probably_damaging(0.998) | TCGA-AA-3811-01 | Colorectum | colon adenocarcinoma | Female | >=65 | III/IV | Unknown | Unknown | PD | |
| TOR1AIP2 | SNV | Missense_Mutation | rs772272447 | c.469G>C | p.Asp157His | p.D157H | Q8NFQ8 | protein_coding | deleterious(0) | possibly_damaging(0.726) | TCGA-AA-A01D-01 | Colorectum | colon adenocarcinoma | Female | <65 | III/IV | Chemotherapy | capecitabine | PD |
| TOR1AIP2 | SNV | Missense_Mutation | novel | c.334C>T | p.Pro112Ser | p.P112S | Q8NFQ8 | protein_coding | tolerated_low_confidence(0.29) | benign(0.033) | TCGA-AA-A02R-01 | Colorectum | colon adenocarcinoma | Female | >=65 | I/II | Unknown | Unknown | PD |
| TOR1AIP2 | SNV | Missense_Mutation | rs200952880 | c.832N>T | p.Arg278Trp | p.R278W | Q8NFQ8 | protein_coding | deleterious(0) | probably_damaging(0.994) | TCGA-AD-6889-01 | Colorectum | colon adenocarcinoma | Male | >=65 | I/II | Chemotherapy | xeloda | PD |
| TOR1AIP2 | SNV | Missense_Mutation | c.799C>T | p.Pro267Ser | p.P267S | Q8NFQ8 | protein_coding | deleterious(0.01) | probably_damaging(0.939) | TCGA-AY-6196-01 | Colorectum | colon adenocarcinoma | Male | <65 | III/IV | Unknown | Unknown | SD | |
| TOR1AIP2 | SNV | Missense_Mutation | c.584N>C | p.Lys195Thr | p.K195T | Q8NFQ8 | protein_coding | tolerated(0.63) | benign(0.012) | TCGA-CA-6718-01 | Colorectum | colon adenocarcinoma | Male | <65 | I/II | Unknown | Unknown | PD |
| Page: 1 2 3 4 5 6 |
Top |
Related drugs of malignant transformation related genes |
| Identification of chemicals and drugs interact with genes involved in malignant transfromation |
| (DGIdb 4.0) |
| Entrez ID | Symbol | Category | Interaction Types | Drug Claim Name | Drug Name | PMIDs |
| Page: 1 |

Copyright 2023-Present -The University of Texas Health Science Center at Houston |