
|
|||||
|
 | |
| |
| |
| |
| |
| |
|
Gene: TOR1AIP1 |
Gene summary for TOR1AIP1 |
| Gene information | Species | Human | Gene symbol | TOR1AIP1 | Gene ID | 26092 |
| Gene name | torsin 1A interacting protein 1 | |
| Gene Alias | LAP1 | |
| Cytomap | 1q25.2 | |
| Gene Type | protein-coding | GO ID | GO:0006996 | UniProtAcc | Q5JTV8 |
Top |
Malignant transformation analysis |
| Identification of the aberrant gene expression in precancerous and cancerous lesions by comparing the gene expression of stem-like cells in diseased tissues with normal stem cells |
| Entrez ID | Symbol | Replicates | Species | Organ | Tissue | Adj P-value | Log2FC | Malignancy |
| 26092 | TOR1AIP1 | LZE4T | Human | Esophagus | ESCC | 2.40e-09 | 2.41e-01 | 0.0811 |
| 26092 | TOR1AIP1 | LZE5T | Human | Esophagus | ESCC | 5.04e-03 | 6.99e-02 | 0.0514 |
| 26092 | TOR1AIP1 | LZE7T | Human | Esophagus | ESCC | 2.56e-02 | 2.84e-01 | 0.0667 |
| 26092 | TOR1AIP1 | LZE8T | Human | Esophagus | ESCC | 4.40e-02 | 4.10e-02 | 0.067 |
| 26092 | TOR1AIP1 | LZE22T | Human | Esophagus | ESCC | 6.28e-04 | 2.73e-01 | 0.068 |
| 26092 | TOR1AIP1 | LZE24T | Human | Esophagus | ESCC | 9.53e-14 | 2.68e-01 | 0.0596 |
| 26092 | TOR1AIP1 | P1T-E | Human | Esophagus | ESCC | 6.30e-11 | 2.13e-01 | 0.0875 |
| 26092 | TOR1AIP1 | P2T-E | Human | Esophagus | ESCC | 1.30e-17 | 4.06e-01 | 0.1177 |
| 26092 | TOR1AIP1 | P4T-E | Human | Esophagus | ESCC | 1.36e-17 | 4.25e-01 | 0.1323 |
| 26092 | TOR1AIP1 | P5T-E | Human | Esophagus | ESCC | 9.29e-13 | 2.57e-01 | 0.1327 |
| 26092 | TOR1AIP1 | P8T-E | Human | Esophagus | ESCC | 2.42e-15 | 1.72e-01 | 0.0889 |
| 26092 | TOR1AIP1 | P9T-E | Human | Esophagus | ESCC | 4.85e-16 | 3.27e-01 | 0.1131 |
| 26092 | TOR1AIP1 | P10T-E | Human | Esophagus | ESCC | 6.67e-14 | 2.14e-01 | 0.116 |
| 26092 | TOR1AIP1 | P11T-E | Human | Esophagus | ESCC | 1.44e-16 | 7.85e-01 | 0.1426 |
| 26092 | TOR1AIP1 | P12T-E | Human | Esophagus | ESCC | 7.88e-18 | 1.36e-01 | 0.1122 |
| 26092 | TOR1AIP1 | P15T-E | Human | Esophagus | ESCC | 1.30e-14 | 2.60e-01 | 0.1149 |
| 26092 | TOR1AIP1 | P16T-E | Human | Esophagus | ESCC | 4.65e-20 | 4.13e-01 | 0.1153 |
| 26092 | TOR1AIP1 | P19T-E | Human | Esophagus | ESCC | 1.15e-04 | 3.32e-01 | 0.1662 |
| 26092 | TOR1AIP1 | P20T-E | Human | Esophagus | ESCC | 1.10e-09 | 3.74e-01 | 0.1124 |
| 26092 | TOR1AIP1 | P21T-E | Human | Esophagus | ESCC | 2.10e-10 | 2.47e-01 | 0.1617 |
| Page: 1 2 3 4 5 |
| Tissue | Expression Dynamics | Abbreviation |
| Esophagus | 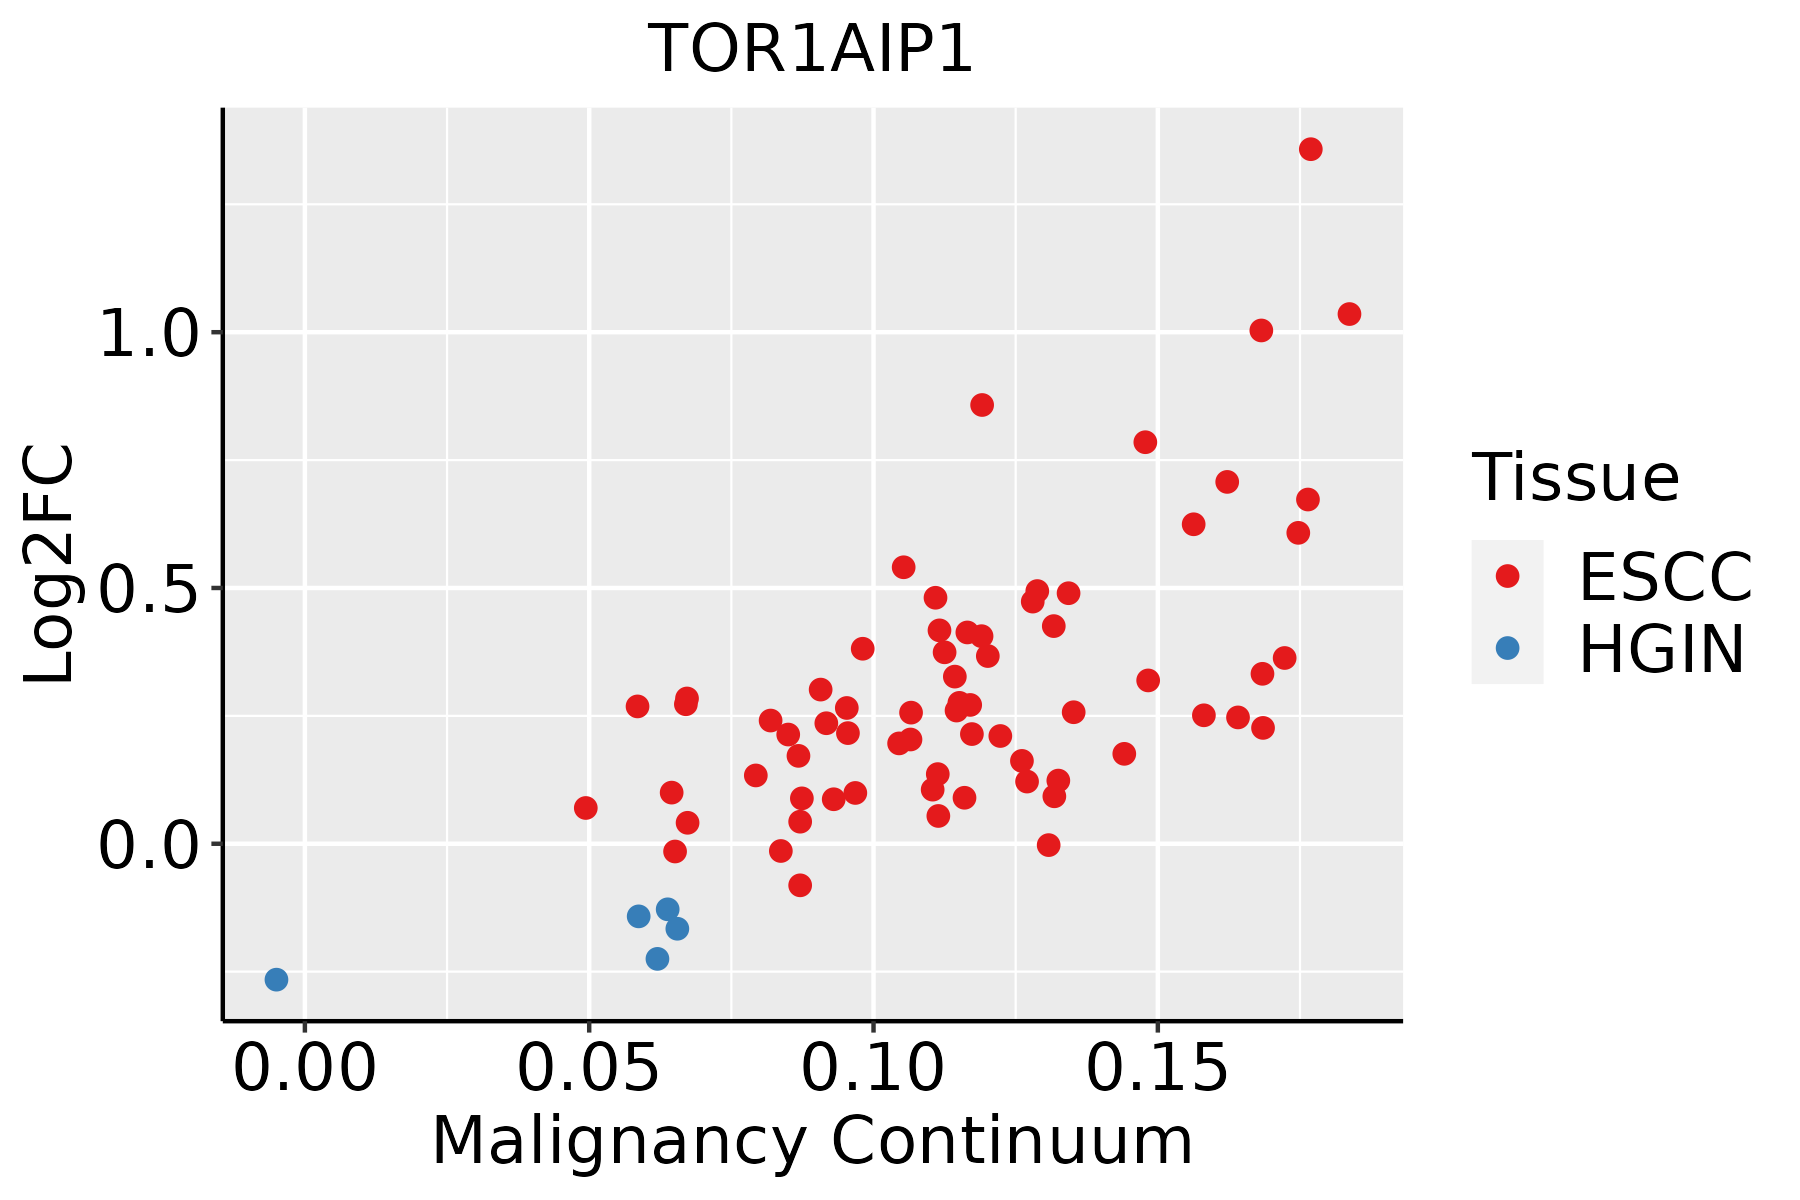 | ESCC: Esophageal squamous cell carcinoma |
| HGIN: High-grade intraepithelial neoplasias | ||
| LGIN: Low-grade intraepithelial neoplasias | ||
| Liver |  | HCC: Hepatocellular carcinoma |
| NAFLD: Non-alcoholic fatty liver disease | ||
| Oral Cavity |  | EOLP: Erosive Oral lichen planus |
| LP: leukoplakia | ||
| NEOLP: Non-erosive oral lichen planus | ||
| OSCC: Oral squamous cell carcinoma | ||
| Prostate | 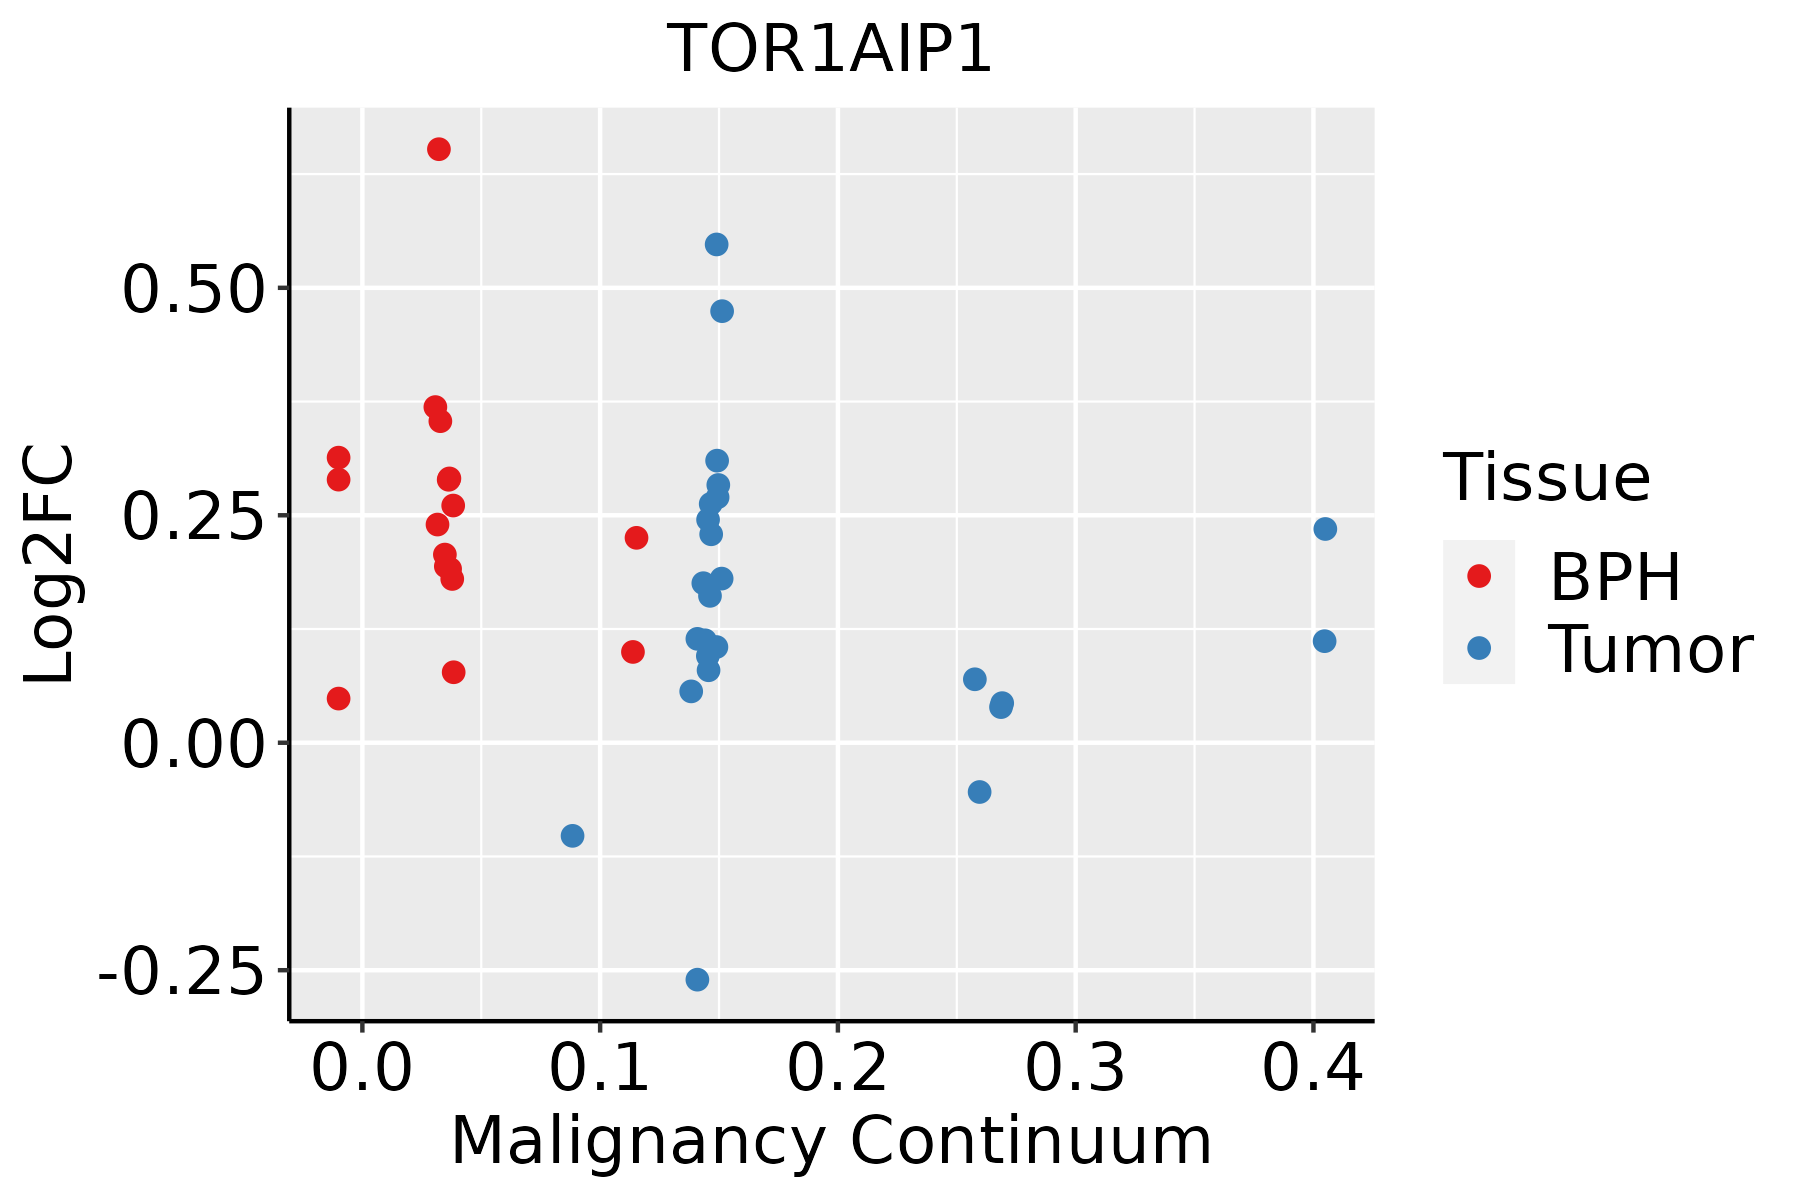 | BPH: Benign Prostatic Hyperplasia |
| ∗log2FC in expression of this searched gene in stem-like cells from each diseased tissue sample relative to stem-like cells in normal samples in each tissue plotted against the malignancy continuum. Samples are colored based on if they are from different disease stage. |
Top |
Malignant transformation related pathway analysis |
| Find out the enriched GO biological processes and KEGG pathways involved in transition from healthy to precancer to cancer |
| Tissue | Disease Stage | Enriched GO biological Processes |
| Colorectum | AD |  |
| Colorectum | SER |  |
| Colorectum | MSS |  |
| Colorectum | MSI-H |  |
| Colorectum | FAP |  |
| ∗Top 15 enriched GO BP terms are showed in the bar plot of each disease state in each tissue. Each row represents a significant GO biological process which is colored according to the -log10(p.adjust). |
| Page: 1 2 3 4 5 6 7 8 9 |
| GO ID | Tissue | Disease Stage | Description | Gene Ratio | Bg Ratio | pvalue | p.adjust | Count |
| GO:003450418 | Esophagus | ESCC | protein localization to nucleus | 211/8552 | 290/18723 | 4.06e-21 | 6.60e-19 | 211 |
| GO:000699713 | Esophagus | ESCC | nucleus organization | 96/8552 | 133/18723 | 4.66e-10 | 1.21e-08 | 96 |
| GO:000699811 | Esophagus | ESCC | nuclear envelope organization | 39/8552 | 47/18723 | 1.48e-07 | 2.35e-06 | 39 |
| GO:007176312 | Esophagus | ESCC | nuclear membrane organization | 29/8552 | 33/18723 | 5.30e-07 | 7.04e-06 | 29 |
| GO:00434627 | Esophagus | ESCC | regulation of ATPase activity | 30/8552 | 46/18723 | 5.91e-03 | 2.18e-02 | 30 |
| GO:003450421 | Liver | HCC | protein localization to nucleus | 194/7958 | 290/18723 | 2.84e-17 | 2.85e-15 | 194 |
| GO:00717631 | Liver | HCC | nuclear membrane organization | 27/7958 | 33/18723 | 4.31e-06 | 5.50e-05 | 27 |
| GO:00069971 | Liver | HCC | nucleus organization | 82/7958 | 133/18723 | 6.32e-06 | 7.72e-05 | 82 |
| GO:0006998 | Liver | HCC | nuclear envelope organization | 34/7958 | 47/18723 | 3.27e-05 | 3.29e-04 | 34 |
| GO:00327811 | Liver | HCC | positive regulation of ATPase activity | 19/7958 | 27/18723 | 3.18e-03 | 1.47e-02 | 19 |
| GO:004346211 | Liver | HCC | regulation of ATPase activity | 29/7958 | 46/18723 | 3.95e-03 | 1.74e-02 | 29 |
| GO:003450415 | Oral cavity | OSCC | protein localization to nucleus | 193/7305 | 290/18723 | 1.22e-21 | 2.35e-19 | 193 |
| GO:00069974 | Oral cavity | OSCC | nucleus organization | 85/7305 | 133/18723 | 5.12e-09 | 1.12e-07 | 85 |
| GO:00717633 | Oral cavity | OSCC | nuclear membrane organization | 29/7305 | 33/18723 | 8.40e-09 | 1.76e-07 | 29 |
| GO:00069982 | Oral cavity | OSCC | nuclear envelope organization | 37/7305 | 47/18723 | 3.19e-08 | 6.12e-07 | 37 |
| GO:00327815 | Oral cavity | OSCC | positive regulation of ATPase activity | 18/7305 | 27/18723 | 3.34e-03 | 1.42e-02 | 18 |
| GO:00434626 | Oral cavity | OSCC | regulation of ATPase activity | 27/7305 | 46/18723 | 5.33e-03 | 2.07e-02 | 27 |
| GO:003450422 | Oral cavity | EOLP | protein localization to nucleus | 72/2218 | 290/18723 | 5.47e-10 | 4.31e-08 | 72 |
| GO:000699721 | Oral cavity | EOLP | nucleus organization | 29/2218 | 133/18723 | 7.82e-04 | 6.24e-03 | 29 |
| GO:00717632 | Oral cavity | EOLP | nuclear membrane organization | 10/2218 | 33/18723 | 3.76e-03 | 2.10e-02 | 10 |
| Page: 1 2 |
| Pathway ID | Tissue | Disease Stage | Description | Gene Ratio | Bg Ratio | pvalue | p.adjust | qvalue | Count |
| Page: 1 |
Top |
Cell-cell communication analysis |
| Identification of potential cell-cell interactions between two cell types and their ligand-receptor pairs for different disease states |
| Ligand | Receptor | LRpair | Pathway | Tissue | Disease Stage |
| Page: 1 |
Top |
Single-cell gene regulatory network inference analysis |
| Find out the significant the regulons (TFs) and the target genes of each regulon across cell types for different disease states |
| TF | Cell Type | Tissue | Disease Stage | Target Gene | RSS | Regulon Activity |
| ∗The dot plots of a searched regulon are shown for all cell subpopulations in each disease state of each tissue based on the regulon specific score inferred using pySCENIC and by calculating the average expression. |
| Page: 1 |
Top |
Somatic mutation of malignant transformation related genes |
| Annotation of somatic variants for genes involved in malignant transformation |
| Hugo Symbol | Variant Class | Variant Classification | dbSNP RS | HGVSc | HGVSp | HGVSp Short | SWISSPROT | BIOTYPE | SIFT | PolyPhen | Tumor Sample Barcode | Tissue | Histology | Sex | Age | Stage | Therapy Types | Drugs | Outcome |
| TOR1AIP1 | SNV | Missense_Mutation | novel | c.922N>G | p.Leu308Val | p.L308V | Q5JTV8 | protein_coding | tolerated(0.07) | benign(0.023) | TCGA-3C-AALI-01 | Breast | breast invasive carcinoma | Female | <65 | I/II | Unspecific | Poly E | Complete Response |
| TOR1AIP1 | SNV | Missense_Mutation | rs750432849 | c.79G>A | p.Glu27Lys | p.E27K | Q5JTV8 | protein_coding | deleterious_low_confidence(0) | possibly_damaging(0.841) | TCGA-A7-A56D-01 | Breast | breast invasive carcinoma | Female | >=65 | I/II | Hormone Therapy | arimidex | SD |
| TOR1AIP1 | SNV | Missense_Mutation | c.730N>T | p.Asp244Tyr | p.D244Y | Q5JTV8 | protein_coding | tolerated_low_confidence(0.06) | benign(0.091) | TCGA-AN-A0G0-01 | Breast | breast invasive carcinoma | Female | <65 | I/II | Unknown | Unknown | SD | |
| TOR1AIP1 | SNV | Missense_Mutation | c.1381N>C | p.Glu461Gln | p.E461Q | Q5JTV8 | protein_coding | tolerated(0.06) | benign(0.444) | TCGA-EW-A1J5-01 | Breast | breast invasive carcinoma | Female | <65 | I/II | Chemotherapy | adriamycin | SD | |
| TOR1AIP1 | SNV | Missense_Mutation | c.358G>A | p.Glu120Lys | p.E120K | Q5JTV8 | protein_coding | deleterious_low_confidence(0.05) | possibly_damaging(0.642) | TCGA-C5-A7X3-01 | Cervix | cervical & endocervical cancer | Female | >=65 | III/IV | Chemotherapy | cisplatin | SD | |
| TOR1AIP1 | SNV | Missense_Mutation | rs748833315 | c.1691N>A | p.Arg564His | p.R564H | Q5JTV8 | protein_coding | deleterious(0.02) | possibly_damaging(0.875) | TCGA-AA-3852-01 | Colorectum | colon adenocarcinoma | Male | >=65 | I/II | Unknown | Unknown | PD |
| TOR1AIP1 | SNV | Missense_Mutation | c.1065N>A | p.Phe355Leu | p.F355L | Q5JTV8 | protein_coding | tolerated(0.28) | benign(0.018) | TCGA-AA-3984-01 | Colorectum | colon adenocarcinoma | Female | <65 | I/II | Unknown | Unknown | SD | |
| TOR1AIP1 | SNV | Missense_Mutation | c.651A>C | p.Glu217Asp | p.E217D | Q5JTV8 | protein_coding | deleterious_low_confidence(0.01) | probably_damaging(0.984) | TCGA-CM-4743-01 | Colorectum | colon adenocarcinoma | Male | >=65 | I/II | Chemotherapy | capecitabine | SD | |
| TOR1AIP1 | SNV | Missense_Mutation | c.1508C>T | p.Ala503Val | p.A503V | Q5JTV8 | protein_coding | deleterious(0.05) | benign(0.222) | TCGA-WS-AB45-01 | Colorectum | colon adenocarcinoma | Female | <65 | I/II | Unknown | Unknown | SD | |
| TOR1AIP1 | SNV | Missense_Mutation | rs138345857 | c.1459G>A | p.Ala487Thr | p.A487T | Q5JTV8 | protein_coding | deleterious(0) | probably_damaging(0.996) | TCGA-EI-6510-01 | Colorectum | rectum adenocarcinoma | Female | >=65 | I/II | Unknown | Unknown | SD |
| Page: 1 2 3 4 5 6 |
Top |
Related drugs of malignant transformation related genes |
| Identification of chemicals and drugs interact with genes involved in malignant transfromation |
| (DGIdb 4.0) |
| Entrez ID | Symbol | Category | Interaction Types | Drug Claim Name | Drug Name | PMIDs |
| Page: 1 |

Copyright 2023-Present -The University of Texas Health Science Center at Houston |