Schematic overview of the cellular and molecular mechanisms involved in the cancer progression, including the proposed cellular and molecular mechanisms in cancer cells trajectory. AT1: alveolar type 1 cells; AT2: alveolar type 2 cells; AAH: atypical adenomatous hyperplasia; AIS: adenocarcinoma in situ; MIA: minimally invasive adenocarcinoma; IA: invasive adenocarcinoma; EMT: epithelial-mesenchymal transition

Home

Download

Statistics

Help

Contact

Center for Computational Systems Medicine
leaf

Gene summary

leaf

Malignant transformation analysis

leaf

Malignant transformation related pathway analysis

leaf

Cell-cell communication analysis

leaf

Single-cell gene regulatory network inference analysis

leaf

Somatic mutation of malignant transformation related genes

leaf

Related drugs of malignant transformation related genes

Gene: TOR1A

Gene summary for TOR1A

check button Gene summary.

Gene informationSpeciesHuman
Gene symbol

TOR1A

Gene ID

1861

Gene nametorsin family 1 member A
Gene AliasAMC5
Cytomap9q34.11
Gene Typeprotein-coding
GO ID

GO:0000338

UniProtAcc

B3KPA1


Top

Malignant transformation analysis

check button Identification of the aberrant gene expression in precancerous and cancerous lesions by comparing the gene expression of stem-like cells in diseased tissues with normal stem cells
check button Malignant transformation involving gene list.
Entrez IDSymbolReplicatesSpeciesOrganTissueAdj P-valueLog2FCMalignancy
1861TOR1ALZE2THumanEsophagusESCC9.61e-033.29e-010.082
1861TOR1ALZE4THumanEsophagusESCC2.81e-153.12e-010.0811
1861TOR1ALZE7THumanEsophagusESCC8.04e-064.20e-010.0667
1861TOR1ALZE8THumanEsophagusESCC2.27e-071.79e-010.067
1861TOR1ALZE20THumanEsophagusESCC3.25e-071.11e-010.0662
1861TOR1ALZE22THumanEsophagusESCC1.12e-052.50e-010.068
1861TOR1ALZE24THumanEsophagusESCC1.59e-142.99e-010.0596
1861TOR1ALZE6THumanEsophagusESCC3.36e-065.17e-010.0845
1861TOR1AP1T-EHumanEsophagusESCC3.09e-051.55e-010.0875
1861TOR1AP2T-EHumanEsophagusESCC3.18e-234.97e-010.1177
1861TOR1AP4T-EHumanEsophagusESCC4.85e-265.04e-010.1323
1861TOR1AP5T-EHumanEsophagusESCC1.21e-123.18e-010.1327
1861TOR1AP8T-EHumanEsophagusESCC2.12e-348.09e-010.0889
1861TOR1AP9T-EHumanEsophagusESCC9.72e-092.23e-010.1131
1861TOR1AP10T-EHumanEsophagusESCC1.82e-244.21e-010.116
1861TOR1AP11T-EHumanEsophagusESCC7.25e-246.20e-010.1426
1861TOR1AP12T-EHumanEsophagusESCC4.59e-272.87e-010.1122
1861TOR1AP15T-EHumanEsophagusESCC7.72e-153.72e-010.1149
1861TOR1AP16T-EHumanEsophagusESCC7.78e-232.95e-010.1153
1861TOR1AP17T-EHumanEsophagusESCC1.93e-143.57e-010.1278
Page: 1 2 3 4 5 6 

check button Transcriptomic changes along malignancy continuum.
TissueExpression DynamicsAbbreviation
EsophagusThe image shows the transcriptomic changes along malignancy continuum.log2FC in expression of this searched gene in stem-like cells from each diseased tissue sample relative to stem-like cells in normal samples in each tissue plotted against the malignancy continuum. Samples are colored based on if they are from different disease stage.ESCC: Esophageal squamous cell carcinoma
HGIN: High-grade intraepithelial neoplasias
LGIN: Low-grade intraepithelial neoplasias
LiverThe image shows the transcriptomic changes along malignancy continuum.log2FC in expression of this searched gene in stem-like cells from each diseased tissue sample relative to stem-like cells in normal samples in each tissue plotted against the malignancy continuum. Samples are colored based on if they are from different disease stage.
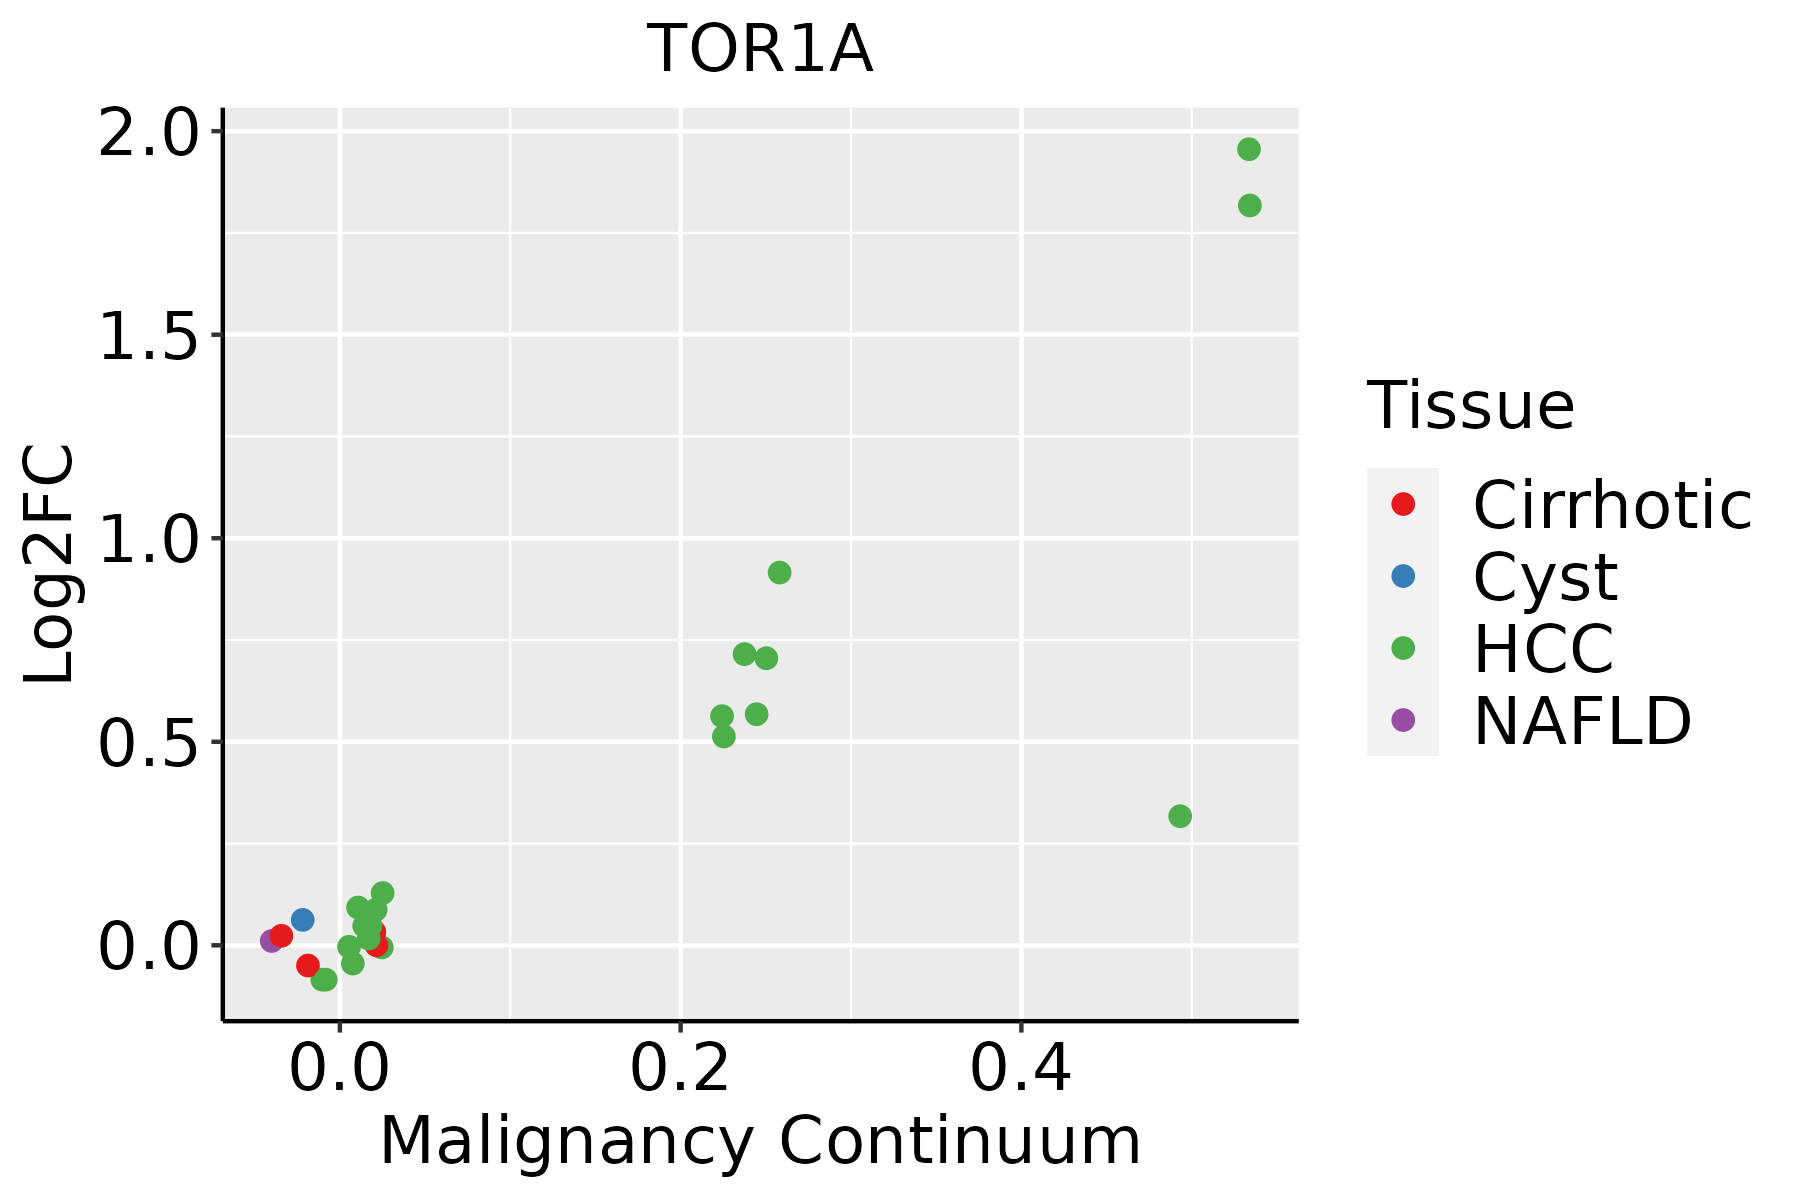
HCC: Hepatocellular carcinoma
NAFLD: Non-alcoholic fatty liver disease
Oral CavityThe image shows the transcriptomic changes along malignancy continuum.log2FC in expression of this searched gene in stem-like cells from each diseased tissue sample relative to stem-like cells in normal samples in each tissue plotted against the malignancy continuum. Samples are colored based on if they are from different disease stage.
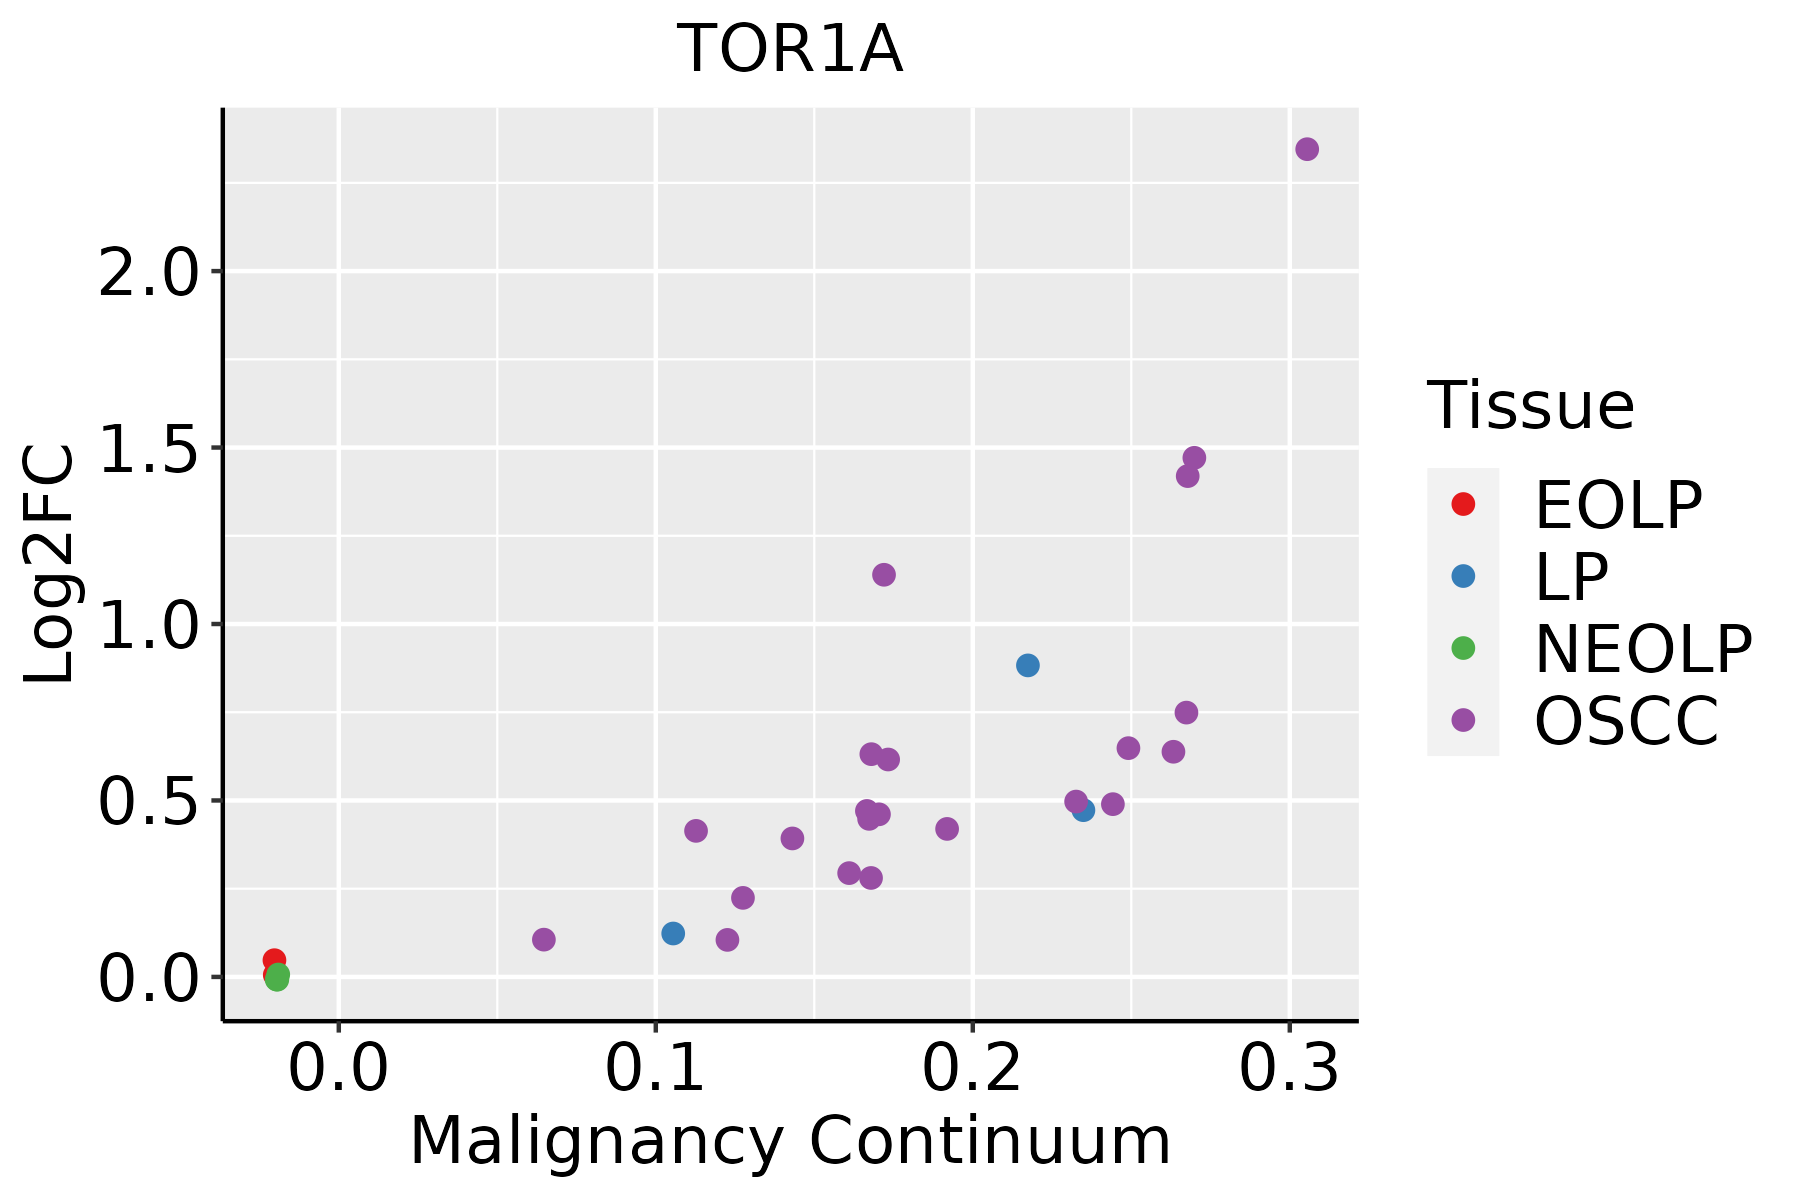
EOLP: Erosive Oral lichen planus
LP: leukoplakia
NEOLP: Non-erosive oral lichen planus
OSCC: Oral squamous cell carcinoma
SkinThe image shows the transcriptomic changes along malignancy continuum.log2FC in expression of this searched gene in stem-like cells from each diseased tissue sample relative to stem-like cells in normal samples in each tissue plotted against the malignancy continuum. Samples are colored based on if they are from different disease stage.
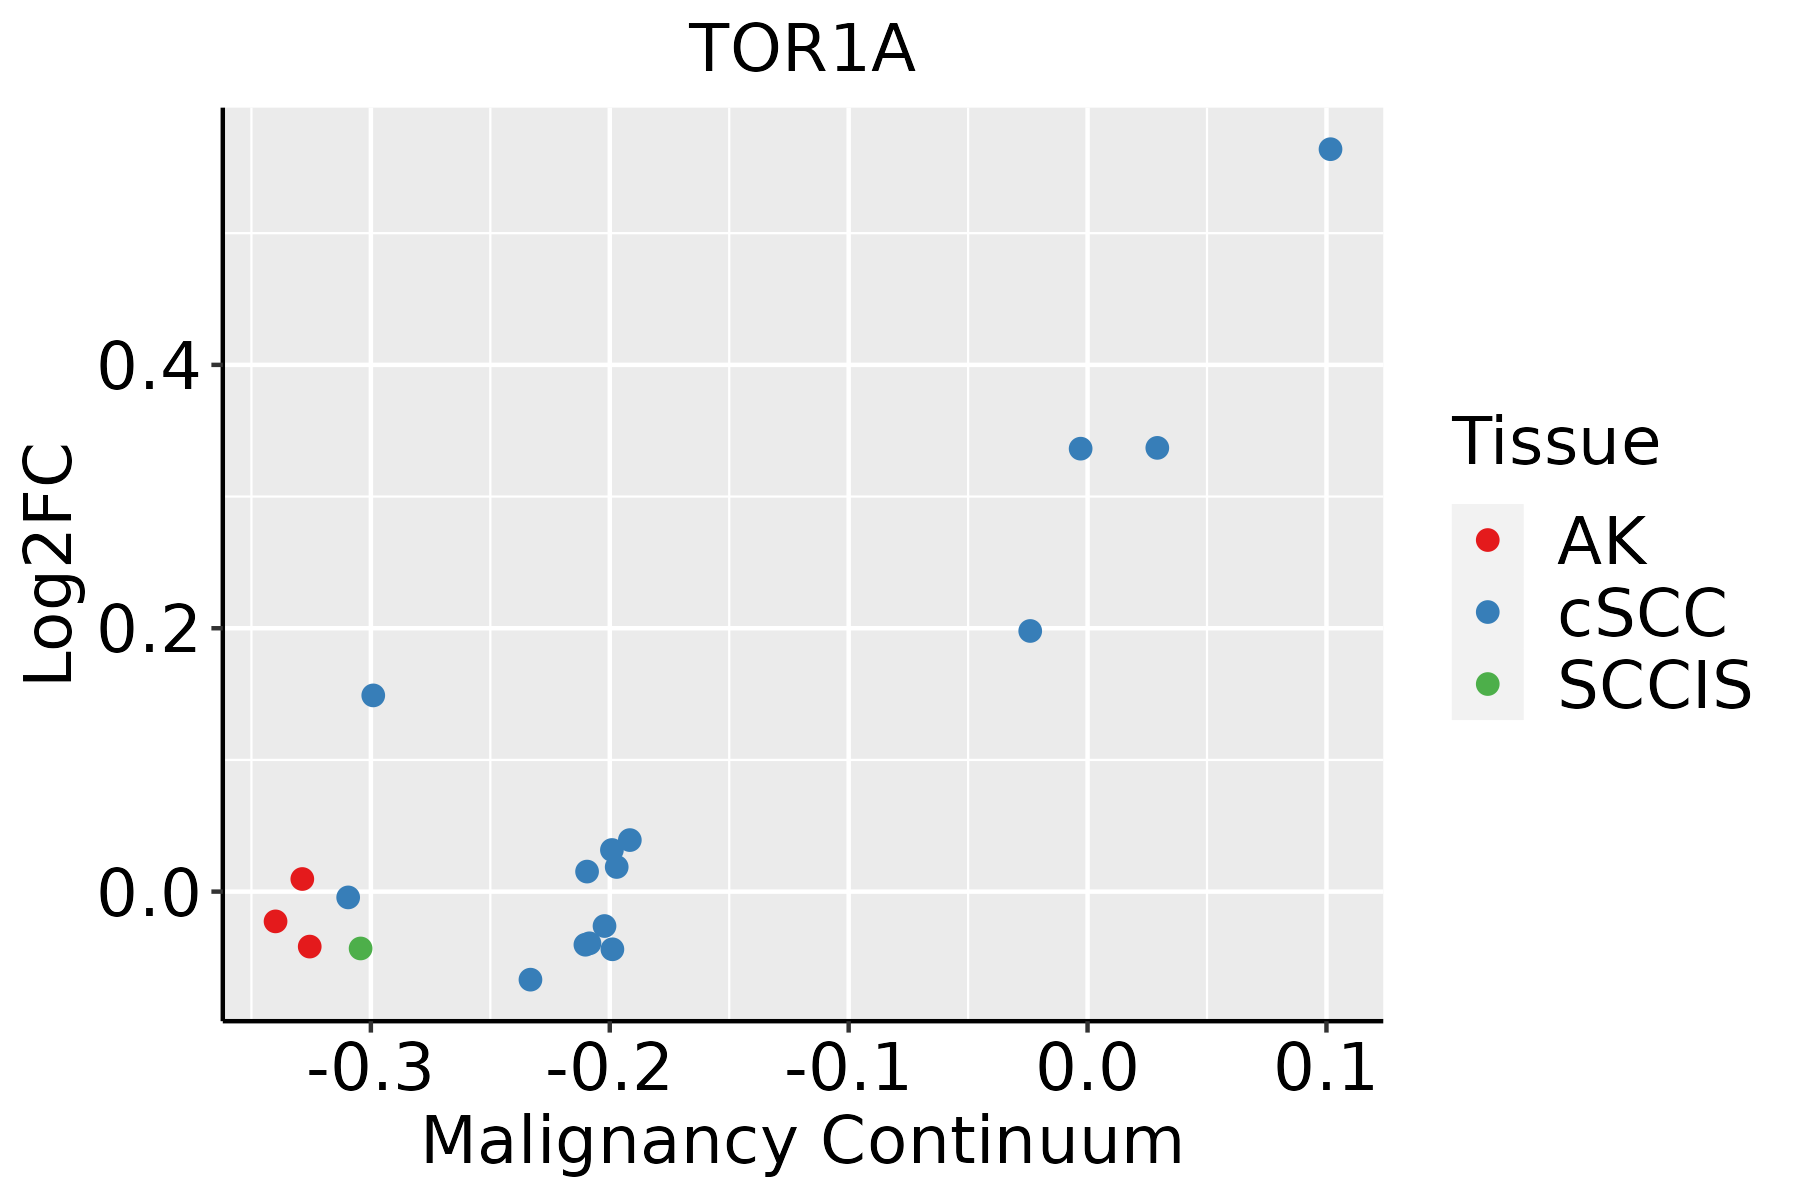
AK: Actinic keratosis
cSCC: Cutaneous squamous cell carcinoma
SCCIS:squamous cell carcinoma in situ
ThyroidThe image shows the transcriptomic changes along malignancy continuum.log2FC in expression of this searched gene in stem-like cells from each diseased tissue sample relative to stem-like cells in normal samples in each tissue plotted against the malignancy continuum. Samples are colored based on if they are from different disease stage.ATC: Anaplastic thyroid cancer
HT: Hashimoto's thyroiditis
PTC: Papillary thyroid cancer
∗log2FC in expression of this searched gene in stem-like cells from each diseased tissue sample relative to stem-like cells in normal samples in each tissue plotted against the malignancy continuum. Samples are colored based on if they are from different disease stage.

Top

Malignant transformation related pathway analysis

check buttonFind out the enriched GO biological processes and KEGG pathways involved in transition from healthy to precancer to cancer
check button Figure of enriched GO biological processes.
TissueDisease StageEnriched GO biological Processes
ColorectumADGO analysis - Figure of enriched GO biological processes: Top 15 enriched GO BP terms are showed in the bar plot of each disease state in each tissue. Each row represents a significant GO biological process which is colored according to the -log10(p.adjust).
ColorectumSERGO analysis - Figure of enriched GO biological processes: Top 15 enriched GO BP terms are showed in the bar plot of each disease state in each tissue. Each row represents a significant GO biological process which is colored according to the -log10(p.adjust).
ColorectumMSSGO analysis - Figure of enriched GO biological processes: Top 15 enriched GO BP terms are showed in the bar plot of each disease state in each tissue. Each row represents a significant GO biological process which is colored according to the -log10(p.adjust).
ColorectumMSI-HGO analysis - Figure of enriched GO biological processes: Top 15 enriched GO BP terms are showed in the bar plot of each disease state in each tissue. Each row represents a significant GO biological process which is colored according to the -log10(p.adjust).
ColorectumFAPGO analysis - Figure of enriched GO biological processes: Top 15 enriched GO BP terms are showed in the bar plot of each disease state in each tissue. Each row represents a significant GO biological process which is colored according to the -log10(p.adjust).
∗Top 15 enriched GO BP terms are showed in the bar plot of each disease state in each tissue. Each row represents a significant GO biological process which is colored according to the -log10(p.adjust).
Page: 1 2 3 4 5 6 7 8 9 

check button Enriched GO biological processes.
GO IDTissueDisease StageDescriptionGene RatioBg Ratiopvaluep.adjustCount
GO:0010498111EsophagusESCCproteasomal protein catabolic process369/8552490/187231.13e-411.80e-38369
GO:005165617EsophagusESCCestablishment of organelle localization273/8552390/187239.13e-231.81e-20273
GO:0034976111EsophagusESCCresponse to endoplasmic reticulum stress192/8552256/187237.15e-221.30e-19192
GO:0006979111EsophagusESCCresponse to oxidative stress303/8552446/187237.15e-221.30e-19303
GO:003450418EsophagusESCCprotein localization to nucleus211/8552290/187234.06e-216.60e-19211
GO:0006457110EsophagusESCCprotein folding163/8552212/187231.13e-201.74e-18163
GO:0035966111EsophagusESCCresponse to topologically incorrect protein125/8552159/187231.44e-171.27e-15125
GO:0035967111EsophagusESCCcellular response to topologically incorrect protein90/8552116/187231.94e-128.11e-1190
GO:003650315EsophagusESCCERAD pathway82/8552107/187235.80e-111.84e-0982
GO:005165016EsophagusESCCestablishment of vesicle localization114/8552161/187238.20e-112.53e-09114
GO:0061077110EsophagusESCCchaperone-mediated protein folding56/855267/187231.52e-104.36e-0956
GO:000699713EsophagusESCCnucleus organization96/8552133/187234.66e-101.21e-0896
GO:005164815EsophagusESCCvesicle localization119/8552177/187235.16e-091.08e-07119
GO:000702914EsophagusESCCendoplasmic reticulum organization65/855287/187233.28e-086.08e-0765
GO:003010018EsophagusESCCregulation of endocytosis135/8552211/187235.75e-081.02e-06135
GO:000699811EsophagusESCCnuclear envelope organization39/855247/187231.48e-072.35e-0639
GO:0006458110EsophagusESCC'de novo' protein folding36/855243/187232.90e-074.20e-0636
GO:004206027EsophagusESCCwound healing243/8552422/187234.62e-076.25e-06243
GO:007176312EsophagusESCCnuclear membrane organization29/855233/187235.30e-077.04e-0629
GO:004580718EsophagusESCCpositive regulation of endocytosis69/8552100/187231.97e-062.29e-0569
Page: 1 2 3 4 5 6 7 8 9 10 11 12 13 

check button Enriched KEGG pathways.
Pathway IDTissueDisease StageDescriptionGene RatioBg Ratiopvaluep.adjustqvalueCount
Page: 1 

Top

Cell-cell communication analysis

check buttonIdentification of potential cell-cell interactions between two cell types and their ligand-receptor pairs for different disease states
LigandReceptorLRpairPathwayTissueDisease Stage
Page: 1 

Top

Single-cell gene regulatory network inference analysis

check buttonFind out the significant the regulons (TFs) and the target genes of each regulon across cell types for different disease states
TFCell TypeTissueDisease StageTarget GeneRSSRegulon Activity
∗The dot plots of a searched regulon are shown for all cell subpopulations in each disease state of each tissue based on the regulon specific score inferred using pySCENIC and by calculating the average expression.
Page: 1 

Top

Somatic mutation of malignant transformation related genes

check buttonAnnotation of somatic variants for genes involved in malignant transformation
Hugo SymbolVariant ClassVariant ClassificationdbSNP RSHGVScHGVSpHGVSp ShortSWISSPROTBIOTYPESIFTPolyPhenTumor Sample BarcodeTissueHistologySexAgeStageTherapy TypesDrugsOutcome
TOR1ASNVMissense_Mutationrs755593280c.331N>Ap.Val111Ilep.V111IO14656protein_codingtolerated(0.09)benign(0.133)TCGA-AC-A8OQ-01Breastbreast invasive carcinomaFemale>=65I/IIUnknownUnknownSD
TOR1ASNVMissense_Mutationc.921N>Ap.Phe307Leup.F307LO14656protein_codingdeleterious(0.04)possibly_damaging(0.802)TCGA-AR-A1AL-01Breastbreast invasive carcinomaFemale<65III/IVHormone TherapyanastrozoleSD
TOR1AinsertionFrame_Shift_Insnovelc.627_628insCAAGp.Gly210GlnfsTer29p.G210Qfs*29O14656protein_codingTCGA-A8-A07P-01Breastbreast invasive carcinomaFemale>=65I/IIChemotherapy5-fluorouracilSD
TOR1AinsertionNonsense_Mutationnovelc.625_626insATCTCAGCTCACTGGAGTCTTGACTTCCTAGGp.Ala209AspfsTer8p.A209Dfs*8O14656protein_codingTCGA-A8-A07P-01Breastbreast invasive carcinomaFemale>=65I/IIChemotherapy5-fluorouracilSD
TOR1AinsertionFrame_Shift_Insnovelc.906_907insCTCCCAGCCCACTCATCGCAp.Glu303LeufsTer9p.E303Lfs*9O14656protein_codingTCGA-AN-A0FX-01Breastbreast invasive carcinomaFemale<65I/IIUnknownUnknownSD
TOR1AdeletionFrame_Shift_Delnovelc.991delNp.Asp331MetfsTer39p.D331Mfs*39O14656protein_codingTCGA-D8-A27V-01Breastbreast invasive carcinomaFemale<65I/IIHormone TherapytamoxiphenSD
TOR1ASNVMissense_Mutationc.871G>Cp.Glu291Glnp.E291QO14656protein_codingtolerated(0.52)benign(0.007)TCGA-C5-A1BI-01Cervixcervical & endocervical cancerFemale<65III/IVChemotherapycisplatinSD
TOR1ASNVMissense_Mutationrs775770765c.715N>Ap.Ala239Thrp.A239TO14656protein_codingtolerated(0.39)benign(0.017)TCGA-C5-A8ZZ-01Cervixcervical & endocervical cancerFemale<65I/IIUnspecificCisplatinSD
TOR1AinsertionFrame_Shift_Insnovelc.781_782insCAAAAp.Asn261ThrfsTer19p.N261Tfs*19O14656protein_codingTCGA-DS-A1OA-01Cervixcervical & endocervical cancerFemale>=65I/IIChemotherapycarboplatinPD
TOR1AinsertionIn_Frame_Insnovelc.779_780insATCp.Arg260_Asn261insSerp.R260_N261insSO14656protein_codingTCGA-DS-A1OA-01Cervixcervical & endocervical cancerFemale>=65I/IIChemotherapycarboplatinPD
Page: 1 2 3 4 

Top

Related drugs of malignant transformation related genes

check buttonIdentification of chemicals and drugs interact with genes involved in malignant transfromation
(DGIdb 4.0)
Entrez IDSymbolCategoryInteraction TypesDrug Claim NameDrug NamePMIDs
1861TOR1ATRANSPORTERhaloperidolHALOPERIDOL27023437
Page: 1