
|
|||||
|
 | |
| |
| |
| |
| |
| |
|
Gene: TOP2B |
Gene summary for TOP2B |
| Gene information | Species | Human | Gene symbol | TOP2B | Gene ID | 7155 |
| Gene name | DNA topoisomerase II beta | |
| Gene Alias | TOPIIB | |
| Cytomap | 3p24.2 | |
| Gene Type | protein-coding | GO ID | GO:0000003 | UniProtAcc | Q02880 |
Top |
Malignant transformation analysis |
| Identification of the aberrant gene expression in precancerous and cancerous lesions by comparing the gene expression of stem-like cells in diseased tissues with normal stem cells |
| Entrez ID | Symbol | Replicates | Species | Organ | Tissue | Adj P-value | Log2FC | Malignancy |
| 7155 | TOP2B | LZE4T | Human | Esophagus | ESCC | 7.78e-04 | 3.32e-02 | 0.0811 |
| 7155 | TOP2B | LZE8T | Human | Esophagus | ESCC | 2.11e-02 | -1.01e-01 | 0.067 |
| 7155 | TOP2B | LZE22D1 | Human | Esophagus | HGIN | 2.85e-03 | -1.71e-02 | 0.0595 |
| 7155 | TOP2B | LZE24T | Human | Esophagus | ESCC | 6.45e-11 | 2.16e-01 | 0.0596 |
| 7155 | TOP2B | LZE6T | Human | Esophagus | ESCC | 1.65e-04 | 2.08e-02 | 0.0845 |
| 7155 | TOP2B | P1T-E | Human | Esophagus | ESCC | 9.07e-03 | 4.59e-03 | 0.0875 |
| 7155 | TOP2B | P2T-E | Human | Esophagus | ESCC | 1.28e-14 | -4.89e-04 | 0.1177 |
| 7155 | TOP2B | P4T-E | Human | Esophagus | ESCC | 3.17e-23 | 3.76e-01 | 0.1323 |
| 7155 | TOP2B | P5T-E | Human | Esophagus | ESCC | 6.12e-10 | -8.87e-02 | 0.1327 |
| 7155 | TOP2B | P8T-E | Human | Esophagus | ESCC | 7.68e-20 | 1.80e-01 | 0.0889 |
| 7155 | TOP2B | P9T-E | Human | Esophagus | ESCC | 1.30e-04 | 4.15e-02 | 0.1131 |
| 7155 | TOP2B | P10T-E | Human | Esophagus | ESCC | 3.83e-27 | 3.91e-01 | 0.116 |
| 7155 | TOP2B | P11T-E | Human | Esophagus | ESCC | 1.06e-10 | 1.09e-01 | 0.1426 |
| 7155 | TOP2B | P12T-E | Human | Esophagus | ESCC | 3.32e-05 | 7.04e-02 | 0.1122 |
| 7155 | TOP2B | P15T-E | Human | Esophagus | ESCC | 3.55e-16 | 1.32e-01 | 0.1149 |
| 7155 | TOP2B | P16T-E | Human | Esophagus | ESCC | 9.81e-19 | 1.75e-01 | 0.1153 |
| 7155 | TOP2B | P17T-E | Human | Esophagus | ESCC | 4.89e-04 | 7.50e-03 | 0.1278 |
| 7155 | TOP2B | P20T-E | Human | Esophagus | ESCC | 3.99e-08 | -2.13e-02 | 0.1124 |
| 7155 | TOP2B | P21T-E | Human | Esophagus | ESCC | 3.15e-12 | 1.20e-01 | 0.1617 |
| 7155 | TOP2B | P22T-E | Human | Esophagus | ESCC | 7.48e-23 | 1.44e-01 | 0.1236 |
| Page: 1 2 3 4 5 6 7 |
| Tissue | Expression Dynamics | Abbreviation |
| Esophagus |  | ESCC: Esophageal squamous cell carcinoma |
| HGIN: High-grade intraepithelial neoplasias | ||
| LGIN: Low-grade intraepithelial neoplasias | ||
| Liver | 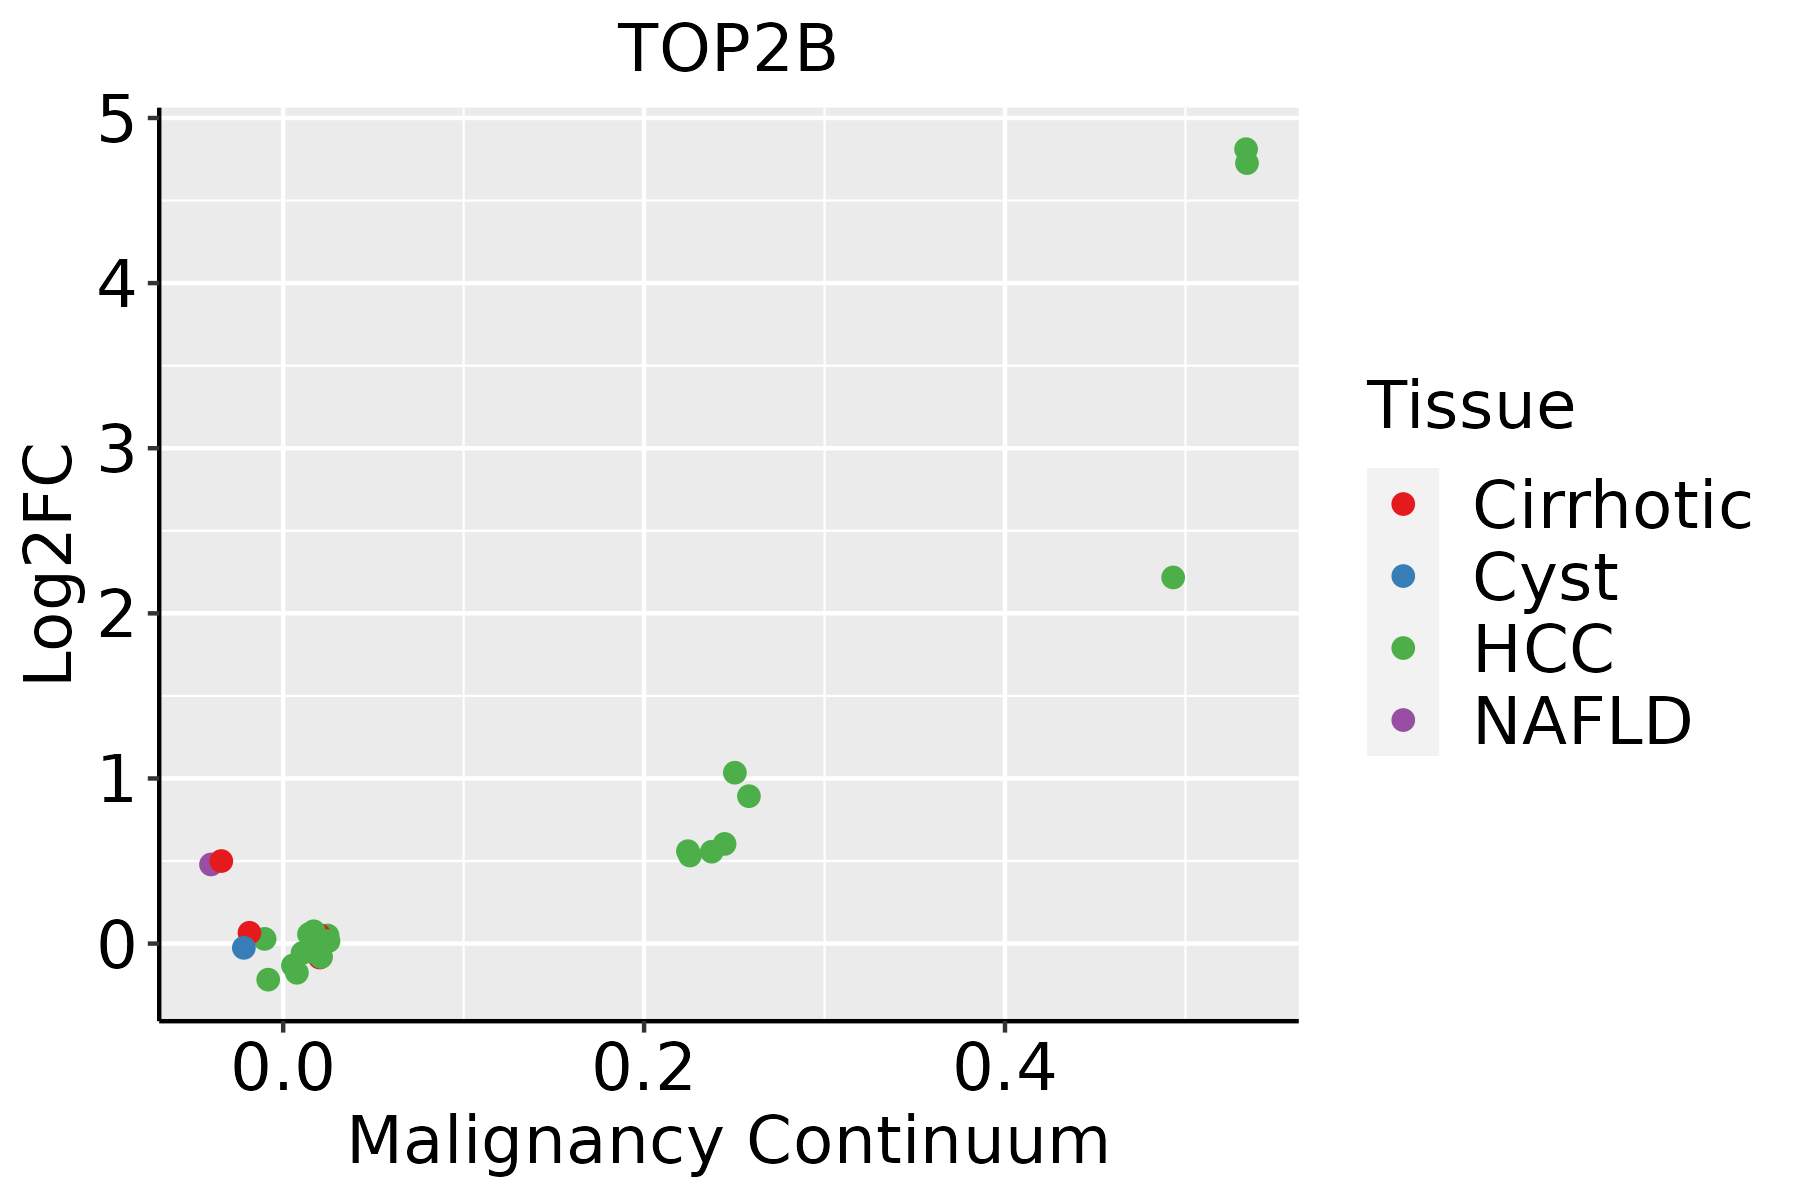 | HCC: Hepatocellular carcinoma |
| NAFLD: Non-alcoholic fatty liver disease | ||
| Oral Cavity |  | EOLP: Erosive Oral lichen planus |
| LP: leukoplakia | ||
| NEOLP: Non-erosive oral lichen planus | ||
| OSCC: Oral squamous cell carcinoma | ||
| Prostate |  | BPH: Benign Prostatic Hyperplasia |
| Skin | 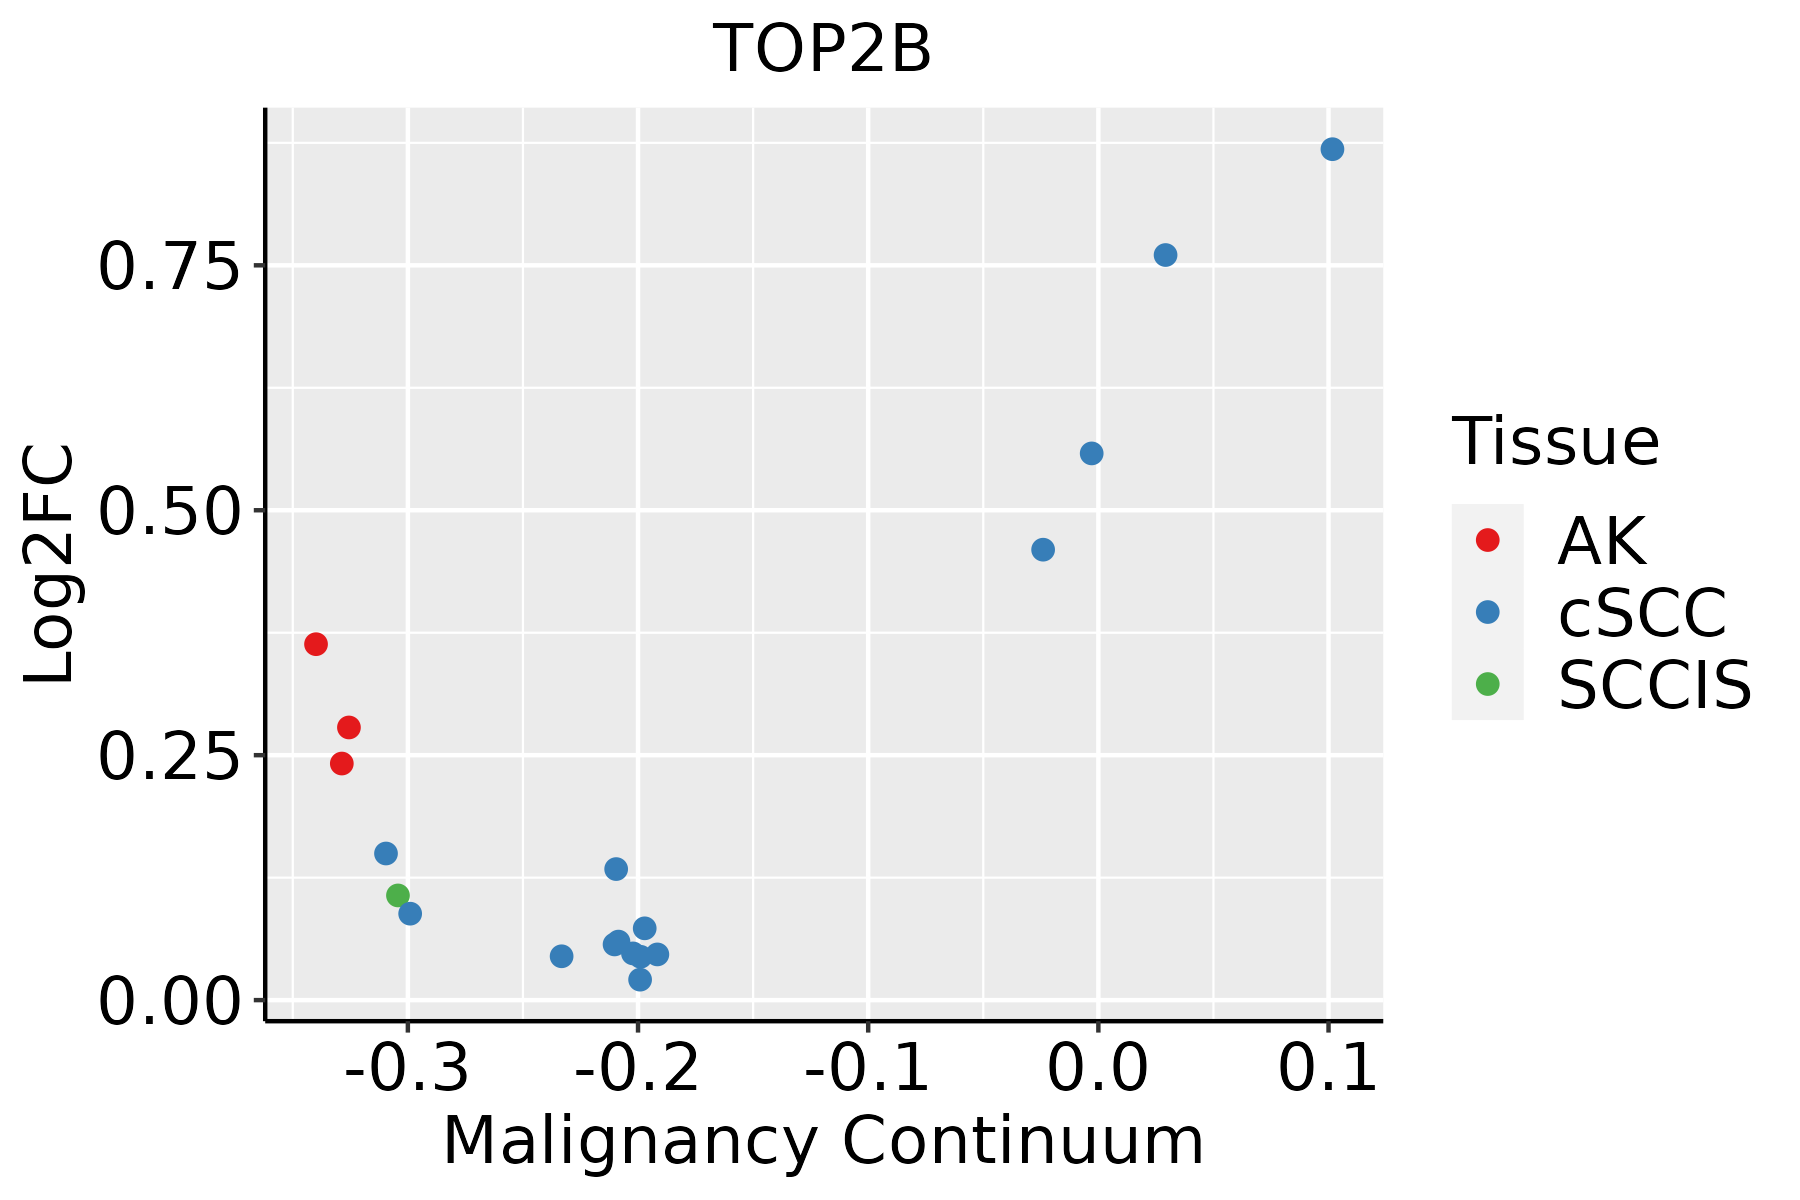 | AK: Actinic keratosis |
| cSCC: Cutaneous squamous cell carcinoma | ||
| SCCIS:squamous cell carcinoma in situ | ||
| Thyroid |  | ATC: Anaplastic thyroid cancer |
| HT: Hashimoto's thyroiditis | ||
| PTC: Papillary thyroid cancer |
| ∗log2FC in expression of this searched gene in stem-like cells from each diseased tissue sample relative to stem-like cells in normal samples in each tissue plotted against the malignancy continuum. Samples are colored based on if they are from different disease stage. |
Top |
Malignant transformation related pathway analysis |
| Find out the enriched GO biological processes and KEGG pathways involved in transition from healthy to precancer to cancer |
| Tissue | Disease Stage | Enriched GO biological Processes |
| Colorectum | AD |  |
| Colorectum | SER |  |
| Colorectum | MSS |  |
| Colorectum | MSI-H |  |
| Colorectum | FAP |  |
| ∗Top 15 enriched GO BP terms are showed in the bar plot of each disease state in each tissue. Each row represents a significant GO biological process which is colored according to the -log10(p.adjust). |
| Page: 1 2 3 4 5 6 7 8 9 |
| GO ID | Tissue | Disease Stage | Description | Gene Ratio | Bg Ratio | pvalue | p.adjust | Count |
| GO:001603227 | Esophagus | HGIN | viral process | 118/2587 | 415/18723 | 3.01e-15 | 6.22e-13 | 118 |
| GO:001905827 | Esophagus | HGIN | viral life cycle | 93/2587 | 317/18723 | 3.66e-13 | 5.63e-11 | 93 |
| GO:001907926 | Esophagus | HGIN | viral genome replication | 48/2587 | 131/18723 | 4.65e-11 | 5.07e-09 | 48 |
| GO:005079225 | Esophagus | HGIN | regulation of viral process | 50/2587 | 164/18723 | 2.53e-08 | 1.49e-06 | 50 |
| GO:004506919 | Esophagus | HGIN | regulation of viral genome replication | 32/2587 | 85/18723 | 3.61e-08 | 2.04e-06 | 32 |
| GO:190390025 | Esophagus | HGIN | regulation of viral life cycle | 45/2587 | 148/18723 | 1.36e-07 | 6.78e-06 | 45 |
| GO:004852419 | Esophagus | HGIN | positive regulation of viral process | 25/2587 | 65/18723 | 6.88e-07 | 2.95e-05 | 25 |
| GO:00070593 | Esophagus | HGIN | chromosome segregation | 71/2587 | 346/18723 | 3.47e-04 | 5.62e-03 | 71 |
| GO:00450709 | Esophagus | HGIN | positive regulation of viral genome replication | 12/2587 | 30/18723 | 3.62e-04 | 5.68e-03 | 12 |
| GO:00396944 | Esophagus | HGIN | viral RNA genome replication | 12/2587 | 35/18723 | 1.80e-03 | 1.94e-02 | 12 |
| GO:0016032111 | Esophagus | ESCC | viral process | 301/8552 | 415/18723 | 3.34e-29 | 1.32e-26 | 301 |
| GO:00008194 | Esophagus | ESCC | sister chromatid segregation | 157/8552 | 202/18723 | 8.41e-21 | 1.33e-18 | 157 |
| GO:0019058111 | Esophagus | ESCC | viral life cycle | 226/8552 | 317/18723 | 1.17e-20 | 1.76e-18 | 226 |
| GO:000705911 | Esophagus | ESCC | chromosome segregation | 238/8552 | 346/18723 | 1.72e-18 | 1.82e-16 | 238 |
| GO:0019079111 | Esophagus | ESCC | viral genome replication | 102/8552 | 131/18723 | 4.31e-14 | 2.19e-12 | 102 |
| GO:00482853 | Esophagus | ESCC | organelle fission | 301/8552 | 488/18723 | 4.64e-13 | 2.12e-11 | 301 |
| GO:00988133 | Esophagus | ESCC | nuclear chromosome segregation | 187/8552 | 281/18723 | 1.00e-12 | 4.36e-11 | 187 |
| GO:0050792111 | Esophagus | ESCC | regulation of viral process | 119/8552 | 164/18723 | 2.19e-12 | 9.03e-11 | 119 |
| GO:00002802 | Esophagus | ESCC | nuclear division | 270/8552 | 439/18723 | 1.17e-11 | 4.24e-10 | 270 |
| GO:1903900111 | Esophagus | ESCC | regulation of viral life cycle | 106/8552 | 148/18723 | 1.26e-10 | 3.72e-09 | 106 |
| Page: 1 2 3 4 5 6 7 8 9 |
| Pathway ID | Tissue | Disease Stage | Description | Gene Ratio | Bg Ratio | pvalue | p.adjust | qvalue | Count |
| hsa015247 | Esophagus | ESCC | Platinum drug resistance | 56/4205 | 73/8465 | 1.85e-06 | 1.13e-05 | 5.78e-06 | 56 |
| hsa0152414 | Esophagus | ESCC | Platinum drug resistance | 56/4205 | 73/8465 | 1.85e-06 | 1.13e-05 | 5.78e-06 | 56 |
| hsa015244 | Liver | Cirrhotic | Platinum drug resistance | 34/2530 | 73/8465 | 1.86e-03 | 8.37e-03 | 5.16e-03 | 34 |
| hsa0152411 | Liver | Cirrhotic | Platinum drug resistance | 34/2530 | 73/8465 | 1.86e-03 | 8.37e-03 | 5.16e-03 | 34 |
| hsa015242 | Liver | HCC | Platinum drug resistance | 52/4020 | 73/8465 | 3.14e-05 | 1.88e-04 | 1.04e-04 | 52 |
| hsa015243 | Liver | HCC | Platinum drug resistance | 52/4020 | 73/8465 | 3.14e-05 | 1.88e-04 | 1.04e-04 | 52 |
| hsa015246 | Oral cavity | OSCC | Platinum drug resistance | 51/3704 | 73/8465 | 5.41e-06 | 2.75e-05 | 1.40e-05 | 51 |
| hsa0152413 | Oral cavity | OSCC | Platinum drug resistance | 51/3704 | 73/8465 | 5.41e-06 | 2.75e-05 | 1.40e-05 | 51 |
| hsa0152422 | Oral cavity | EOLP | Platinum drug resistance | 18/1218 | 73/8465 | 1.35e-02 | 3.53e-02 | 2.08e-02 | 18 |
| hsa0152432 | Oral cavity | EOLP | Platinum drug resistance | 18/1218 | 73/8465 | 1.35e-02 | 3.53e-02 | 2.08e-02 | 18 |
| hsa015245 | Prostate | BPH | Platinum drug resistance | 24/1718 | 73/8465 | 7.78e-03 | 2.49e-02 | 1.54e-02 | 24 |
| hsa0152412 | Prostate | BPH | Platinum drug resistance | 24/1718 | 73/8465 | 7.78e-03 | 2.49e-02 | 1.54e-02 | 24 |
| hsa0152421 | Prostate | Tumor | Platinum drug resistance | 25/1791 | 73/8465 | 6.47e-03 | 2.16e-02 | 1.34e-02 | 25 |
| hsa0152431 | Prostate | Tumor | Platinum drug resistance | 25/1791 | 73/8465 | 6.47e-03 | 2.16e-02 | 1.34e-02 | 25 |
| Page: 1 |
Top |
Cell-cell communication analysis |
| Identification of potential cell-cell interactions between two cell types and their ligand-receptor pairs for different disease states |
| Ligand | Receptor | LRpair | Pathway | Tissue | Disease Stage |
| Page: 1 |
Top |
Single-cell gene regulatory network inference analysis |
| Find out the significant the regulons (TFs) and the target genes of each regulon across cell types for different disease states |
| TF | Cell Type | Tissue | Disease Stage | Target Gene | RSS | Regulon Activity |
| ∗The dot plots of a searched regulon are shown for all cell subpopulations in each disease state of each tissue based on the regulon specific score inferred using pySCENIC and by calculating the average expression. |
| Page: 1 |
Top |
Somatic mutation of malignant transformation related genes |
| Annotation of somatic variants for genes involved in malignant transformation |
| Hugo Symbol | Variant Class | Variant Classification | dbSNP RS | HGVSc | HGVSp | HGVSp Short | SWISSPROT | BIOTYPE | SIFT | PolyPhen | Tumor Sample Barcode | Tissue | Histology | Sex | Age | Stage | Therapy Types | Drugs | Outcome |
| TOP2B | SNV | Missense_Mutation | novel | c.4805G>C | p.Arg1602Pro | p.R1602P | Q02880 | protein_coding | deleterious_low_confidence(0) | probably_damaging(0.999) | TCGA-A2-A25E-01 | Breast | breast invasive carcinoma | Female | <65 | III/IV | Chemotherapy | cytoxan | PD |
| TOP2B | SNV | Missense_Mutation | c.2446N>T | p.His816Tyr | p.H816Y | Q02880 | protein_coding | tolerated(0.13) | possibly_damaging(0.625) | TCGA-AC-A23H-01 | Breast | breast invasive carcinoma | Female | >=65 | I/II | Unknown | Unknown | PD | |
| TOP2B | SNV | Missense_Mutation | c.1705N>T | p.His569Tyr | p.H569Y | Q02880 | protein_coding | deleterious(0) | probably_damaging(0.999) | TCGA-AC-A23H-01 | Breast | breast invasive carcinoma | Female | >=65 | I/II | Unknown | Unknown | PD | |
| TOP2B | SNV | Missense_Mutation | c.1187N>T | p.Ser396Phe | p.S396F | Q02880 | protein_coding | deleterious(0) | probably_damaging(0.984) | TCGA-AC-A23H-01 | Breast | breast invasive carcinoma | Female | >=65 | I/II | Unknown | Unknown | PD | |
| TOP2B | SNV | Missense_Mutation | novel | c.4006N>C | p.Ser1336Pro | p.S1336P | Q02880 | protein_coding | deleterious(0) | probably_damaging(0.997) | TCGA-AN-A046-01 | Breast | breast invasive carcinoma | Female | >=65 | I/II | Unknown | Unknown | SD |
| TOP2B | SNV | Missense_Mutation | novel | c.1102N>A | p.Ala368Thr | p.A368T | Q02880 | protein_coding | tolerated(0.21) | benign(0.145) | TCGA-AN-A046-01 | Breast | breast invasive carcinoma | Female | >=65 | I/II | Unknown | Unknown | SD |
| TOP2B | SNV | Missense_Mutation | c.3551T>G | p.Leu1184Arg | p.L1184R | Q02880 | protein_coding | deleterious(0) | probably_damaging(0.998) | TCGA-C8-A26Y-01 | Breast | breast invasive carcinoma | Female | >=65 | I/II | Unknown | Unknown | SD | |
| TOP2B | insertion | In_Frame_Ins | novel | c.2412_2413insTACATAACCCAT | p.Leu804_Leu805insTyrIleThrHis | p.L804_L805insYITH | Q02880 | protein_coding | TCGA-A2-A0CP-01 | Breast | breast invasive carcinoma | Female | <65 | I/II | Chemotherapy | cytoxan | SD | ||
| TOP2B | insertion | Nonsense_Mutation | novel | c.2411_2412insCCTATTACTCTAAATAAA | p.Leu804delinsPheLeuLeuLeuTerIleLys | p.L804delinsFLLL*IK | Q02880 | protein_coding | TCGA-A2-A0CP-01 | Breast | breast invasive carcinoma | Female | <65 | I/II | Chemotherapy | cytoxan | SD | ||
| TOP2B | insertion | In_Frame_Ins | novel | c.2031_2032insCTCTTCATATAC | p.Lys677_Lys678insLeuPheIleTyr | p.K677_K678insLFIY | Q02880 | protein_coding | TCGA-AR-A0U0-01 | Breast | breast invasive carcinoma | Female | >=65 | I/II | Unknown | Unknown | SD |
| Page: 1 2 3 4 5 6 7 8 9 10 11 12 13 14 15 16 17 |
Top |
Related drugs of malignant transformation related genes |
| Identification of chemicals and drugs interact with genes involved in malignant transfromation |
| (DGIdb 4.0) |
| Entrez ID | Symbol | Category | Interaction Types | Drug Claim Name | Drug Name | PMIDs |
| 7155 | TOP2B | DRUGGABLE GENOME, ENZYME | Salvicine | |||
| 7155 | TOP2B | DRUGGABLE GENOME, ENZYME | LYCOBETAINE | LYCOBETAINE | 23266176 | |
| 7155 | TOP2B | DRUGGABLE GENOME, ENZYME | DEHYDROEQUOL | IDRONOXIL | ||
| 7155 | TOP2B | DRUGGABLE GENOME, ENZYME | CAP-7.1 | |||
| 7155 | TOP2B | DRUGGABLE GENOME, ENZYME | VORELOXIN | VOSAROXIN | ||
| 7155 | TOP2B | DRUGGABLE GENOME, ENZYME | Nemorubicin | NEMORUBICIN | ||
| 7155 | TOP2B | DRUGGABLE GENOME, ENZYME | NK-314 | |||
| 7155 | TOP2B | DRUGGABLE GENOME, ENZYME | Epirubicin | EPIRUBICIN | ||
| 7155 | TOP2B | DRUGGABLE GENOME, ENZYME | DIGITOXIN | DIGITOXIN | 16309315 | |
| 7155 | TOP2B | DRUGGABLE GENOME, ENZYME | Berubicin | BERUBICIN |
| Page: 1 2 3 4 5 6 7 8 |

Copyright 2023-Present -The University of Texas Health Science Center at Houston |