Schematic overview of the cellular and molecular mechanisms involved in the cancer progression, including the proposed cellular and molecular mechanisms in cancer cells trajectory. AT1: alveolar type 1 cells; AT2: alveolar type 2 cells; AAH: atypical adenomatous hyperplasia; AIS: adenocarcinoma in situ; MIA: minimally invasive adenocarcinoma; IA: invasive adenocarcinoma; EMT: epithelial-mesenchymal transition

Home

Download

Statistics

Help

Contact

Center for Computational Systems Medicine
leaf

Gene summary

leaf

Malignant transformation analysis

leaf

Malignant transformation related pathway analysis

leaf

Cell-cell communication analysis

leaf

Single-cell gene regulatory network inference analysis

leaf

Somatic mutation of malignant transformation related genes

leaf

Related drugs of malignant transformation related genes

Gene: TOP2A

Gene summary for TOP2A

check button Gene summary.

Gene informationSpeciesHuman
Gene symbol

TOP2A

Gene ID

7153

Gene nameDNA topoisomerase II alpha
Gene AliasTOP2
Cytomap17q21.2
Gene Typeprotein-coding
GO ID

GO:0000003

UniProtAcc

P11388


Top

Malignant transformation analysis

check button Identification of the aberrant gene expression in precancerous and cancerous lesions by comparing the gene expression of stem-like cells in diseased tissues with normal stem cells
check button Malignant transformation involving gene list.
Entrez IDSymbolReplicatesSpeciesOrganTissueAdj P-valueLog2FCMalignancy
7153TOP2AGSM4909282HumanBreastIDC7.47e-184.64e-01-0.0288
7153TOP2AGSM4909285HumanBreastIDC3.86e-021.28e-010.21
7153TOP2AGSM4909287HumanBreastIDC9.31e-063.63e-010.2057
7153TOP2AGSM4909318HumanBreastIDC2.26e-047.14e-010.2031
7153TOP2AGSM4909319HumanBreastIDC2.41e-031.87e-010.1563
7153TOP2AM1HumanBreastIDC3.07e-033.15e-010.1577
7153TOP2AM2HumanBreastIDC7.33e-056.31e-010.21
7153TOP2ANCCBC14HumanBreastDCIS6.68e-106.40e-010.2021
7153TOP2AP1HumanBreastIDC2.65e-044.04e-010.1527
7153TOP2AHTA11_696_2000001011HumanColorectumAD9.56e-073.38e-01-0.1464
7153TOP2AHTA11_1391_2000001011HumanColorectumAD2.48e-044.93e-01-0.059
7153TOP2AHTA11_99999970781_79442HumanColorectumMSS4.46e-071.99e-010.294
7153TOP2AA002-C-021HumanColorectumFAP8.13e-031.02e-010.1171
7153TOP2ALZE2THumanEsophagusESCC1.86e-041.20e+000.082
7153TOP2ALZE21THumanEsophagusESCC1.61e-046.55e-010.0655
7153TOP2ALZE6THumanEsophagusESCC6.79e-074.96e-010.0845
7153TOP2AP2T-EHumanEsophagusESCC8.42e-181.20e+000.1177
7153TOP2AP4T-EHumanEsophagusESCC1.77e-095.80e-010.1323
7153TOP2AP5T-EHumanEsophagusESCC6.46e-126.11e-010.1327
7153TOP2AP8T-EHumanEsophagusESCC1.03e-034.58e-010.0889
Page: 1 2 3 4 5 

check button Transcriptomic changes along malignancy continuum.
TissueExpression DynamicsAbbreviation
BreastThe image shows the transcriptomic changes along malignancy continuum.log2FC in expression of this searched gene in stem-like cells from each diseased tissue sample relative to stem-like cells in normal samples in each tissue plotted against the malignancy continuum. Samples are colored based on if they are from different disease stage.
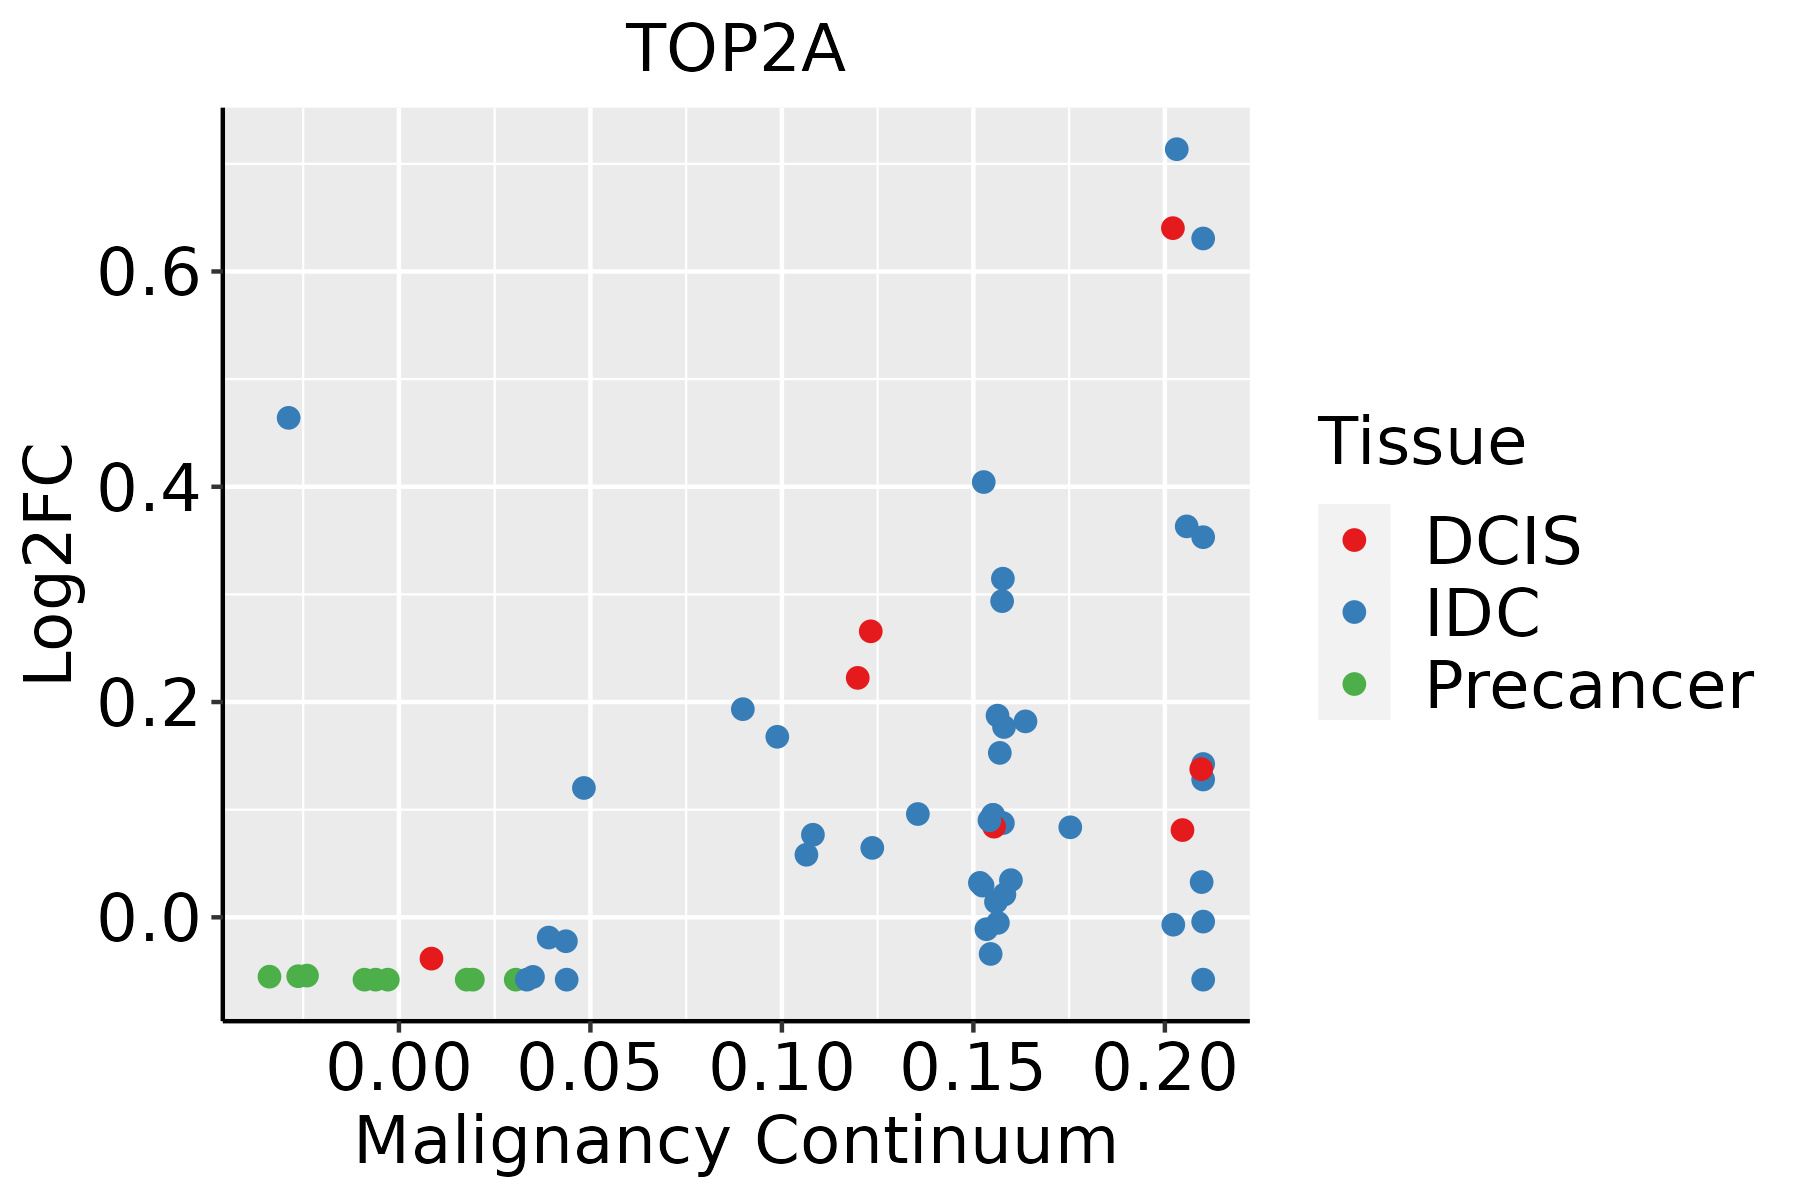
IDC: Invasive ductal carcinoma
DCIS: Ductal carcinoma in situ
Precancer(BRCA1-mut): Precancerous lesion from BRCA1 mutation carriers
Colorectum (GSE201348)The image shows the transcriptomic changes along malignancy continuum.log2FC in expression of this searched gene in stem-like cells from each diseased tissue sample relative to stem-like cells in normal samples in each tissue plotted against the malignancy continuum. Samples are colored based on if they are from different disease stage.FAP: Familial adenomatous polyposis
CRC: Colorectal cancer
Colorectum (HTA11)The image shows the transcriptomic changes along malignancy continuum.log2FC in expression of this searched gene in stem-like cells from each diseased tissue sample relative to stem-like cells in normal samples in each tissue plotted against the malignancy continuum. Samples are colored based on if they are from different disease stage.AD: Adenomas
SER: Sessile serrated lesions
MSI-H: Microsatellite-high colorectal cancer
MSS: Microsatellite stable colorectal cancer
EsophagusThe image shows the transcriptomic changes along malignancy continuum.log2FC in expression of this searched gene in stem-like cells from each diseased tissue sample relative to stem-like cells in normal samples in each tissue plotted against the malignancy continuum. Samples are colored based on if they are from different disease stage.ESCC: Esophageal squamous cell carcinoma
HGIN: High-grade intraepithelial neoplasias
LGIN: Low-grade intraepithelial neoplasias
LiverThe image shows the transcriptomic changes along malignancy continuum.log2FC in expression of this searched gene in stem-like cells from each diseased tissue sample relative to stem-like cells in normal samples in each tissue plotted against the malignancy continuum. Samples are colored based on if they are from different disease stage.
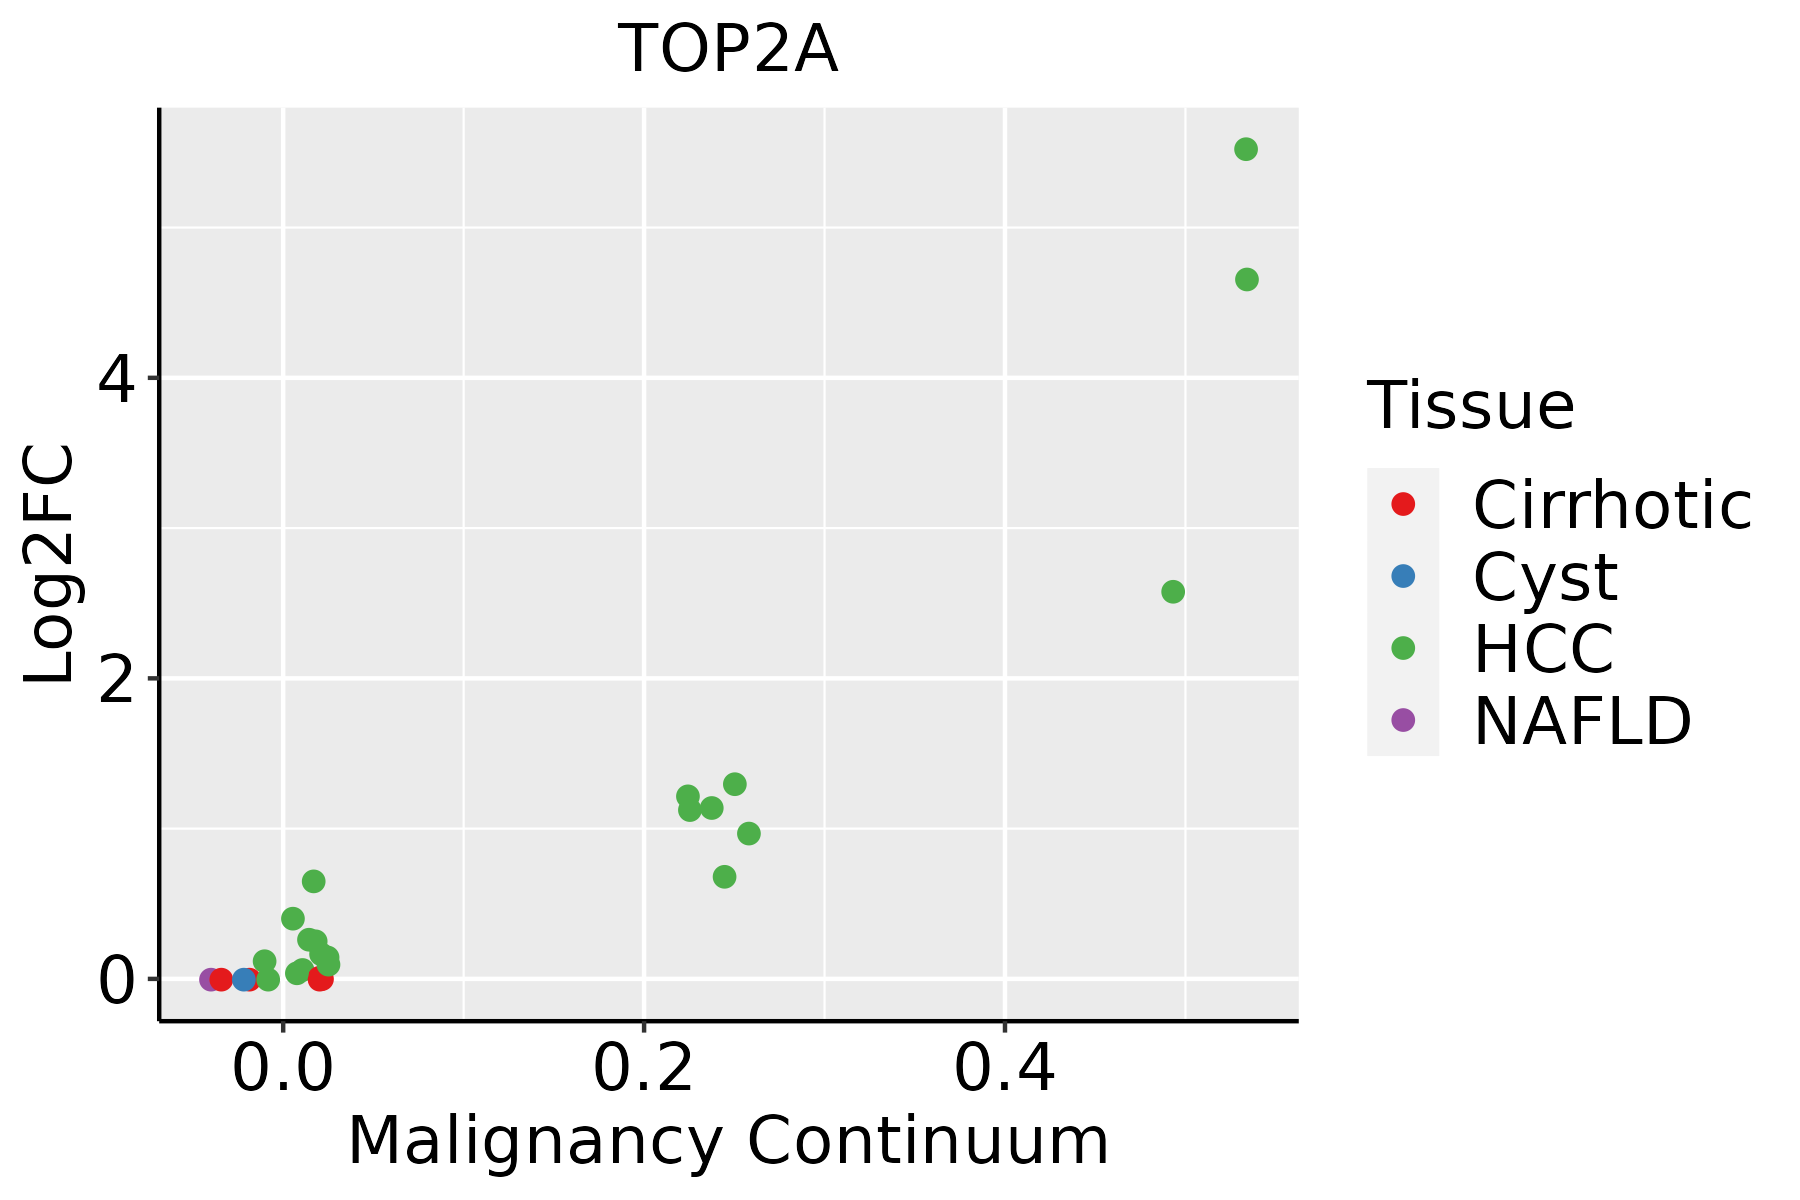
HCC: Hepatocellular carcinoma
NAFLD: Non-alcoholic fatty liver disease
Oral CavityThe image shows the transcriptomic changes along malignancy continuum.log2FC in expression of this searched gene in stem-like cells from each diseased tissue sample relative to stem-like cells in normal samples in each tissue plotted against the malignancy continuum. Samples are colored based on if they are from different disease stage.
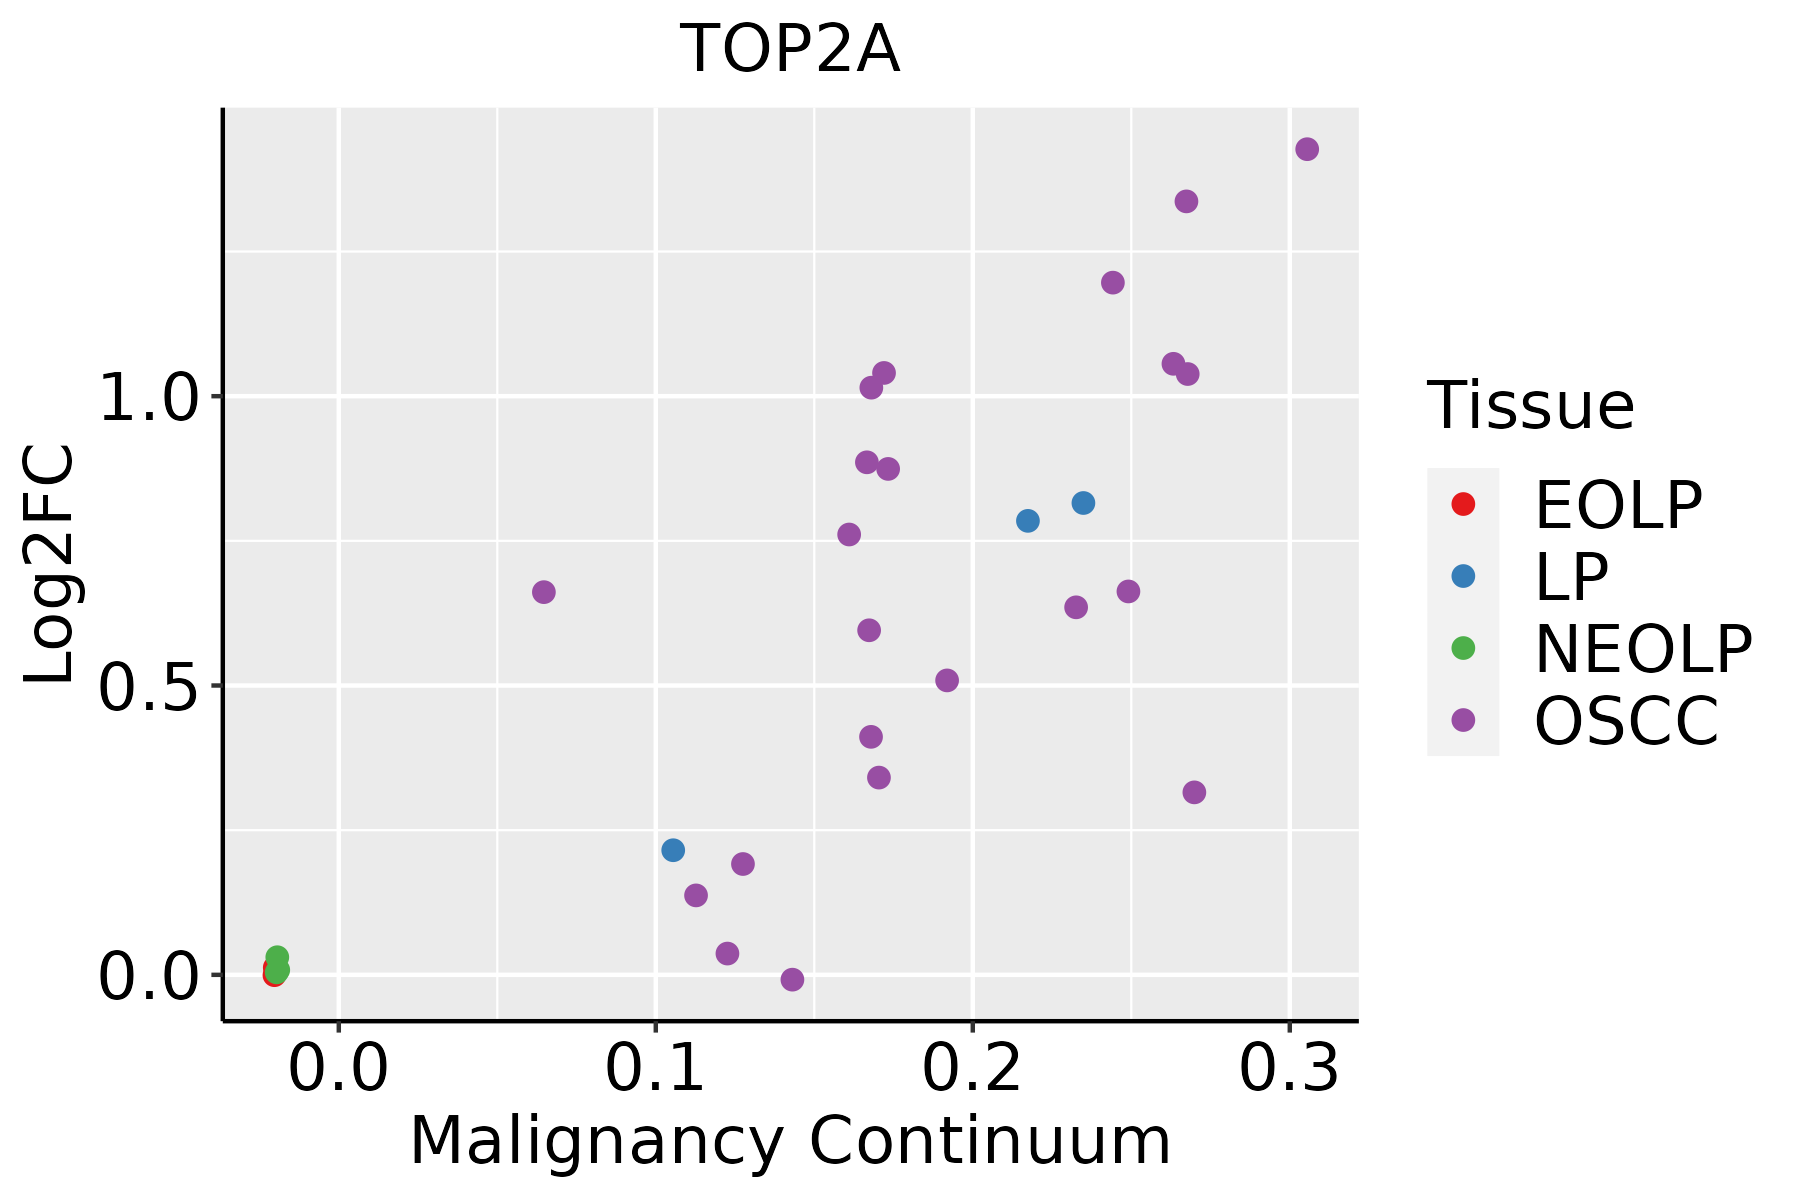
EOLP: Erosive Oral lichen planus
LP: leukoplakia
NEOLP: Non-erosive oral lichen planus
OSCC: Oral squamous cell carcinoma
SkinThe image shows the transcriptomic changes along malignancy continuum.log2FC in expression of this searched gene in stem-like cells from each diseased tissue sample relative to stem-like cells in normal samples in each tissue plotted against the malignancy continuum. Samples are colored based on if they are from different disease stage.
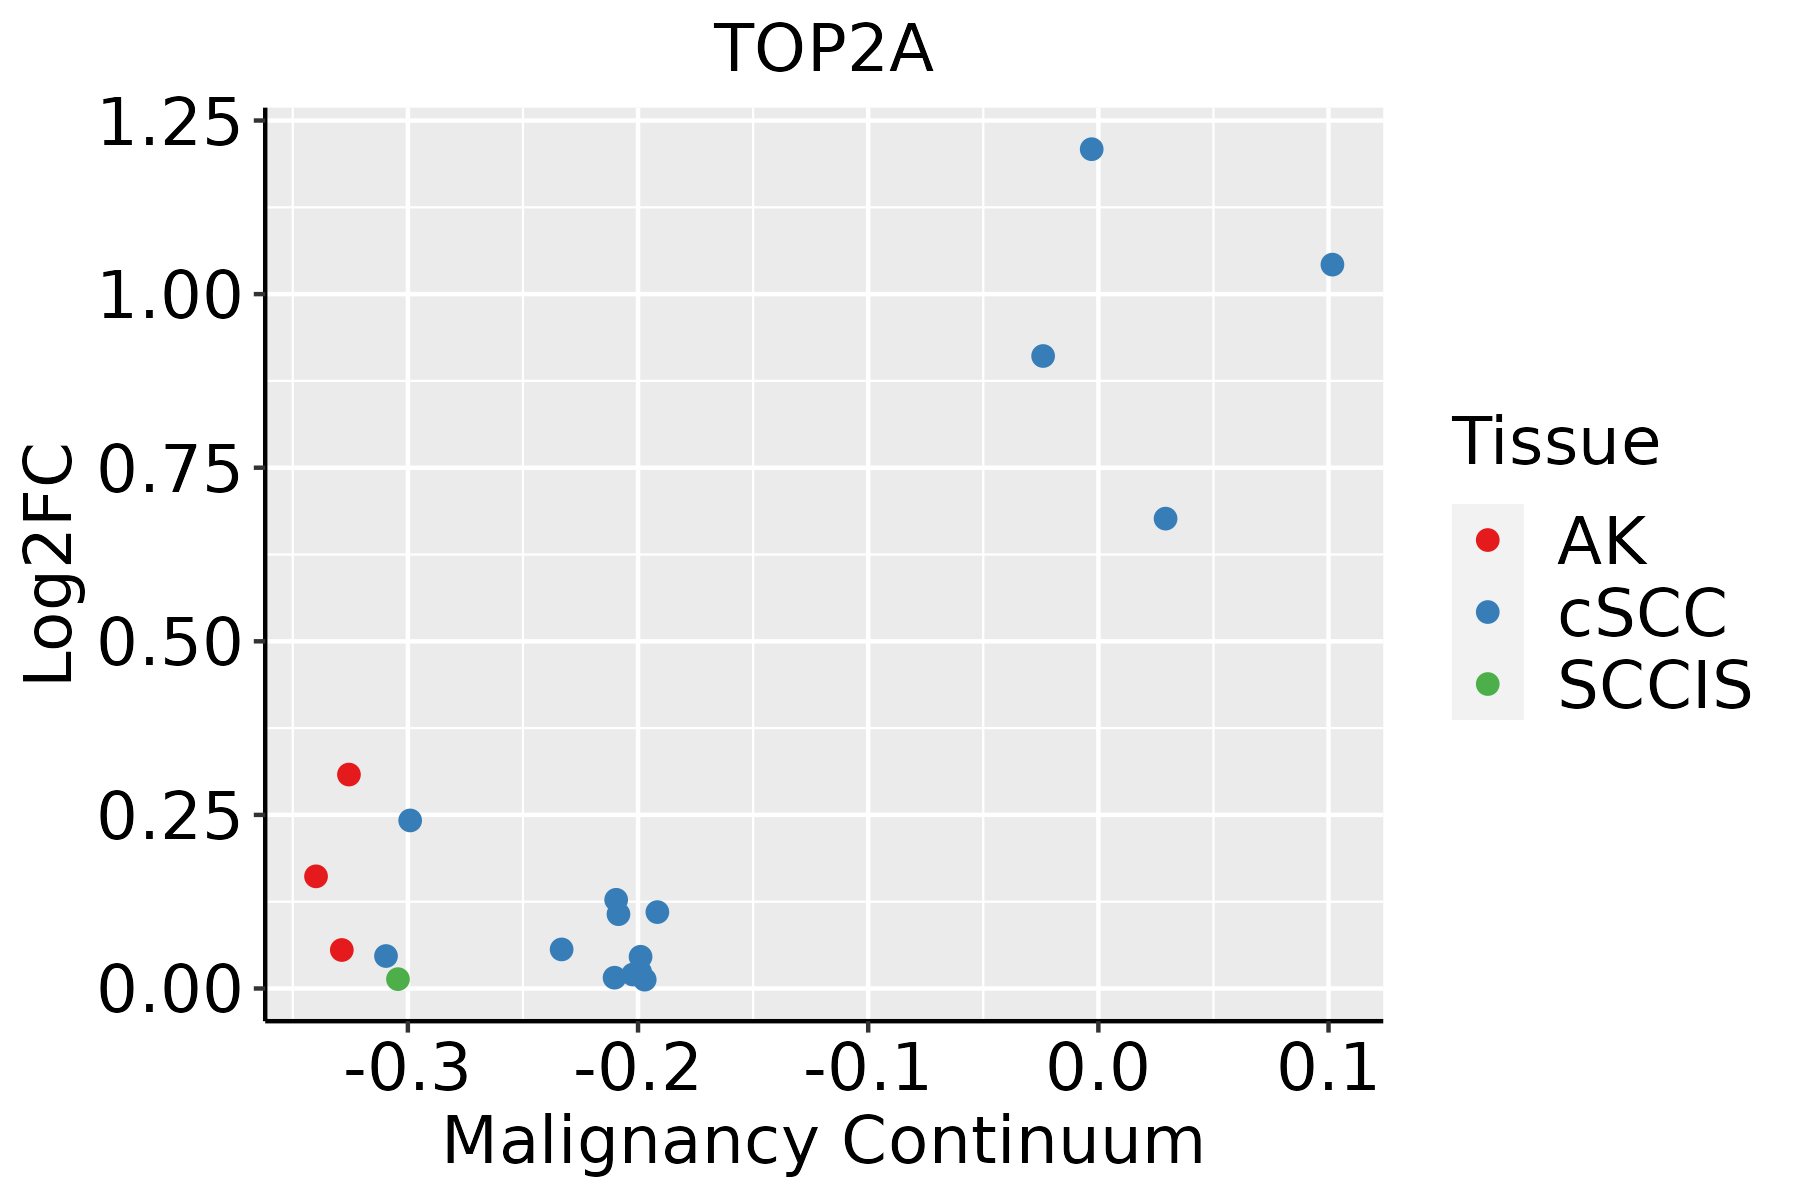
AK: Actinic keratosis
cSCC: Cutaneous squamous cell carcinoma
SCCIS:squamous cell carcinoma in situ
ThyroidThe image shows the transcriptomic changes along malignancy continuum.log2FC in expression of this searched gene in stem-like cells from each diseased tissue sample relative to stem-like cells in normal samples in each tissue plotted against the malignancy continuum. Samples are colored based on if they are from different disease stage.ATC: Anaplastic thyroid cancer
HT: Hashimoto's thyroiditis
PTC: Papillary thyroid cancer
∗log2FC in expression of this searched gene in stem-like cells from each diseased tissue sample relative to stem-like cells in normal samples in each tissue plotted against the malignancy continuum. Samples are colored based on if they are from different disease stage.

Top

Malignant transformation related pathway analysis

check buttonFind out the enriched GO biological processes and KEGG pathways involved in transition from healthy to precancer to cancer
check button Figure of enriched GO biological processes.
TissueDisease StageEnriched GO biological Processes
ColorectumADGO analysis - Figure of enriched GO biological processes: Top 15 enriched GO BP terms are showed in the bar plot of each disease state in each tissue. Each row represents a significant GO biological process which is colored according to the -log10(p.adjust).
ColorectumSERGO analysis - Figure of enriched GO biological processes: Top 15 enriched GO BP terms are showed in the bar plot of each disease state in each tissue. Each row represents a significant GO biological process which is colored according to the -log10(p.adjust).
ColorectumMSSGO analysis - Figure of enriched GO biological processes: Top 15 enriched GO BP terms are showed in the bar plot of each disease state in each tissue. Each row represents a significant GO biological process which is colored according to the -log10(p.adjust).
ColorectumMSI-HGO analysis - Figure of enriched GO biological processes: Top 15 enriched GO BP terms are showed in the bar plot of each disease state in each tissue. Each row represents a significant GO biological process which is colored according to the -log10(p.adjust).
ColorectumFAPGO analysis - Figure of enriched GO biological processes: Top 15 enriched GO BP terms are showed in the bar plot of each disease state in each tissue. Each row represents a significant GO biological process which is colored according to the -log10(p.adjust).
∗Top 15 enriched GO BP terms are showed in the bar plot of each disease state in each tissue. Each row represents a significant GO biological process which is colored according to the -log10(p.adjust).
Page: 1 2 3 4 5 6 7 8 9 

check button Enriched GO biological processes.
GO IDTissueDisease StageDescriptionGene RatioBg Ratiopvaluep.adjustCount
GO:001603214BreastIDCviral process75/1434415/187231.98e-124.02e-1075
GO:001905814BreastIDCviral life cycle61/1434317/187231.61e-112.77e-0961
GO:001907914BreastIDCviral genome replication32/1434131/187232.82e-092.46e-0732
GO:005079214BreastIDCregulation of viral process36/1434164/187236.55e-095.03e-0736
GO:190390014BreastIDCregulation of viral life cycle30/1434148/187237.25e-073.35e-0530
GO:004506913BreastIDCregulation of viral genome replication20/143485/187234.77e-061.63e-0420
GO:004852413BreastIDCpositive regulation of viral process17/143465/187235.31e-061.75e-0417
GO:00450706BreastIDCpositive regulation of viral genome replication9/143430/187232.89e-044.39e-039
GO:00485117BreastIDCrhythmic process38/1434298/187231.34e-031.39e-0238
GO:00330445BreastIDCregulation of chromosome organization26/1434187/187232.22e-032.06e-0226
GO:001603224BreastDCISviral process73/1390415/187233.40e-126.88e-1073
GO:001905824BreastDCISviral life cycle59/1390317/187234.05e-115.74e-0959
GO:001907923BreastDCISviral genome replication30/1390131/187232.12e-081.45e-0630
GO:005079222BreastDCISregulation of viral process34/1390164/187233.58e-082.30e-0634
GO:190390022BreastDCISregulation of viral life cycle28/1390148/187233.79e-061.16e-0428
GO:004852421BreastDCISpositive regulation of viral process16/139065/187231.56e-053.79e-0416
GO:004506923BreastDCISregulation of viral genome replication18/139085/187234.23e-058.98e-0418
GO:004507012BreastDCISpositive regulation of viral genome replication8/139030/187231.21e-031.28e-028
GO:004851113BreastDCISrhythmic process37/1390298/187231.44e-031.47e-0237
GO:003304412BreastDCISregulation of chromosome organization26/1390187/187231.44e-031.47e-0226
Page: 1 2 3 4 5 6 7 8 9 10 11 

check button Enriched KEGG pathways.
Pathway IDTissueDisease StageDescriptionGene RatioBg Ratiopvaluep.adjustqvalueCount
hsa01524ColorectumMSSPlatinum drug resistance25/187573/84651.17e-023.99e-022.44e-0225
hsa015241ColorectumMSSPlatinum drug resistance25/187573/84651.17e-023.99e-022.44e-0225
hsa015247EsophagusESCCPlatinum drug resistance56/420573/84651.85e-061.13e-055.78e-0656
hsa0152414EsophagusESCCPlatinum drug resistance56/420573/84651.85e-061.13e-055.78e-0656
hsa015242LiverHCCPlatinum drug resistance52/402073/84653.14e-051.88e-041.04e-0452
hsa015243LiverHCCPlatinum drug resistance52/402073/84653.14e-051.88e-041.04e-0452
hsa015246Oral cavityOSCCPlatinum drug resistance51/370473/84655.41e-062.75e-051.40e-0551
hsa0152413Oral cavityOSCCPlatinum drug resistance51/370473/84655.41e-062.75e-051.40e-0551
Page: 1 

Top

Cell-cell communication analysis

check buttonIdentification of potential cell-cell interactions between two cell types and their ligand-receptor pairs for different disease states
LigandReceptorLRpairPathwayTissueDisease Stage
Page: 1 

Top

Single-cell gene regulatory network inference analysis

check buttonFind out the significant the regulons (TFs) and the target genes of each regulon across cell types for different disease states
TFCell TypeTissueDisease StageTarget GeneRSSRegulon Activity
∗The dot plots of a searched regulon are shown for all cell subpopulations in each disease state of each tissue based on the regulon specific score inferred using pySCENIC and by calculating the average expression.
Page: 1 

Top

Somatic mutation of malignant transformation related genes

check buttonAnnotation of somatic variants for genes involved in malignant transformation
Hugo SymbolVariant ClassVariant ClassificationdbSNP RSHGVScHGVSpHGVSp ShortSWISSPROTBIOTYPESIFTPolyPhenTumor Sample BarcodeTissueHistologySexAgeStageTherapy TypesDrugsOutcome
TOP2ASNVMissense_Mutationnovelc.4138N>Ap.Glu1380Lysp.E1380KP11388protein_codingtolerated(0.53)benign(0.01)TCGA-3C-AALI-01Breastbreast invasive carcinomaFemale<65I/IIUnspecificPoly EComplete Response
TOP2ASNVMissense_Mutationc.570N>Gp.Phe190Leup.F190LP11388protein_codingtolerated(0.11)possibly_damaging(0.511)TCGA-A2-A0CX-01Breastbreast invasive carcinomaFemale<65I/IIChemotherapyadriamycinSD
TOP2ASNVMissense_Mutationrs777230505c.3644N>Ap.Arg1215Hisp.R1215HP11388protein_codingtolerated(0.55)benign(0)TCGA-AQ-A0Y5-01Breastbreast invasive carcinomaFemale>=65III/IVChemotherapycytoxanSD
TOP2ASNVMissense_Mutationc.2843A>Gp.Glu948Glyp.E948GP11388protein_codingdeleterious(0.03)benign(0.05)TCGA-E9-A1RD-01Breastbreast invasive carcinomaFemale>=65I/IIHormone TherapytamoxiphenSD
TOP2AinsertionNonsense_Mutationnovelc.1399_1400insTTGGTTAAATTGAGGATACTTACGTTTGCTCTTATTTCATp.Thr467IlefsTer3p.T467Ifs*3P11388protein_codingTCGA-A8-A06P-01Breastbreast invasive carcinomaFemale<65III/IVUnspecificSD
TOP2AinsertionFrame_Shift_Insnovelc.2071_2072insGCTTATACTTTCACp.Thr691SerfsTer8p.T691Sfs*8P11388protein_codingTCGA-AR-A0U0-01Breastbreast invasive carcinomaFemale>=65I/IIUnknownUnknownSD
TOP2AinsertionNonsense_Mutationnovelc.1736_1737insTGTTTCAACTGGCTAAAp.Lys579AsnfsTer6p.K579Nfs*6P11388protein_codingTCGA-AR-A0U2-01Breastbreast invasive carcinomaFemale<65III/IVHormone TherapytamoxiphenPD
TOP2ASNVMissense_Mutationc.4144G>Cp.Asp1382Hisp.D1382HP11388protein_codingdeleterious(0.01)benign(0.146)TCGA-JW-A5VL-01Cervixcervical & endocervical cancerFemale<65I/IIUnknownUnknownSD
TOP2ASNVMissense_Mutationc.1794G>Tp.Trp598Cysp.W598CP11388protein_codingdeleterious(0)probably_damaging(0.995)TCGA-LP-A4AX-01Cervixcervical & endocervical cancerFemale<65I/IIUnknownUnknownSD
TOP2AinsertionFrame_Shift_Insnovelc.4236_4237insGTTTGTAATTTCAGTTTCATCTGGGAp.Asn1413ValfsTer11p.N1413Vfs*11P11388protein_codingTCGA-DS-A1OB-01Cervixcervical & endocervical cancerFemale<65I/IIChemotherapycarboplatinPD
Page: 1 2 3 4 5 6 7 8 9 10 11 

Top

Related drugs of malignant transformation related genes

check buttonIdentification of chemicals and drugs interact with genes involved in malignant transfromation
(DGIdb 4.0)
Entrez IDSymbolCategoryInteraction TypesDrug Claim NameDrug NamePMIDs
7153TOP2ADRUGGABLE GENOME, CLINICALLY ACTIONABLE, ENZYMEinhibitorCHEMBL1186894AMRUBICIN
7153TOP2ADRUGGABLE GENOME, CLINICALLY ACTIONABLE, ENZYMEEPIPODOPHYLLOTOXIN 4-(MORPHOLINE)CARBAMATECHEMBL177334321489802
7153TOP2ADRUGGABLE GENOME, CLINICALLY ACTIONABLE, ENZYMEDTS-201
7153TOP2ADRUGGABLE GENOME, CLINICALLY ACTIONABLE, ENZYMEDOXORUBICINDOXORUBICIN
7153TOP2ADRUGGABLE GENOME, CLINICALLY ACTIONABLE, ENZYMEANTHRACYCLINE14978790,15068318
7153TOP2ADRUGGABLE GENOME, CLINICALLY ACTIONABLE, ENZYMEBECATECARINBECATECARIN
7153TOP2ADRUGGABLE GENOME, CLINICALLY ACTIONABLE, ENZYMEVORELOXINVOSAROXIN
7153TOP2ADRUGGABLE GENOME, CLINICALLY ACTIONABLE, ENZYMEDOXORUBICINDOXORUBICIN
7153TOP2ADRUGGABLE GENOME, CLINICALLY ACTIONABLE, ENZYMEELLIPTECINEELLIPTECINE18816045,19783445
7153TOP2ADRUGGABLE GENOME, CLINICALLY ACTIONABLE, ENZYMEDOXORUBICINDOXORUBICIN
Page: 1 2 3 4 5 6 7 8 9 10 11 12