
|
|||||
|
 | |
| |
| |
| |
| |
| |
|
Gene: TOP1MT |
Gene summary for TOP1MT |
| Gene information | Species | Human | Gene symbol | TOP1MT | Gene ID | 116447 |
| Gene name | DNA topoisomerase I mitochondrial | |
| Gene Alias | TOP1MT | |
| Cytomap | 8q24.3 | |
| Gene Type | protein-coding | GO ID | GO:0006139 | UniProtAcc | Q969P6 |
Top |
Malignant transformation analysis |
| Identification of the aberrant gene expression in precancerous and cancerous lesions by comparing the gene expression of stem-like cells in diseased tissues with normal stem cells |
| Entrez ID | Symbol | Replicates | Species | Organ | Tissue | Adj P-value | Log2FC | Malignancy |
| 116447 | TOP1MT | HTA11_3410_2000001011 | Human | Colorectum | AD | 3.58e-04 | 1.62e-01 | 0.0155 |
| 116447 | TOP1MT | HTA11_2951_2000001011 | Human | Colorectum | AD | 3.54e-02 | 3.76e-01 | 0.0216 |
| 116447 | TOP1MT | HTA11_347_2000001011 | Human | Colorectum | AD | 2.23e-04 | 1.75e-01 | -0.1954 |
| 116447 | TOP1MT | HTA11_3361_2000001011 | Human | Colorectum | AD | 4.45e-02 | 1.92e-01 | -0.1207 |
| 116447 | TOP1MT | HTA11_1391_2000001011 | Human | Colorectum | AD | 1.57e-10 | 3.39e-01 | -0.059 |
| 116447 | TOP1MT | HTA11_546_2000001011 | Human | Colorectum | AD | 5.66e-03 | 2.53e-01 | -0.0842 |
| 116447 | TOP1MT | HTA11_866_3004761011 | Human | Colorectum | AD | 1.09e-12 | 3.69e-01 | 0.096 |
| 116447 | TOP1MT | HTA11_8622_2000001021 | Human | Colorectum | SER | 6.37e-03 | 2.62e-01 | 0.0528 |
| 116447 | TOP1MT | HTA11_7663_2000001011 | Human | Colorectum | SER | 1.52e-02 | 3.42e-01 | 0.0131 |
| 116447 | TOP1MT | HTA11_10711_2000001011 | Human | Colorectum | AD | 6.68e-08 | 3.64e-01 | 0.0338 |
| 116447 | TOP1MT | HTA11_7696_3000711011 | Human | Colorectum | AD | 7.58e-16 | 4.87e-01 | 0.0674 |
| 116447 | TOP1MT | HTA11_11156_2000001011 | Human | Colorectum | AD | 5.83e-03 | 4.69e-01 | 0.0397 |
| 116447 | TOP1MT | HTA11_6818_2000001021 | Human | Colorectum | AD | 2.63e-08 | 3.43e-01 | 0.0588 |
| 116447 | TOP1MT | HTA11_99999970781_79442 | Human | Colorectum | MSS | 1.47e-11 | 3.44e-01 | 0.294 |
| 116447 | TOP1MT | HTA11_99999965104_69814 | Human | Colorectum | MSS | 1.39e-03 | 2.75e-01 | 0.281 |
| 116447 | TOP1MT | HTA11_99999971662_82457 | Human | Colorectum | MSS | 1.16e-29 | 8.38e-01 | 0.3859 |
| 116447 | TOP1MT | HTA11_99999973899_84307 | Human | Colorectum | MSS | 6.94e-11 | 5.20e-01 | 0.2585 |
| 116447 | TOP1MT | HTA11_99999974143_84620 | Human | Colorectum | MSS | 3.36e-17 | 5.35e-01 | 0.3005 |
| 116447 | TOP1MT | LZE4T | Human | Esophagus | ESCC | 4.76e-11 | 3.15e-01 | 0.0811 |
| 116447 | TOP1MT | LZE8T | Human | Esophagus | ESCC | 9.71e-04 | 1.12e-01 | 0.067 |
| Page: 1 2 3 4 5 6 |
| Tissue | Expression Dynamics | Abbreviation |
| Colorectum (GSE201348) |  | FAP: Familial adenomatous polyposis |
| CRC: Colorectal cancer | ||
| Colorectum (HTA11) |  | AD: Adenomas |
| SER: Sessile serrated lesions | ||
| MSI-H: Microsatellite-high colorectal cancer | ||
| MSS: Microsatellite stable colorectal cancer | ||
| Esophagus |  | ESCC: Esophageal squamous cell carcinoma |
| HGIN: High-grade intraepithelial neoplasias | ||
| LGIN: Low-grade intraepithelial neoplasias | ||
| Liver | 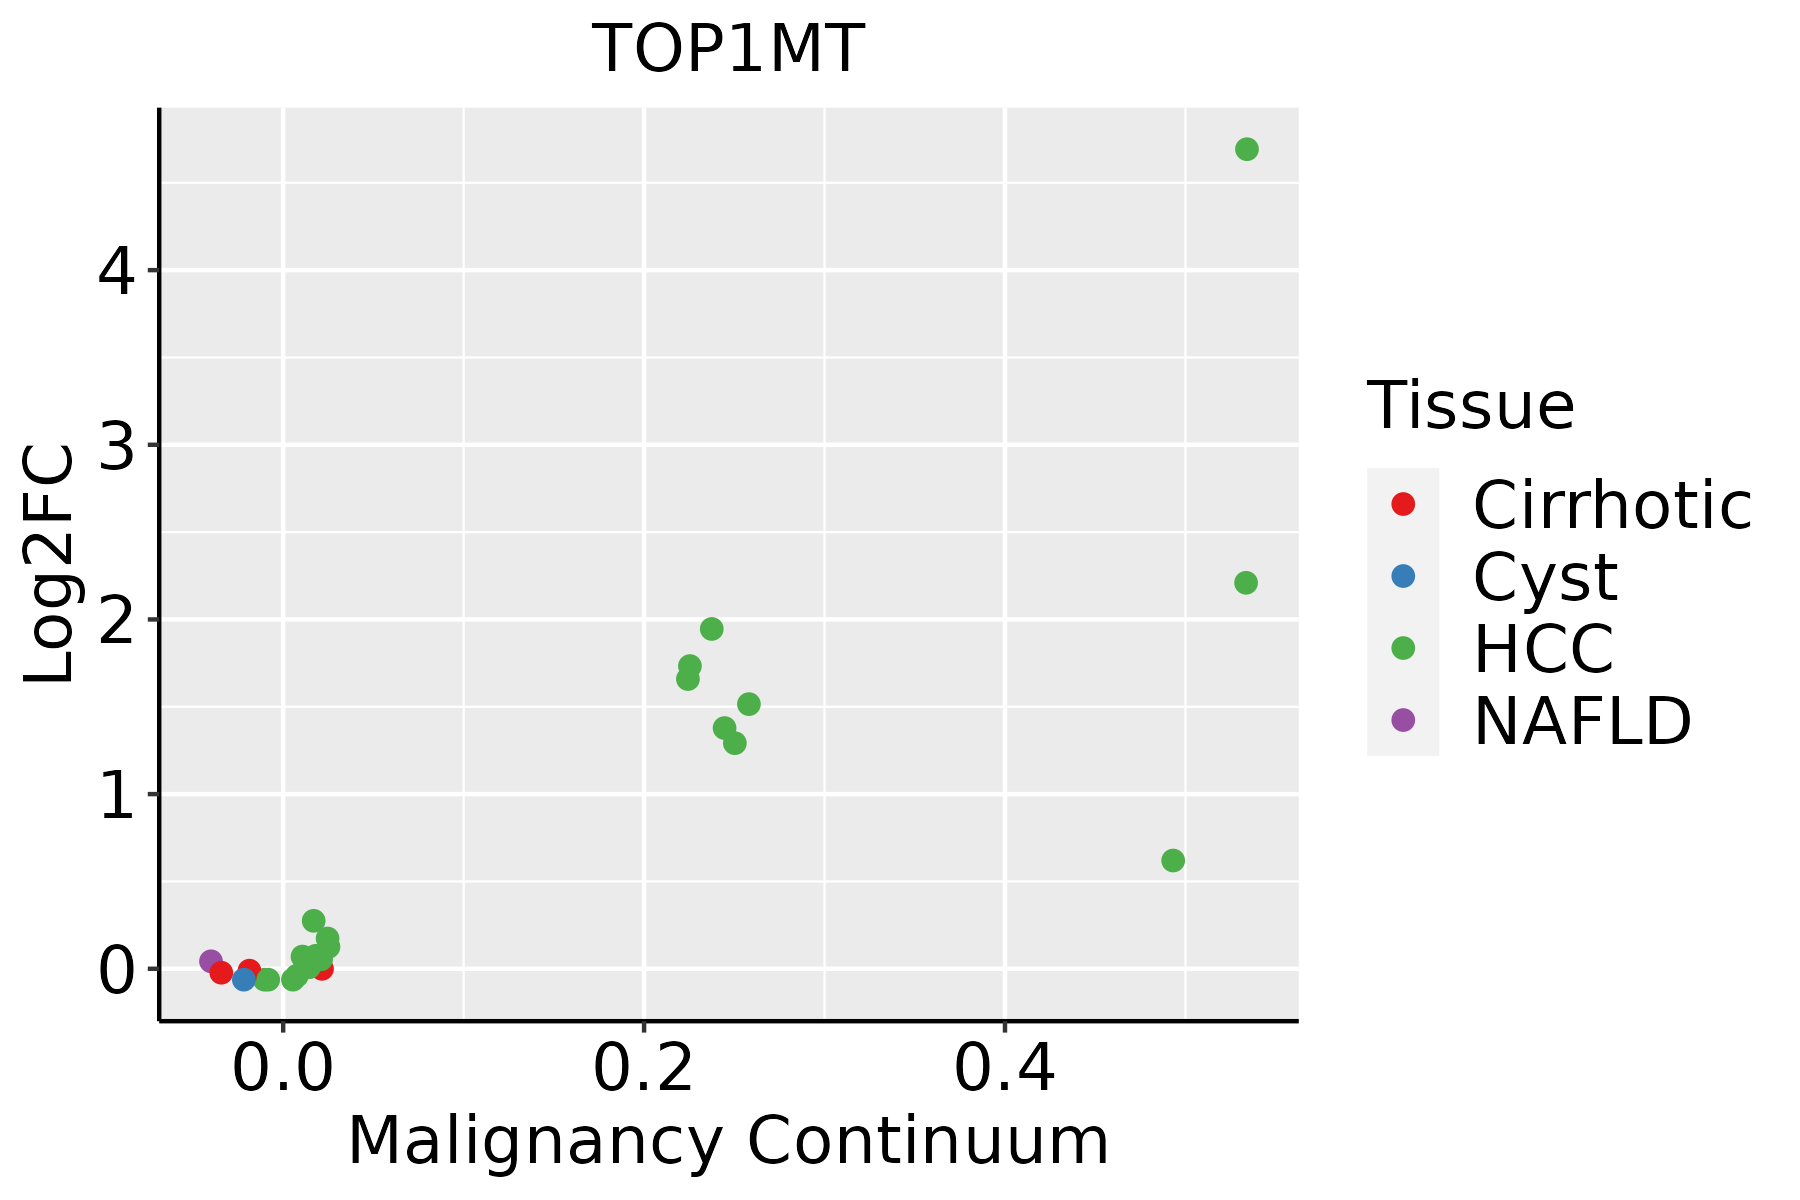 | HCC: Hepatocellular carcinoma |
| NAFLD: Non-alcoholic fatty liver disease | ||
| Oral Cavity | 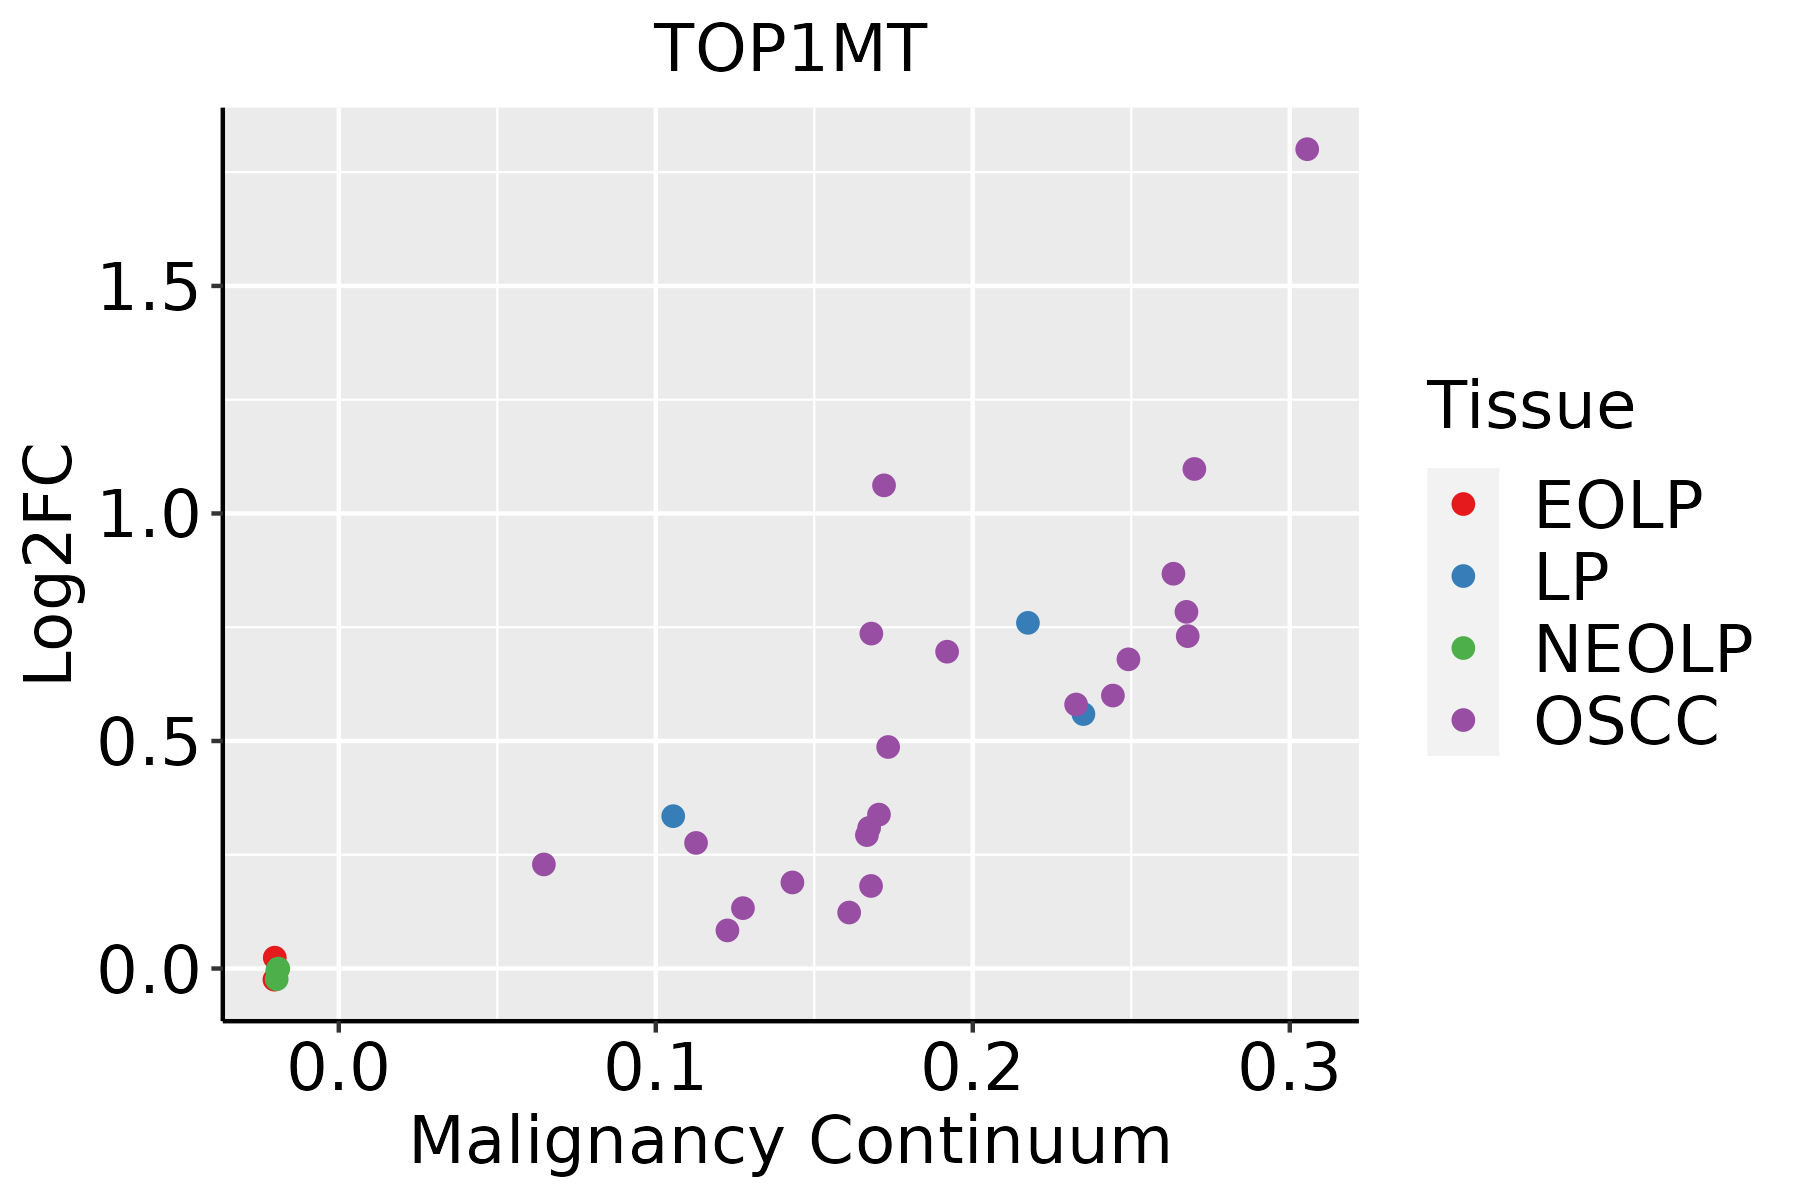 | EOLP: Erosive Oral lichen planus |
| LP: leukoplakia | ||
| NEOLP: Non-erosive oral lichen planus | ||
| OSCC: Oral squamous cell carcinoma | ||
| Skin | 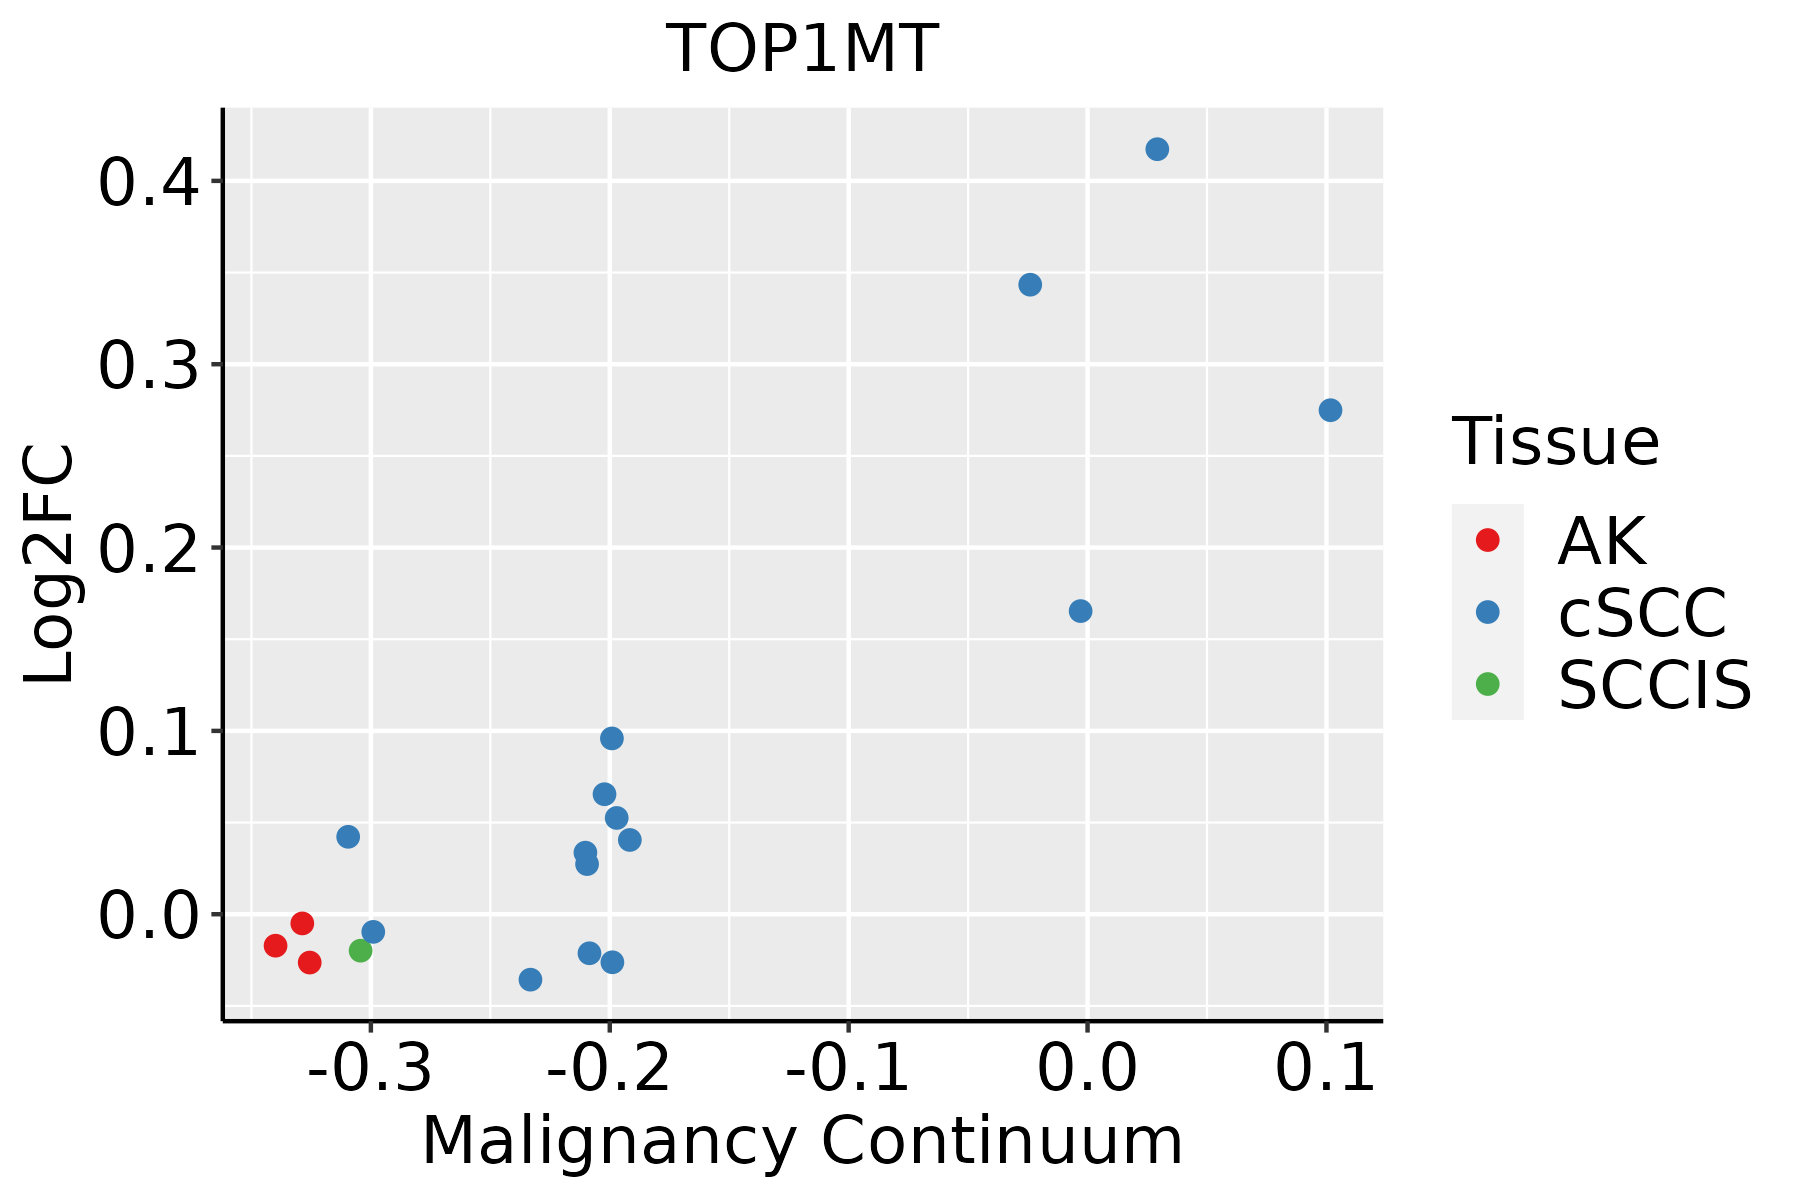 | AK: Actinic keratosis |
| cSCC: Cutaneous squamous cell carcinoma | ||
| SCCIS:squamous cell carcinoma in situ |
| ∗log2FC in expression of this searched gene in stem-like cells from each diseased tissue sample relative to stem-like cells in normal samples in each tissue plotted against the malignancy continuum. Samples are colored based on if they are from different disease stage. |
Top |
Malignant transformation related pathway analysis |
| Find out the enriched GO biological processes and KEGG pathways involved in transition from healthy to precancer to cancer |
| Tissue | Disease Stage | Enriched GO biological Processes |
| Colorectum | AD |  |
| Colorectum | SER |  |
| Colorectum | MSS |  |
| Colorectum | MSI-H |  |
| Colorectum | FAP |  |
| ∗Top 15 enriched GO BP terms are showed in the bar plot of each disease state in each tissue. Each row represents a significant GO biological process which is colored according to the -log10(p.adjust). |
| Page: 1 2 3 4 5 6 7 8 9 |
| GO ID | Tissue | Disease Stage | Description | Gene Ratio | Bg Ratio | pvalue | p.adjust | Count |
| GO:00062604 | Esophagus | ESCC | DNA replication | 181/8552 | 260/18723 | 3.55e-15 | 2.05e-13 | 181 |
| GO:00062601 | Liver | HCC | DNA replication | 146/7958 | 260/18723 | 5.68e-06 | 7.02e-05 | 146 |
| GO:00062603 | Oral cavity | OSCC | DNA replication | 159/7305 | 260/18723 | 3.25e-13 | 1.59e-11 | 159 |
| GO:000626011 | Oral cavity | LP | DNA replication | 97/4623 | 260/18723 | 3.67e-06 | 7.75e-05 | 97 |
| GO:000626012 | Skin | cSCC | DNA replication | 106/4864 | 260/18723 | 1.18e-07 | 2.77e-06 | 106 |
| GO:00711031 | Skin | cSCC | DNA conformation change | 96/4864 | 290/18723 | 3.87e-03 | 2.07e-02 | 96 |
| Page: 1 |
| Pathway ID | Tissue | Disease Stage | Description | Gene Ratio | Bg Ratio | pvalue | p.adjust | qvalue | Count |
| Page: 1 |
Top |
Cell-cell communication analysis |
| Identification of potential cell-cell interactions between two cell types and their ligand-receptor pairs for different disease states |
| Ligand | Receptor | LRpair | Pathway | Tissue | Disease Stage |
| Page: 1 |
Top |
Single-cell gene regulatory network inference analysis |
| Find out the significant the regulons (TFs) and the target genes of each regulon across cell types for different disease states |
| TF | Cell Type | Tissue | Disease Stage | Target Gene | RSS | Regulon Activity |
| ∗The dot plots of a searched regulon are shown for all cell subpopulations in each disease state of each tissue based on the regulon specific score inferred using pySCENIC and by calculating the average expression. |
| Page: 1 |
Top |
Somatic mutation of malignant transformation related genes |
| Annotation of somatic variants for genes involved in malignant transformation |
| Hugo Symbol | Variant Class | Variant Classification | dbSNP RS | HGVSc | HGVSp | HGVSp Short | SWISSPROT | BIOTYPE | SIFT | PolyPhen | Tumor Sample Barcode | Tissue | Histology | Sex | Age | Stage | Therapy Types | Drugs | Outcome |
| TOP1MT | SNV | Missense_Mutation | novel | c.1127N>C | p.Arg376Thr | p.R376T | Q969P6 | protein_coding | tolerated(0.54) | benign(0.216) | TCGA-C8-A8HP-01 | Breast | breast invasive carcinoma | Female | <65 | III/IV | Chemotherapy | 5-fluorouracil | CR |
| TOP1MT | SNV | Missense_Mutation | c.1213A>C | p.Thr405Pro | p.T405P | Q969P6 | protein_coding | deleterious(0) | possibly_damaging(0.53) | TCGA-D8-A1XW-01 | Breast | breast invasive carcinoma | Female | <65 | I/II | Chemotherapy | adriamycin+cyclophosphamide | SD | |
| TOP1MT | insertion | In_Frame_Ins | novel | c.1353_1354insGGCAAAACTCTCATGCTTTTATCATGGAATATGATGTTA | p.Lys451_Ile452insGlyLysThrLeuMetLeuLeuSerTrpAsnMetMetLeu | p.K451_I452insGKTLMLLSWNMML | Q969P6 | protein_coding | TCGA-B6-A0I5-01 | Breast | breast invasive carcinoma | Female | <65 | I/II | Unknown | Unknown | SD | ||
| TOP1MT | SNV | Missense_Mutation | rs764616681 | c.416N>T | p.Thr139Met | p.T139M | Q969P6 | protein_coding | deleterious(0.03) | possibly_damaging(0.893) | TCGA-ZJ-AB0H-01 | Cervix | cervical & endocervical cancer | Female | <65 | III/IV | Unknown | Unknown | SD |
| TOP1MT | SNV | Missense_Mutation | c.1390N>G | p.Ile464Val | p.I464V | Q969P6 | protein_coding | tolerated(0.18) | benign(0.009) | TCGA-AA-3710-01 | Colorectum | colon adenocarcinoma | Female | >=65 | I/II | Unknown | Unknown | SD | |
| TOP1MT | SNV | Missense_Mutation | c.524G>T | p.Gly175Val | p.G175V | Q969P6 | protein_coding | deleterious(0.04) | probably_damaging(1) | TCGA-AA-A010-01 | Colorectum | colon adenocarcinoma | Female | <65 | I/II | Chemotherapy | folinic | CR | |
| TOP1MT | SNV | Missense_Mutation | c.538G>C | p.Asp180His | p.D180H | Q969P6 | protein_coding | deleterious(0) | probably_damaging(1) | TCGA-AD-6895-01 | Colorectum | colon adenocarcinoma | Male | >=65 | III/IV | Unknown | Unknown | SD | |
| TOP1MT | SNV | Missense_Mutation | c.1003N>A | p.Ala335Thr | p.A335T | Q969P6 | protein_coding | deleterious(0) | probably_damaging(0.998) | TCGA-AD-A5EJ-01 | Colorectum | colon adenocarcinoma | Female | >=65 | I/II | Unknown | Unknown | SD | |
| TOP1MT | SNV | Missense_Mutation | c.122N>A | p.Arg41Lys | p.R41K | Q969P6 | protein_coding | tolerated(0.4) | benign(0.051) | TCGA-CA-6718-01 | Colorectum | colon adenocarcinoma | Male | <65 | I/II | Unknown | Unknown | PD | |
| TOP1MT | SNV | Missense_Mutation | c.692C>T | p.Pro231Leu | p.P231L | Q969P6 | protein_coding | deleterious(0.01) | probably_damaging(0.993) | TCGA-CK-6746-01 | Colorectum | colon adenocarcinoma | Female | >=65 | I/II | Unknown | Unknown | SD |
| Page: 1 2 3 4 5 6 7 |
Top |
Related drugs of malignant transformation related genes |
| Identification of chemicals and drugs interact with genes involved in malignant transfromation |
| (DGIdb 4.0) |
| Entrez ID | Symbol | Category | Interaction Types | Drug Claim Name | Drug Name | PMIDs |
| 116447 | TOP1MT | DRUGGABLE GENOME, ENZYME | TOPOTECAN | TOPOTECAN | ||
| 116447 | TOP1MT | DRUGGABLE GENOME, ENZYME | LE-SN38 | |||
| 116447 | TOP1MT | DRUGGABLE GENOME, ENZYME | PEG-SN38 | |||
| 116447 | TOP1MT | DRUGGABLE GENOME, ENZYME | inhibitor | CHEMBL1607 | TOPOTECAN HYDROCHLORIDE | |
| 116447 | TOP1MT | DRUGGABLE GENOME, ENZYME | IRINOTECAN | IRINOTECAN | ||
| 116447 | TOP1MT | DRUGGABLE GENOME, ENZYME | PEG-IRINOTECAN |
| Page: 1 |

Copyright 2023-Present -The University of Texas Health Science Center at Houston |