
|
|||||
|
 | |
| |
| |
| |
| |
| |
|
Gene: TOP1 |
Gene summary for TOP1 |
| Gene information | Species | Human | Gene symbol | TOP1 | Gene ID | 7150 |
| Gene name | DNA topoisomerase I | |
| Gene Alias | TOPI | |
| Cytomap | 20q12 | |
| Gene Type | protein-coding | GO ID | GO:0006139 | UniProtAcc | P11387 |
Top |
Malignant transformation analysis |
| Identification of the aberrant gene expression in precancerous and cancerous lesions by comparing the gene expression of stem-like cells in diseased tissues with normal stem cells |
| Entrez ID | Symbol | Replicates | Species | Organ | Tissue | Adj P-value | Log2FC | Malignancy |
| 7150 | TOP1 | HTA11_3410_2000001011 | Human | Colorectum | AD | 5.84e-03 | -2.43e-01 | 0.0155 |
| 7150 | TOP1 | HTA11_347_2000001011 | Human | Colorectum | AD | 1.17e-06 | 5.06e-01 | -0.1954 |
| 7150 | TOP1 | HTA11_99999965104_69814 | Human | Colorectum | MSS | 9.61e-04 | 6.45e-01 | 0.281 |
| 7150 | TOP1 | HTA11_99999971662_82457 | Human | Colorectum | MSS | 3.56e-12 | 1.06e+00 | 0.3859 |
| 7150 | TOP1 | A015-C-203 | Human | Colorectum | FAP | 3.05e-23 | -3.21e-01 | -0.1294 |
| 7150 | TOP1 | A015-C-204 | Human | Colorectum | FAP | 1.28e-06 | -3.75e-01 | -0.0228 |
| 7150 | TOP1 | A014-C-040 | Human | Colorectum | FAP | 4.98e-03 | -2.86e-01 | -0.1184 |
| 7150 | TOP1 | A002-C-201 | Human | Colorectum | FAP | 2.34e-11 | -2.52e-01 | 0.0324 |
| 7150 | TOP1 | A002-C-203 | Human | Colorectum | FAP | 1.06e-02 | -1.30e-01 | 0.2786 |
| 7150 | TOP1 | A001-C-119 | Human | Colorectum | FAP | 2.02e-05 | -2.74e-01 | -0.1557 |
| 7150 | TOP1 | A001-C-108 | Human | Colorectum | FAP | 3.88e-12 | -1.29e-01 | -0.0272 |
| 7150 | TOP1 | A002-C-205 | Human | Colorectum | FAP | 2.12e-19 | -3.33e-01 | -0.1236 |
| 7150 | TOP1 | A015-C-006 | Human | Colorectum | FAP | 2.14e-12 | -2.67e-01 | -0.0994 |
| 7150 | TOP1 | A015-C-106 | Human | Colorectum | FAP | 1.91e-07 | -1.80e-01 | -0.0511 |
| 7150 | TOP1 | A002-C-114 | Human | Colorectum | FAP | 2.54e-14 | -3.04e-01 | -0.1561 |
| 7150 | TOP1 | A015-C-104 | Human | Colorectum | FAP | 1.08e-25 | -3.62e-01 | -0.1899 |
| 7150 | TOP1 | A001-C-014 | Human | Colorectum | FAP | 6.29e-14 | -2.41e-01 | 0.0135 |
| 7150 | TOP1 | A002-C-016 | Human | Colorectum | FAP | 8.62e-19 | -1.91e-01 | 0.0521 |
| 7150 | TOP1 | A015-C-002 | Human | Colorectum | FAP | 6.62e-10 | -3.19e-01 | -0.0763 |
| 7150 | TOP1 | A001-C-203 | Human | Colorectum | FAP | 2.80e-06 | -1.09e-01 | -0.0481 |
| Page: 1 2 3 4 5 6 7 8 9 10 11 12 13 |
| Tissue | Expression Dynamics | Abbreviation |
| Colorectum (GSE201348) |  | FAP: Familial adenomatous polyposis |
| CRC: Colorectal cancer | ||
| Colorectum (HTA11) |  | AD: Adenomas |
| SER: Sessile serrated lesions | ||
| MSI-H: Microsatellite-high colorectal cancer | ||
| MSS: Microsatellite stable colorectal cancer | ||
| Endometrium | 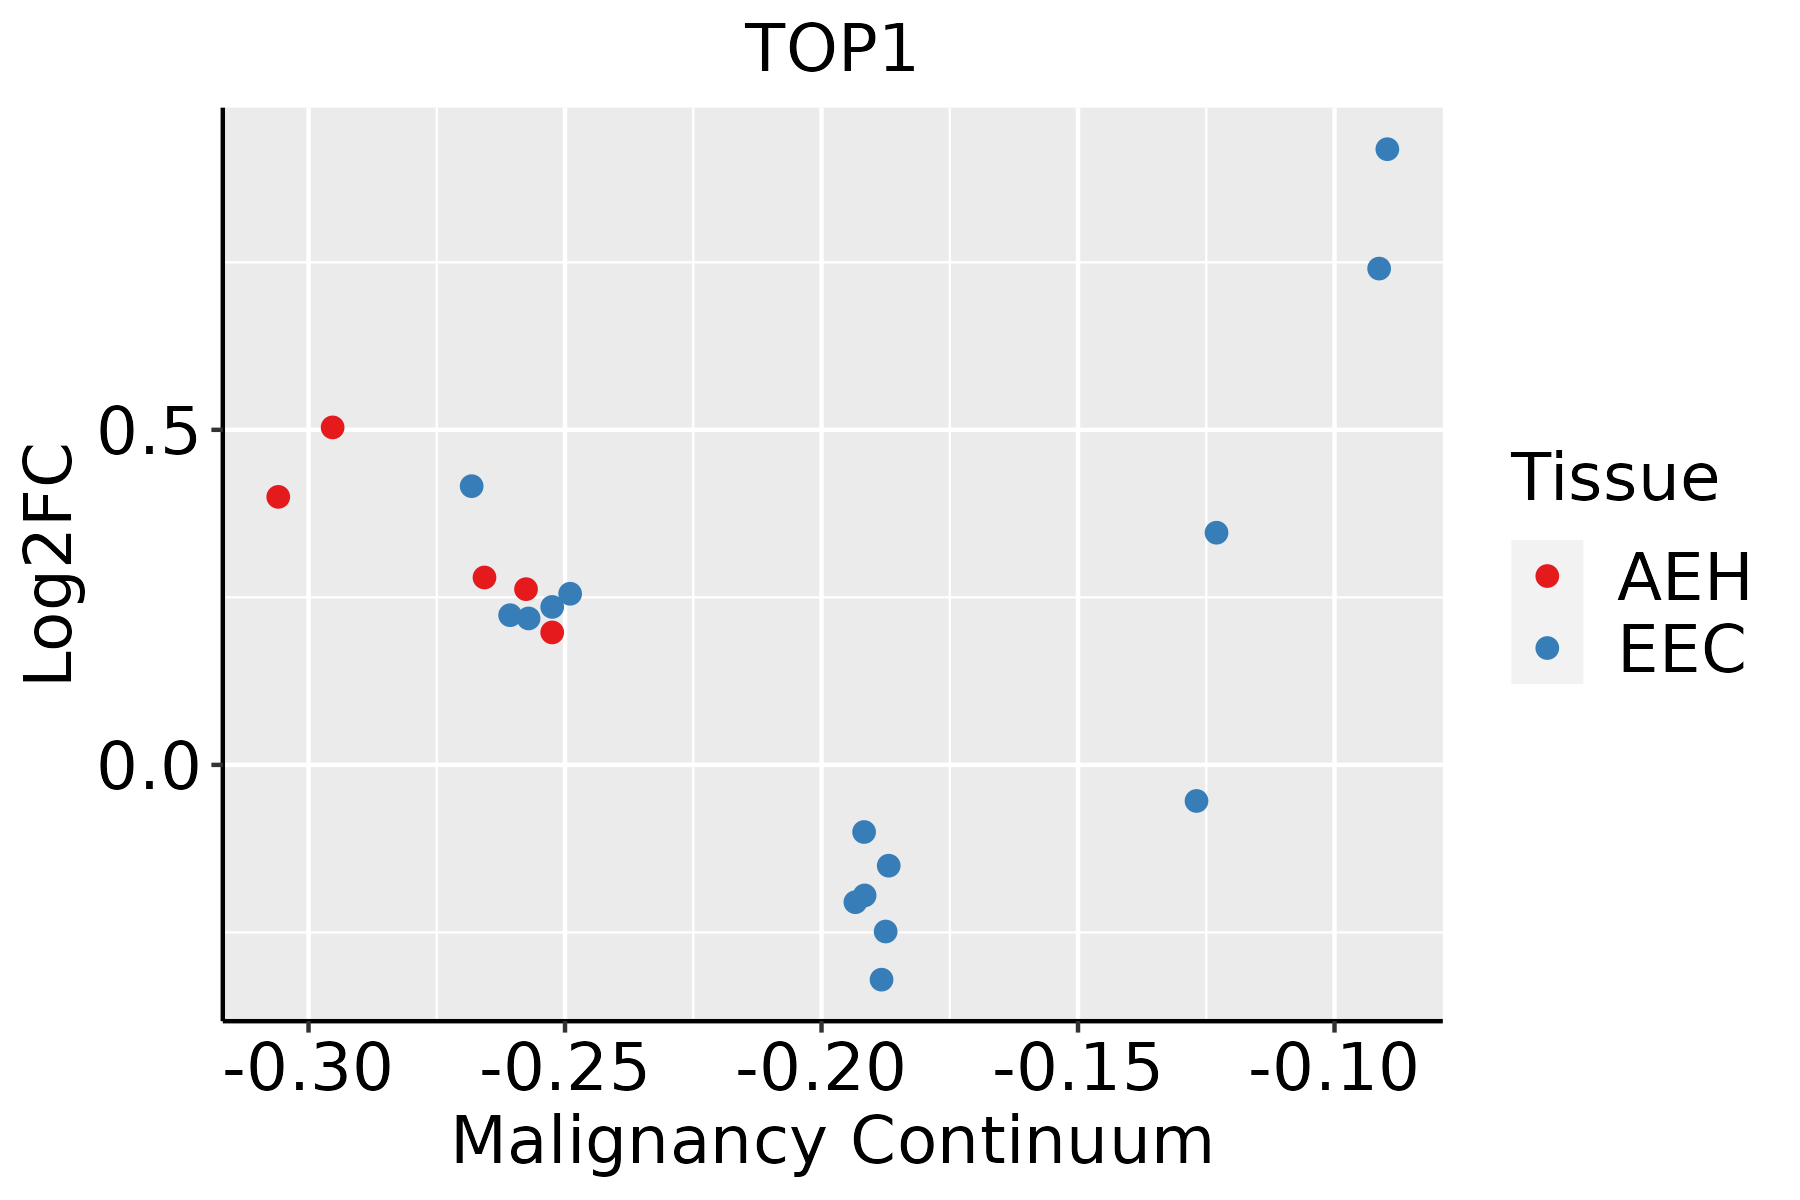 | AEH: Atypical endometrial hyperplasia |
| EEC: Endometrioid Cancer | ||
| Esophagus |  | ESCC: Esophageal squamous cell carcinoma |
| HGIN: High-grade intraepithelial neoplasias | ||
| LGIN: Low-grade intraepithelial neoplasias | ||
| GC |  | CAG: Chronic atrophic gastritis |
| CAG with IM: Chronic atrophic gastritis with intestinal metaplasia | ||
| CSG: Chronic superficial gastritis | ||
| GC: Gastric cancer | ||
| SIM: Severe intestinal metaplasia | ||
| WIM: Wild intestinal metaplasia | ||
| Liver | 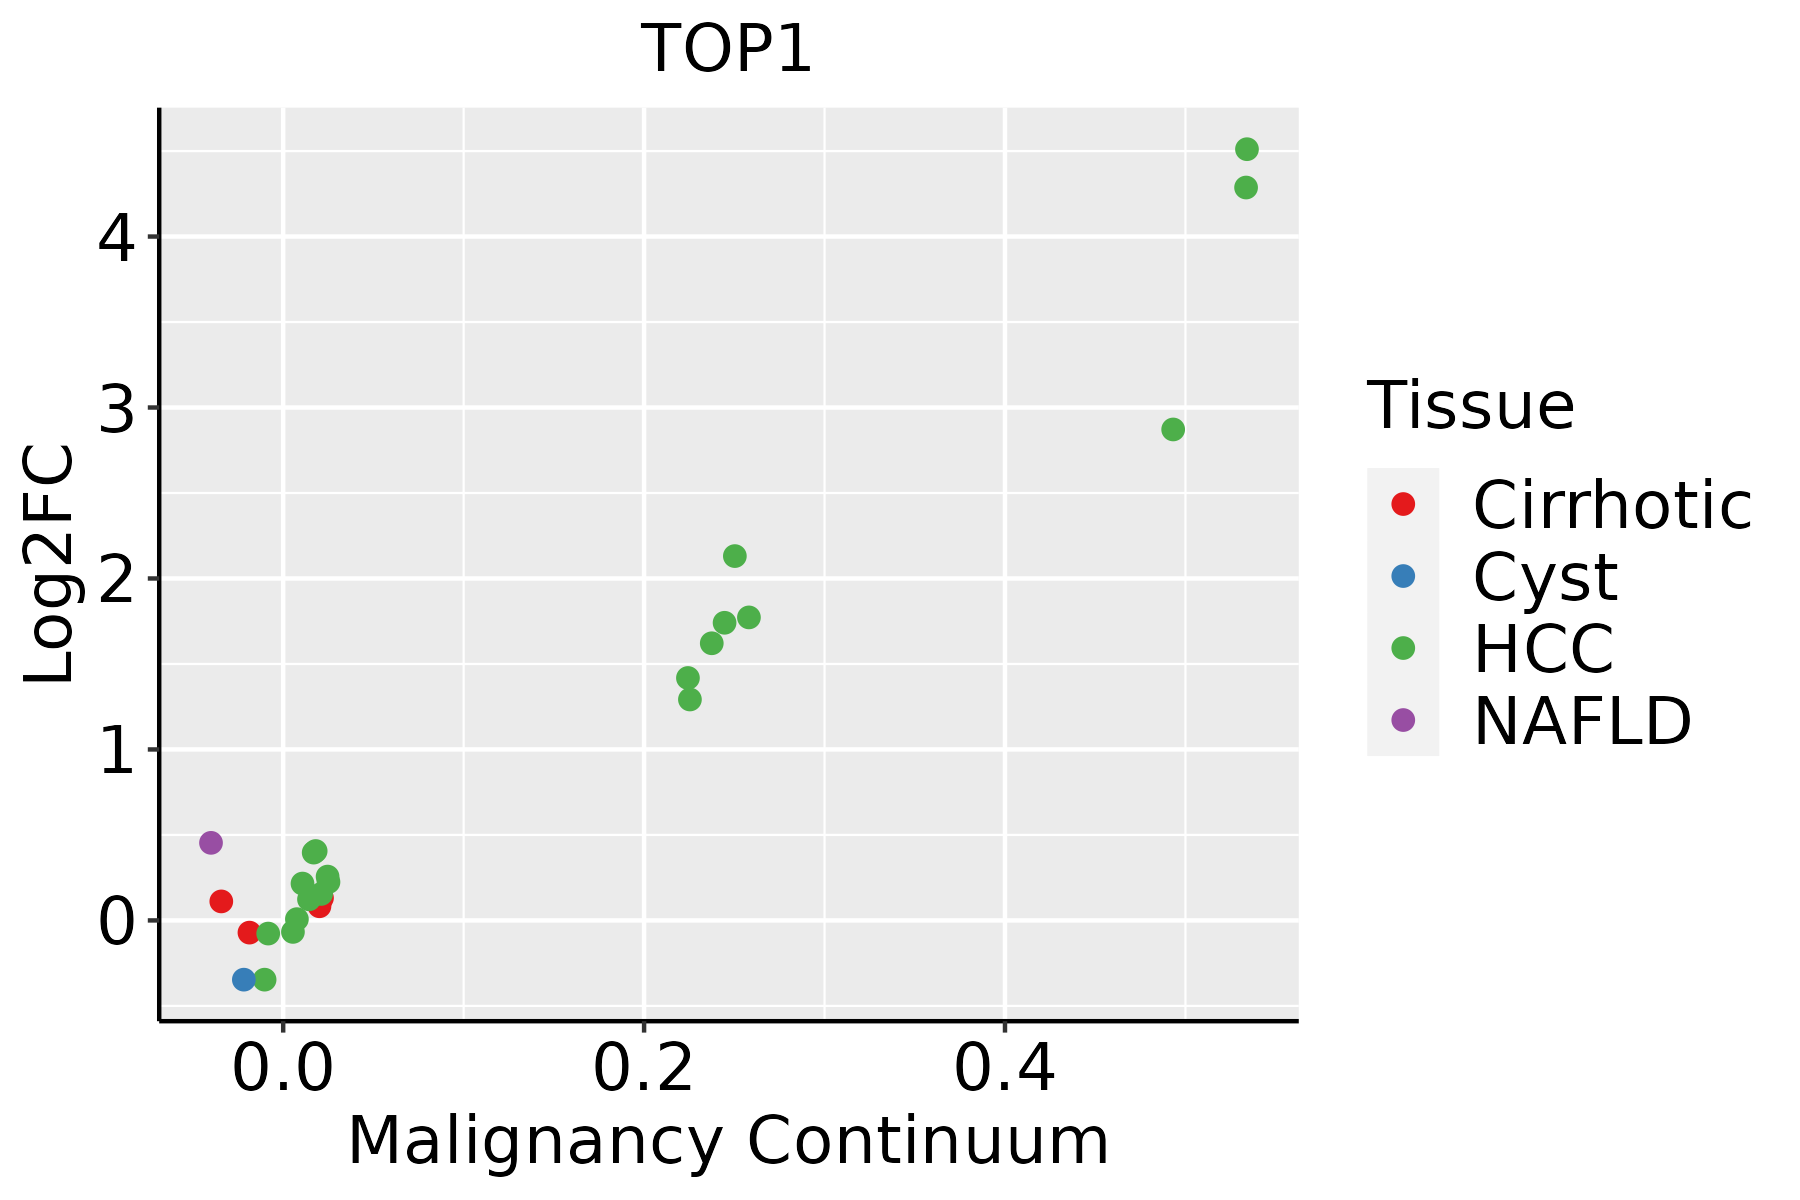 | HCC: Hepatocellular carcinoma |
| NAFLD: Non-alcoholic fatty liver disease | ||
| Lung | 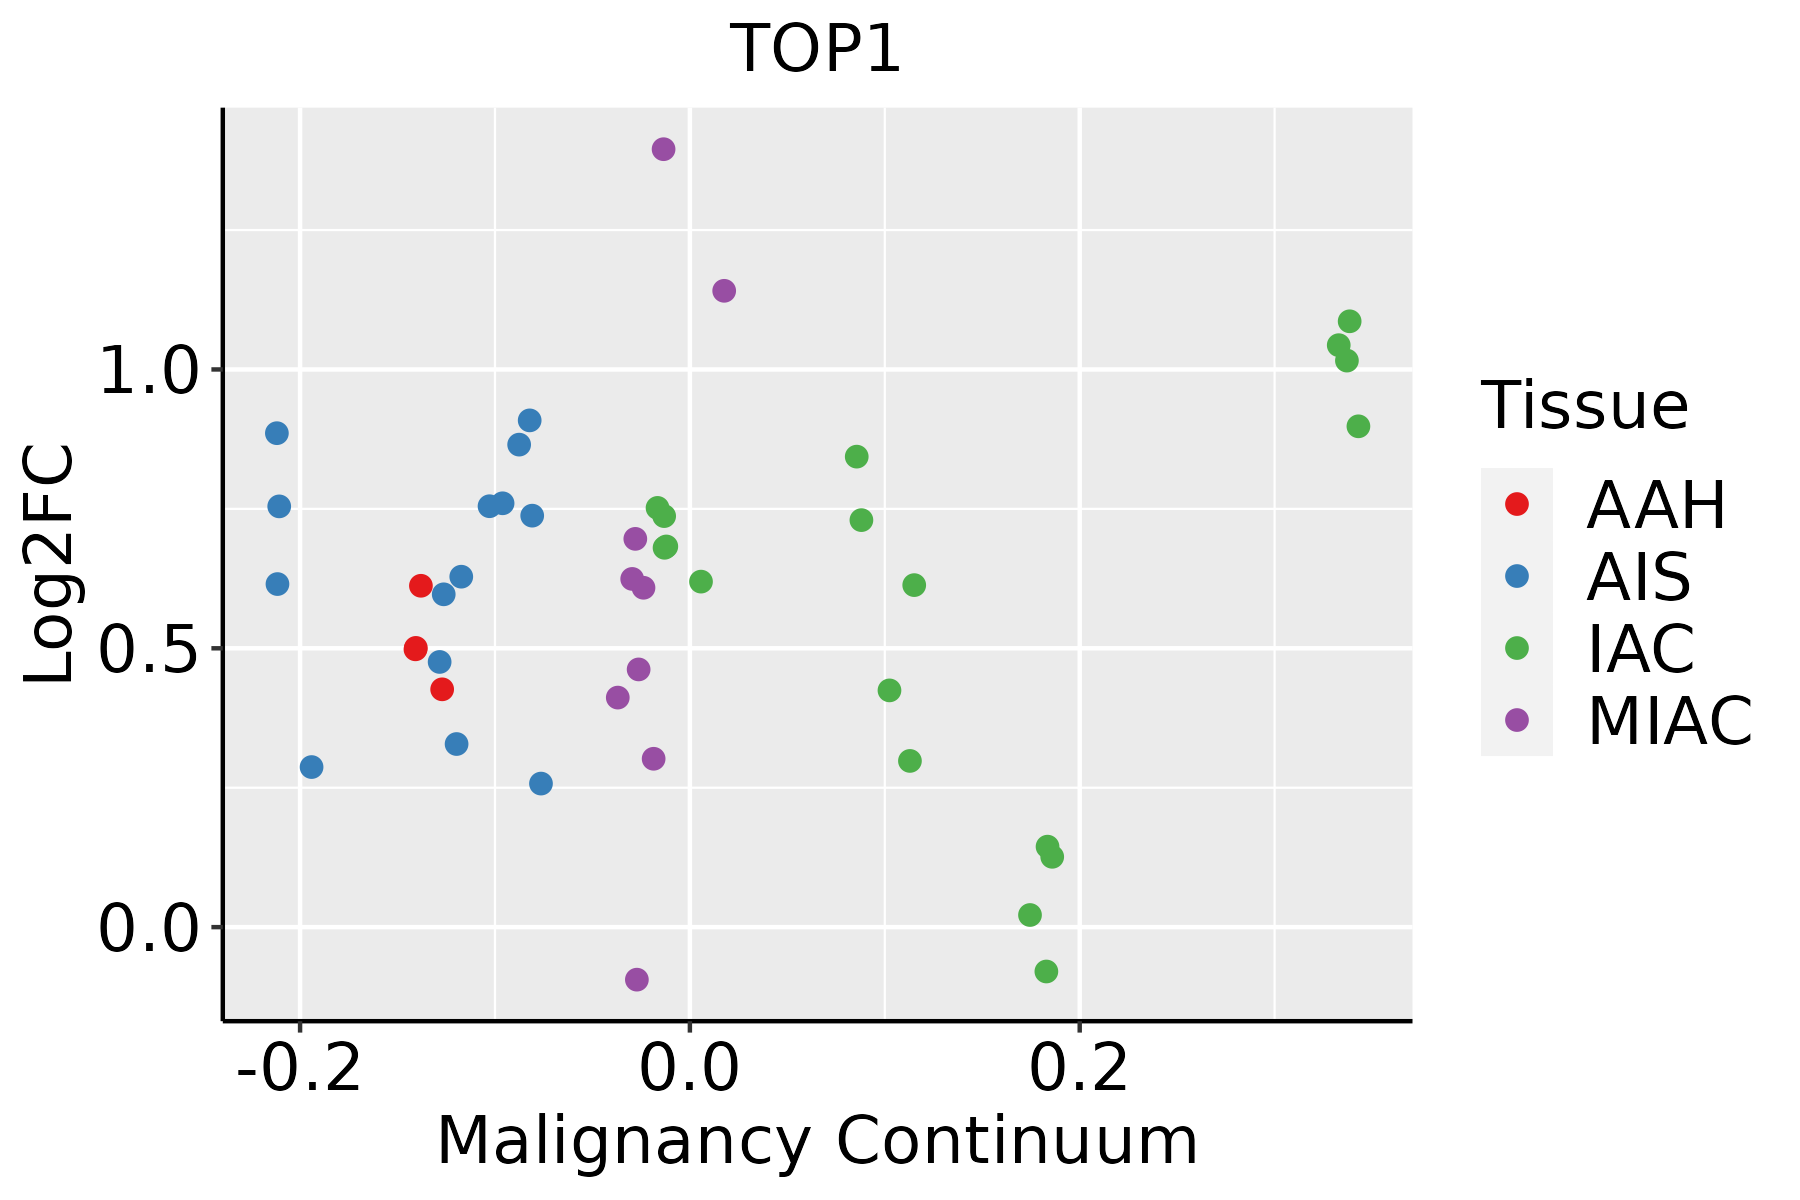 | AAH: Atypical adenomatous hyperplasia |
| AIS: Adenocarcinoma in situ | ||
| IAC: Invasive lung adenocarcinoma | ||
| MIA: Minimally invasive adenocarcinoma | ||
| Oral Cavity |  | EOLP: Erosive Oral lichen planus |
| LP: leukoplakia | ||
| NEOLP: Non-erosive oral lichen planus | ||
| OSCC: Oral squamous cell carcinoma | ||
| Prostate | 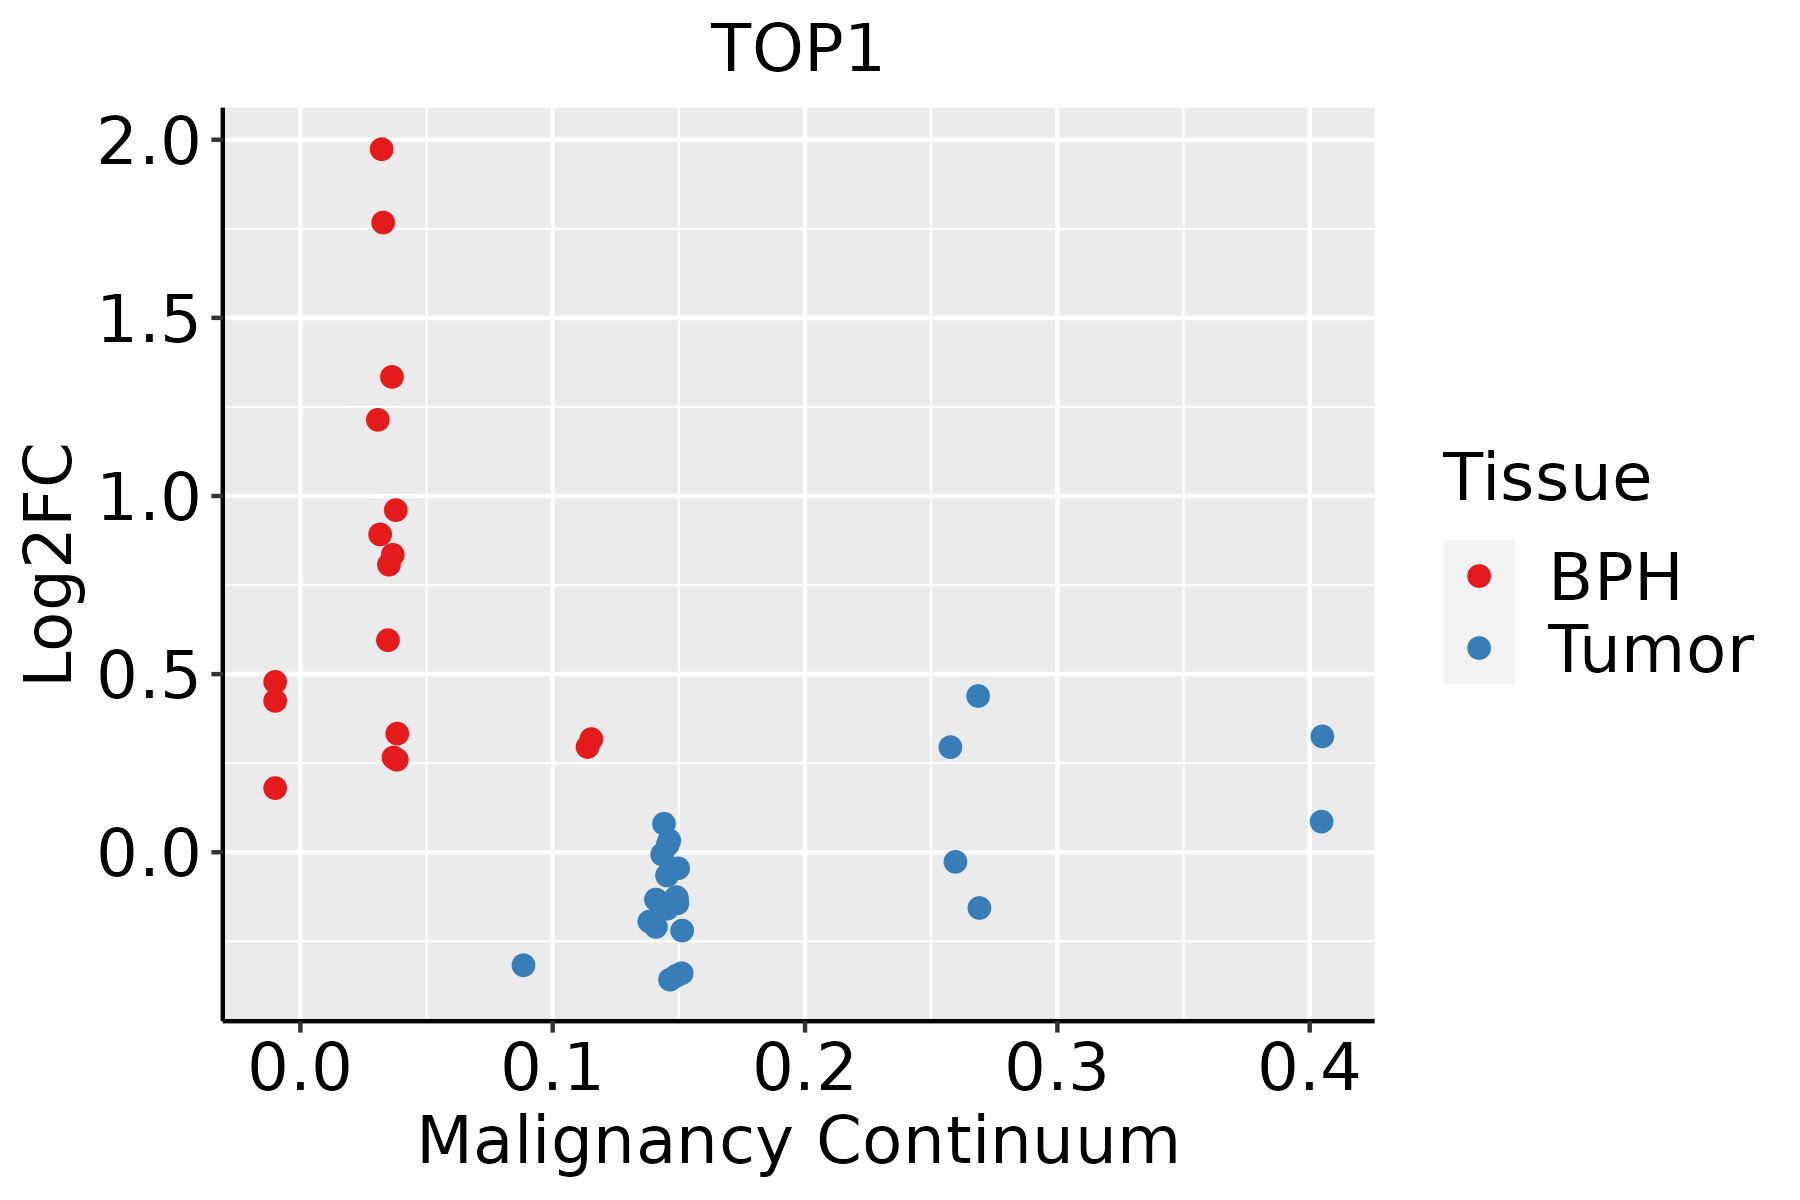 | BPH: Benign Prostatic Hyperplasia |
| Skin | 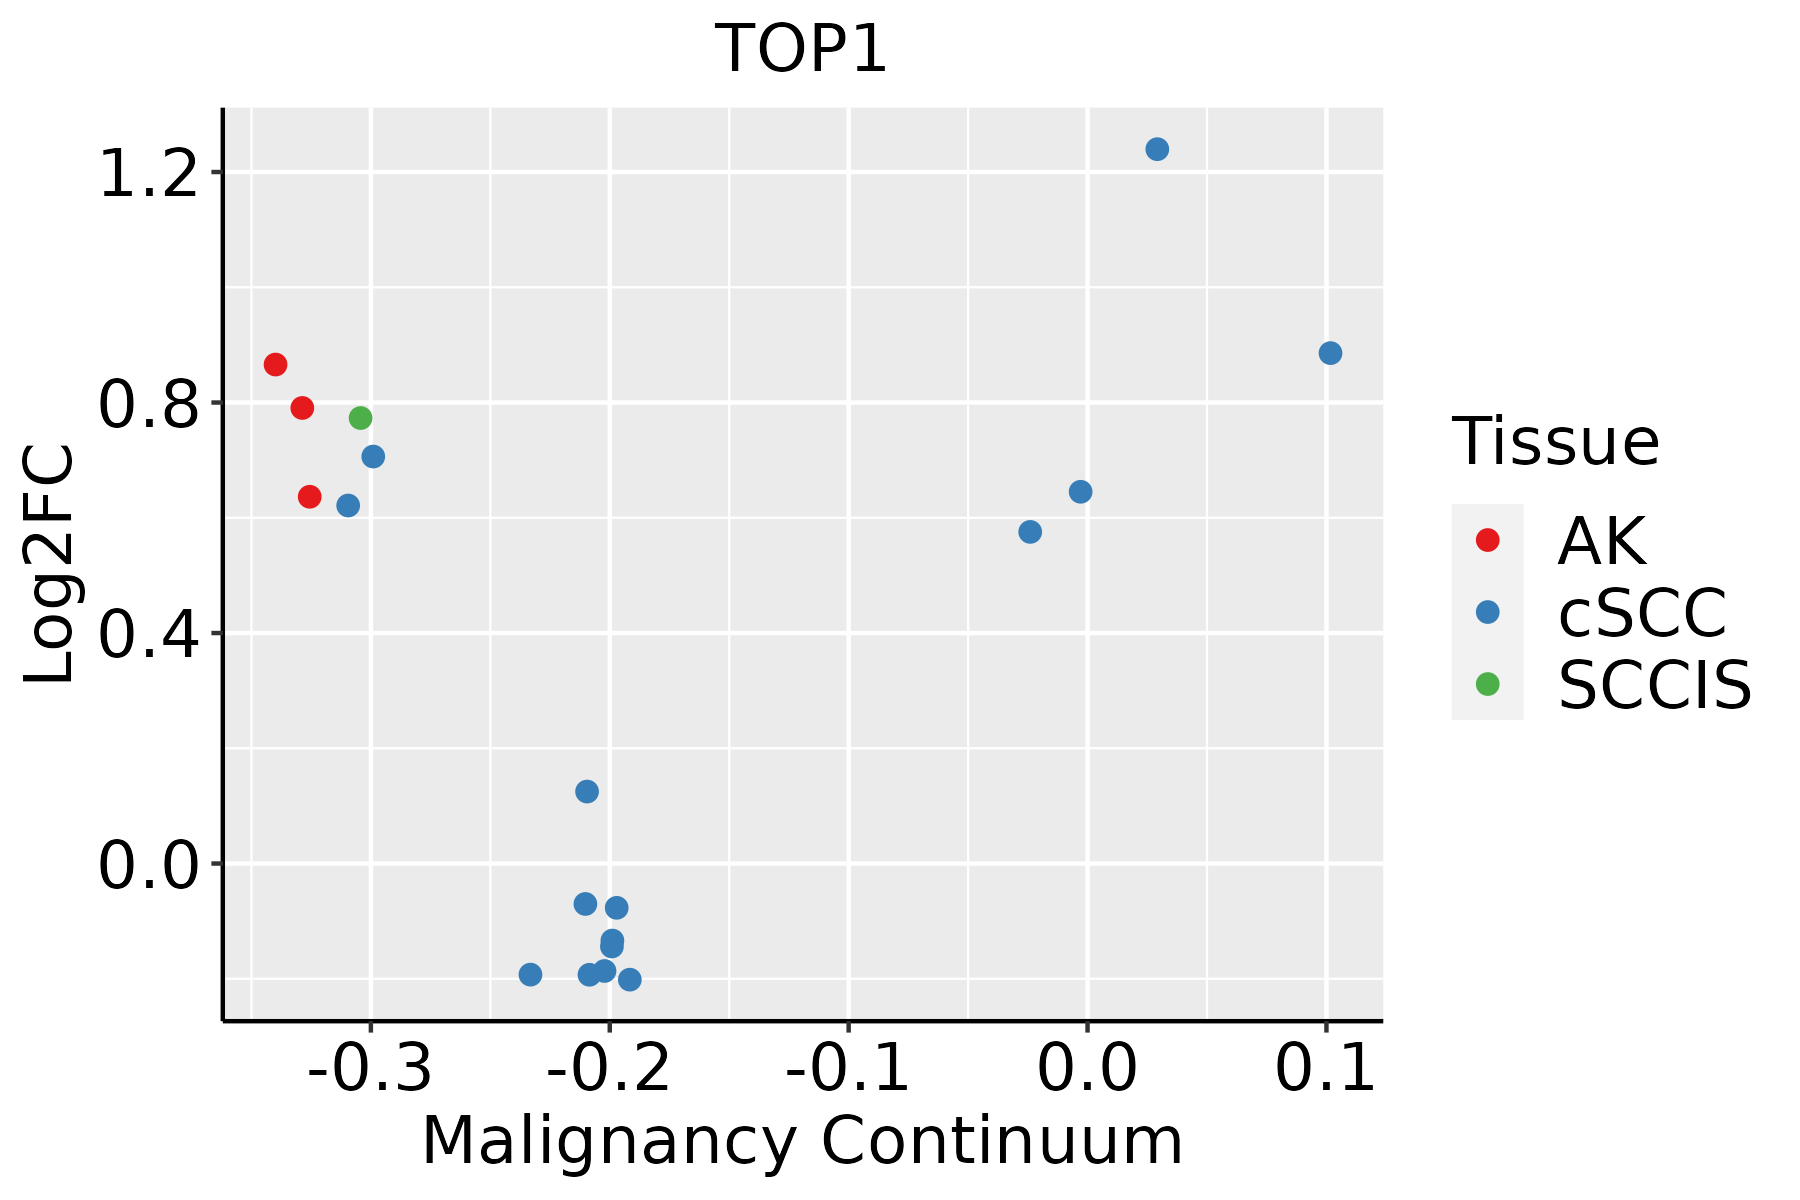 | AK: Actinic keratosis |
| cSCC: Cutaneous squamous cell carcinoma | ||
| SCCIS:squamous cell carcinoma in situ | ||
| Thyroid | 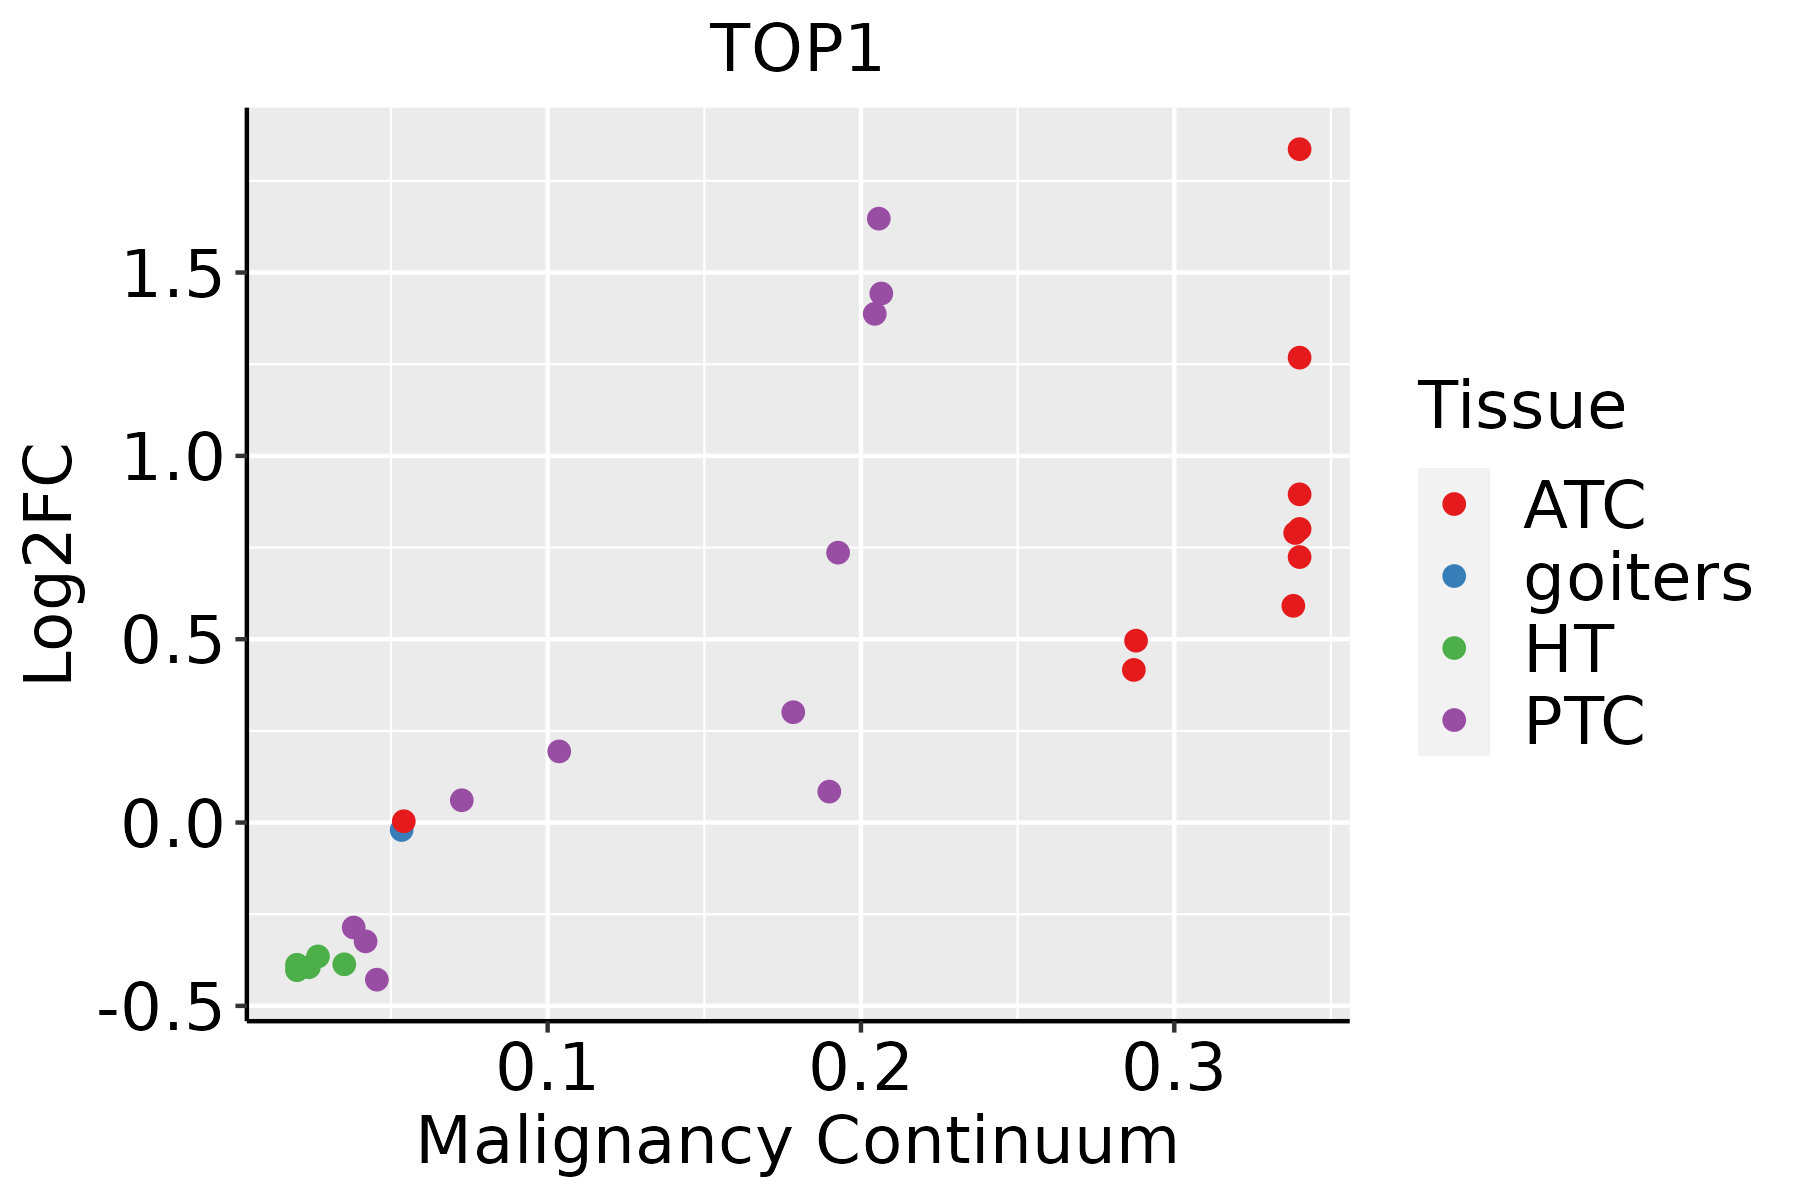 | ATC: Anaplastic thyroid cancer |
| HT: Hashimoto's thyroiditis | ||
| PTC: Papillary thyroid cancer |
| ∗log2FC in expression of this searched gene in stem-like cells from each diseased tissue sample relative to stem-like cells in normal samples in each tissue plotted against the malignancy continuum. Samples are colored based on if they are from different disease stage. |
Top |
Malignant transformation related pathway analysis |
| Find out the enriched GO biological processes and KEGG pathways involved in transition from healthy to precancer to cancer |
| Tissue | Disease Stage | Enriched GO biological Processes |
| Colorectum | AD |  |
| Colorectum | SER |  |
| Colorectum | MSS |  |
| Colorectum | MSI-H |  |
| Colorectum | FAP |  |
| ∗Top 15 enriched GO BP terms are showed in the bar plot of each disease state in each tissue. Each row represents a significant GO biological process which is colored according to the -log10(p.adjust). |
| Page: 1 2 3 4 5 6 7 8 9 |
| GO ID | Tissue | Disease Stage | Description | Gene Ratio | Bg Ratio | pvalue | p.adjust | Count |
| GO:0007623 | Colorectum | AD | circadian rhythm | 72/3918 | 210/18723 | 4.50e-06 | 1.21e-04 | 72 |
| GO:0048511 | Colorectum | AD | rhythmic process | 94/3918 | 298/18723 | 1.00e-05 | 2.34e-04 | 94 |
| GO:0006325 | Colorectum | AD | chromatin organization | 119/3918 | 409/18723 | 4.85e-05 | 8.33e-04 | 119 |
| GO:0018105 | Colorectum | AD | peptidyl-serine phosphorylation | 88/3918 | 315/18723 | 1.73e-03 | 1.43e-02 | 88 |
| GO:0018209 | Colorectum | AD | peptidyl-serine modification | 92/3918 | 338/18723 | 3.19e-03 | 2.36e-02 | 92 |
| GO:0006338 | Colorectum | AD | chromatin remodeling | 70/3918 | 255/18723 | 7.44e-03 | 4.53e-02 | 70 |
| GO:00076232 | Colorectum | MSS | circadian rhythm | 69/3467 | 210/18723 | 4.22e-07 | 1.67e-05 | 69 |
| GO:00485112 | Colorectum | MSS | rhythmic process | 89/3467 | 298/18723 | 1.17e-06 | 3.96e-05 | 89 |
| GO:00063252 | Colorectum | MSS | chromatin organization | 107/3467 | 409/18723 | 7.22e-05 | 1.21e-03 | 107 |
| GO:00181052 | Colorectum | MSS | peptidyl-serine phosphorylation | 81/3467 | 315/18723 | 8.92e-04 | 9.12e-03 | 81 |
| GO:00182091 | Colorectum | MSS | peptidyl-serine modification | 84/3467 | 338/18723 | 2.12e-03 | 1.79e-02 | 84 |
| GO:00076233 | Colorectum | FAP | circadian rhythm | 56/2622 | 210/18723 | 9.12e-07 | 4.14e-05 | 56 |
| GO:00485113 | Colorectum | FAP | rhythmic process | 72/2622 | 298/18723 | 1.67e-06 | 6.99e-05 | 72 |
| GO:00181053 | Colorectum | FAP | peptidyl-serine phosphorylation | 71/2622 | 315/18723 | 2.51e-05 | 5.82e-04 | 71 |
| GO:00182092 | Colorectum | FAP | peptidyl-serine modification | 73/2622 | 338/18723 | 8.47e-05 | 1.51e-03 | 73 |
| GO:00063253 | Colorectum | FAP | chromatin organization | 84/2622 | 409/18723 | 1.62e-04 | 2.47e-03 | 84 |
| GO:0032922 | Colorectum | FAP | circadian regulation of gene expression | 18/2622 | 68/18723 | 4.83e-03 | 3.25e-02 | 18 |
| GO:00485114 | Colorectum | CRC | rhythmic process | 64/2078 | 298/18723 | 1.43e-07 | 1.62e-05 | 64 |
| GO:00076234 | Colorectum | CRC | circadian rhythm | 47/2078 | 210/18723 | 1.89e-06 | 9.29e-05 | 47 |
| GO:00181054 | Colorectum | CRC | peptidyl-serine phosphorylation | 61/2078 | 315/18723 | 9.88e-06 | 3.31e-04 | 61 |
| Page: 1 2 3 4 5 6 7 8 |
| Pathway ID | Tissue | Disease Stage | Description | Gene Ratio | Bg Ratio | pvalue | p.adjust | qvalue | Count |
| Page: 1 |
Top |
Cell-cell communication analysis |
| Identification of potential cell-cell interactions between two cell types and their ligand-receptor pairs for different disease states |
| Ligand | Receptor | LRpair | Pathway | Tissue | Disease Stage |
| Page: 1 |
Top |
Single-cell gene regulatory network inference analysis |
| Find out the significant the regulons (TFs) and the target genes of each regulon across cell types for different disease states |
| TF | Cell Type | Tissue | Disease Stage | Target Gene | RSS | Regulon Activity |
| ∗The dot plots of a searched regulon are shown for all cell subpopulations in each disease state of each tissue based on the regulon specific score inferred using pySCENIC and by calculating the average expression. |
| Page: 1 |
Top |
Somatic mutation of malignant transformation related genes |
| Annotation of somatic variants for genes involved in malignant transformation |
| Hugo Symbol | Variant Class | Variant Classification | dbSNP RS | HGVSc | HGVSp | HGVSp Short | SWISSPROT | BIOTYPE | SIFT | PolyPhen | Tumor Sample Barcode | Tissue | Histology | Sex | Age | Stage | Therapy Types | Drugs | Outcome |
| TOP1 | SNV | Missense_Mutation | novel | c.62N>G | p.Ser21Cys | p.S21C | P11387 | protein_coding | deleterious_low_confidence(0) | possibly_damaging(0.615) | TCGA-5L-AAT1-01 | Breast | breast invasive carcinoma | Female | <65 | III/IV | Hormone Therapy | letrozol | SD |
| TOP1 | SNV | Missense_Mutation | c.2123G>A | p.Arg708Gln | p.R708Q | P11387 | protein_coding | deleterious(0) | possibly_damaging(0.538) | TCGA-AC-A5XS-01 | Breast | breast invasive carcinoma | Female | >=65 | I/II | Hormone Therapy | femara | SD | |
| TOP1 | SNV | Missense_Mutation | c.1700N>C | p.Arg567Thr | p.R567T | P11387 | protein_coding | deleterious(0) | probably_damaging(0.982) | TCGA-D8-A27G-01 | Breast | breast invasive carcinoma | Female | >=65 | I/II | Unknown | Unknown | SD | |
| TOP1 | insertion | Nonsense_Mutation | novel | c.2003_2004insAAGTAGCCCTTAG | p.Lys669SerfsTer4 | p.K669Sfs*4 | P11387 | protein_coding | TCGA-A2-A0CP-01 | Breast | breast invasive carcinoma | Female | <65 | I/II | Chemotherapy | cytoxan | SD | ||
| TOP1 | insertion | In_Frame_Ins | novel | c.398_399insGGGGTTTACTACTCTAGCAGGAACTTTGAATTTCCTATATAC | p.Ile133delinsMetGlyPheThrThrLeuAlaGlyThrLeuAsnPheLeuTyrThr | p.I133delinsMGFTTLAGTLNFLYT | P11387 | protein_coding | TCGA-A2-A0CQ-01 | Breast | breast invasive carcinoma | Female | <65 | I/II | Chemotherapy | adriamycin | SD | ||
| TOP1 | insertion | In_Frame_Ins | novel | c.2288_2289insTTACACTTCAACAAAACTTTTCGT | p.Tyr763_Glu764insTyrThrSerThrLysLeuPheVal | p.Y763_E764insYTSTKLFV | P11387 | protein_coding | TCGA-A8-A0A1-01 | Breast | breast invasive carcinoma | Female | >=65 | I/II | Hormone Therapy | tamoxiphen | SD | ||
| TOP1 | insertion | Nonsense_Mutation | novel | c.155_155+1insATGTTTTTAAATGAATGTTAATAAGGT | p.Ser52delinsArgCysPheTerMetAsnValAsnLysVal | p.S52delinsRCF*MNVNKV | P11387 | protein_coding | TCGA-AO-A03P-01 | Breast | breast invasive carcinoma | Female | <65 | I/II | Hormone Therapy | letrozole | PD | ||
| TOP1 | insertion | Nonsense_Mutation | novel | c.1624_1625insTGTGAGCAGTAGATTCTGATCTTTTTTTAACTCTATTTCATT | p.Pro542delinsLeuTerAlaValAspSerAspLeuPheLeuThrLeuPheHisSer | p.P542delinsL*AVDSDLFLTLFHS | P11387 | protein_coding | TCGA-AO-A0JB-01 | Breast | breast invasive carcinoma | Female | <65 | III/IV | Chemotherapy | cyclophosphamide | SD | ||
| TOP1 | insertion | Frame_Shift_Ins | novel | c.749_750insAGCAGTTTCCTTTTCCTGGAGCTCAGCCTTTT | p.Ser250ArgfsTer18 | p.S250Rfs*18 | P11387 | protein_coding | TCGA-B6-A0IE-01 | Breast | breast invasive carcinoma | Female | <65 | III/IV | Unknown | Unknown | PD | ||
| TOP1 | insertion | Nonsense_Mutation | novel | c.803_804insAGGGTAGCCTTTGACATGCCTCCTGTTGGCAG | p.Tyr268Ter | p.Y268* | P11387 | protein_coding | TCGA-BH-A0HF-01 | Breast | breast invasive carcinoma | Female | >=65 | I/II | Hormone Therapy | arimidex | SD |
| Page: 1 2 3 4 5 6 7 8 9 |
Top |
Related drugs of malignant transformation related genes |
| Identification of chemicals and drugs interact with genes involved in malignant transfromation |
| (DGIdb 4.0) |
| Entrez ID | Symbol | Category | Interaction Types | Drug Claim Name | Drug Name | PMIDs |
| 7150 | TOP1 | CLINICALLY ACTIONABLE, DRUGGABLE GENOME, ENZYME, SERINE THREONINE KINASE | SN-38 | 7-ETHYL-10-HYDROXYCAMPTOTHECIN | ||
| 7150 | TOP1 | CLINICALLY ACTIONABLE, DRUGGABLE GENOME, ENZYME, SERINE THREONINE KINASE | O-METHYLCALOTHRIXIN A | O-METHYLCALOTHRIXIN A | 19203291 | |
| 7150 | TOP1 | CLINICALLY ACTIONABLE, DRUGGABLE GENOME, ENZYME, SERINE THREONINE KINASE | 9-PHENYLIMIDAZO[1,2-H][1,7]NAPHTHYRIDINE | CHEMBL455004 | 22503207 | |
| 7150 | TOP1 | CLINICALLY ACTIONABLE, DRUGGABLE GENOME, ENZYME, SERINE THREONINE KINASE | 10-HYDROXYEVODIAMINE | CHEMBL2171812 | 22867019 | |
| 7150 | TOP1 | CLINICALLY ACTIONABLE, DRUGGABLE GENOME, ENZYME, SERINE THREONINE KINASE | TLC-388 | |||
| 7150 | TOP1 | CLINICALLY ACTIONABLE, DRUGGABLE GENOME, ENZYME, SERINE THREONINE KINASE | SIMOCYCLINONE D8 | SIMOCYCLINONE D8 | 22867097 | |
| 7150 | TOP1 | CLINICALLY ACTIONABLE, DRUGGABLE GENOME, ENZYME, SERINE THREONINE KINASE | TOPOTECAN | TOPOTECAN | ||
| 7150 | TOP1 | CLINICALLY ACTIONABLE, DRUGGABLE GENOME, ENZYME, SERINE THREONINE KINASE | Etirinotecan pegol | |||
| 7150 | TOP1 | CLINICALLY ACTIONABLE, DRUGGABLE GENOME, ENZYME, SERINE THREONINE KINASE | INDIMITECAN | INDIMITECAN | 20630766 | |
| 7150 | TOP1 | CLINICALLY ACTIONABLE, DRUGGABLE GENOME, ENZYME, SERINE THREONINE KINASE | LIPOTECAN |
| Page: 1 2 3 4 5 6 7 8 9 10 11 12 13 14 15 |

Copyright 2023-Present -The University of Texas Health Science Center at Houston |