
|
|||||
|
 | |
| |
| |
| |
| |
| |
|
Gene: TOMM6 |
Gene summary for TOMM6 |
| Gene information | Species | Human | Gene symbol | TOMM6 | Gene ID | 100188893 |
| Gene name | translocase of outer mitochondrial membrane 6 | |
| Gene Alias | OBTP | |
| Cytomap | 6p21.1 | |
| Gene Type | protein-coding | GO ID | GO:0006810 | UniProtAcc | Q96B49 |
Top |
Malignant transformation analysis |
| Identification of the aberrant gene expression in precancerous and cancerous lesions by comparing the gene expression of stem-like cells in diseased tissues with normal stem cells |
| Entrez ID | Symbol | Replicates | Species | Organ | Tissue | Adj P-value | Log2FC | Malignancy |
| 100188893 | TOMM6 | sample1 | Human | Cervix | CC | 2.99e-23 | 6.26e-01 | 0.0959 |
| 100188893 | TOMM6 | sample3 | Human | Cervix | CC | 2.01e-33 | 4.87e-01 | 0.1387 |
| 100188893 | TOMM6 | H2 | Human | Cervix | HSIL_HPV | 7.90e-34 | 5.59e-01 | 0.0632 |
| 100188893 | TOMM6 | L1 | Human | Cervix | CC | 8.92e-16 | 5.82e-01 | 0.0802 |
| 100188893 | TOMM6 | T1 | Human | Cervix | CC | 1.02e-30 | 5.21e-01 | 0.0918 |
| 100188893 | TOMM6 | T2 | Human | Cervix | CC | 4.45e-22 | 6.61e-01 | 0.0709 |
| 100188893 | TOMM6 | T3 | Human | Cervix | CC | 4.67e-35 | 4.77e-01 | 0.1389 |
| 100188893 | TOMM6 | AEH-subject1 | Human | Endometrium | AEH | 1.92e-21 | 4.00e-01 | -0.3059 |
| 100188893 | TOMM6 | AEH-subject2 | Human | Endometrium | AEH | 9.27e-22 | 4.55e-01 | -0.2525 |
| 100188893 | TOMM6 | AEH-subject3 | Human | Endometrium | AEH | 3.50e-22 | 4.57e-01 | -0.2576 |
| 100188893 | TOMM6 | AEH-subject4 | Human | Endometrium | AEH | 3.72e-16 | 4.30e-01 | -0.2657 |
| 100188893 | TOMM6 | AEH-subject5 | Human | Endometrium | AEH | 7.80e-30 | 4.95e-01 | -0.2953 |
| 100188893 | TOMM6 | EEC-subject1 | Human | Endometrium | EEC | 5.79e-15 | 3.65e-01 | -0.2682 |
| 100188893 | TOMM6 | EEC-subject2 | Human | Endometrium | EEC | 1.05e-20 | 4.40e-01 | -0.2607 |
| 100188893 | TOMM6 | EEC-subject3 | Human | Endometrium | EEC | 3.99e-06 | 2.88e-01 | -0.2525 |
| 100188893 | TOMM6 | EEC-subject4 | Human | Endometrium | EEC | 4.51e-35 | 6.07e-01 | -0.2571 |
| 100188893 | TOMM6 | EEC-subject5 | Human | Endometrium | EEC | 1.73e-27 | 5.22e-01 | -0.249 |
| 100188893 | TOMM6 | LZE2D | Human | Esophagus | HGIN | 2.90e-10 | 1.10e+00 | 0.0642 |
| 100188893 | TOMM6 | LZE2T | Human | Esophagus | ESCC | 2.21e-25 | 3.93e+00 | 0.082 |
| 100188893 | TOMM6 | LZE3D | Human | Esophagus | HGIN | 8.88e-07 | 7.66e-01 | 0.0668 |
| Page: 1 2 3 4 5 6 |
| Tissue | Expression Dynamics | Abbreviation |
| Cervix | 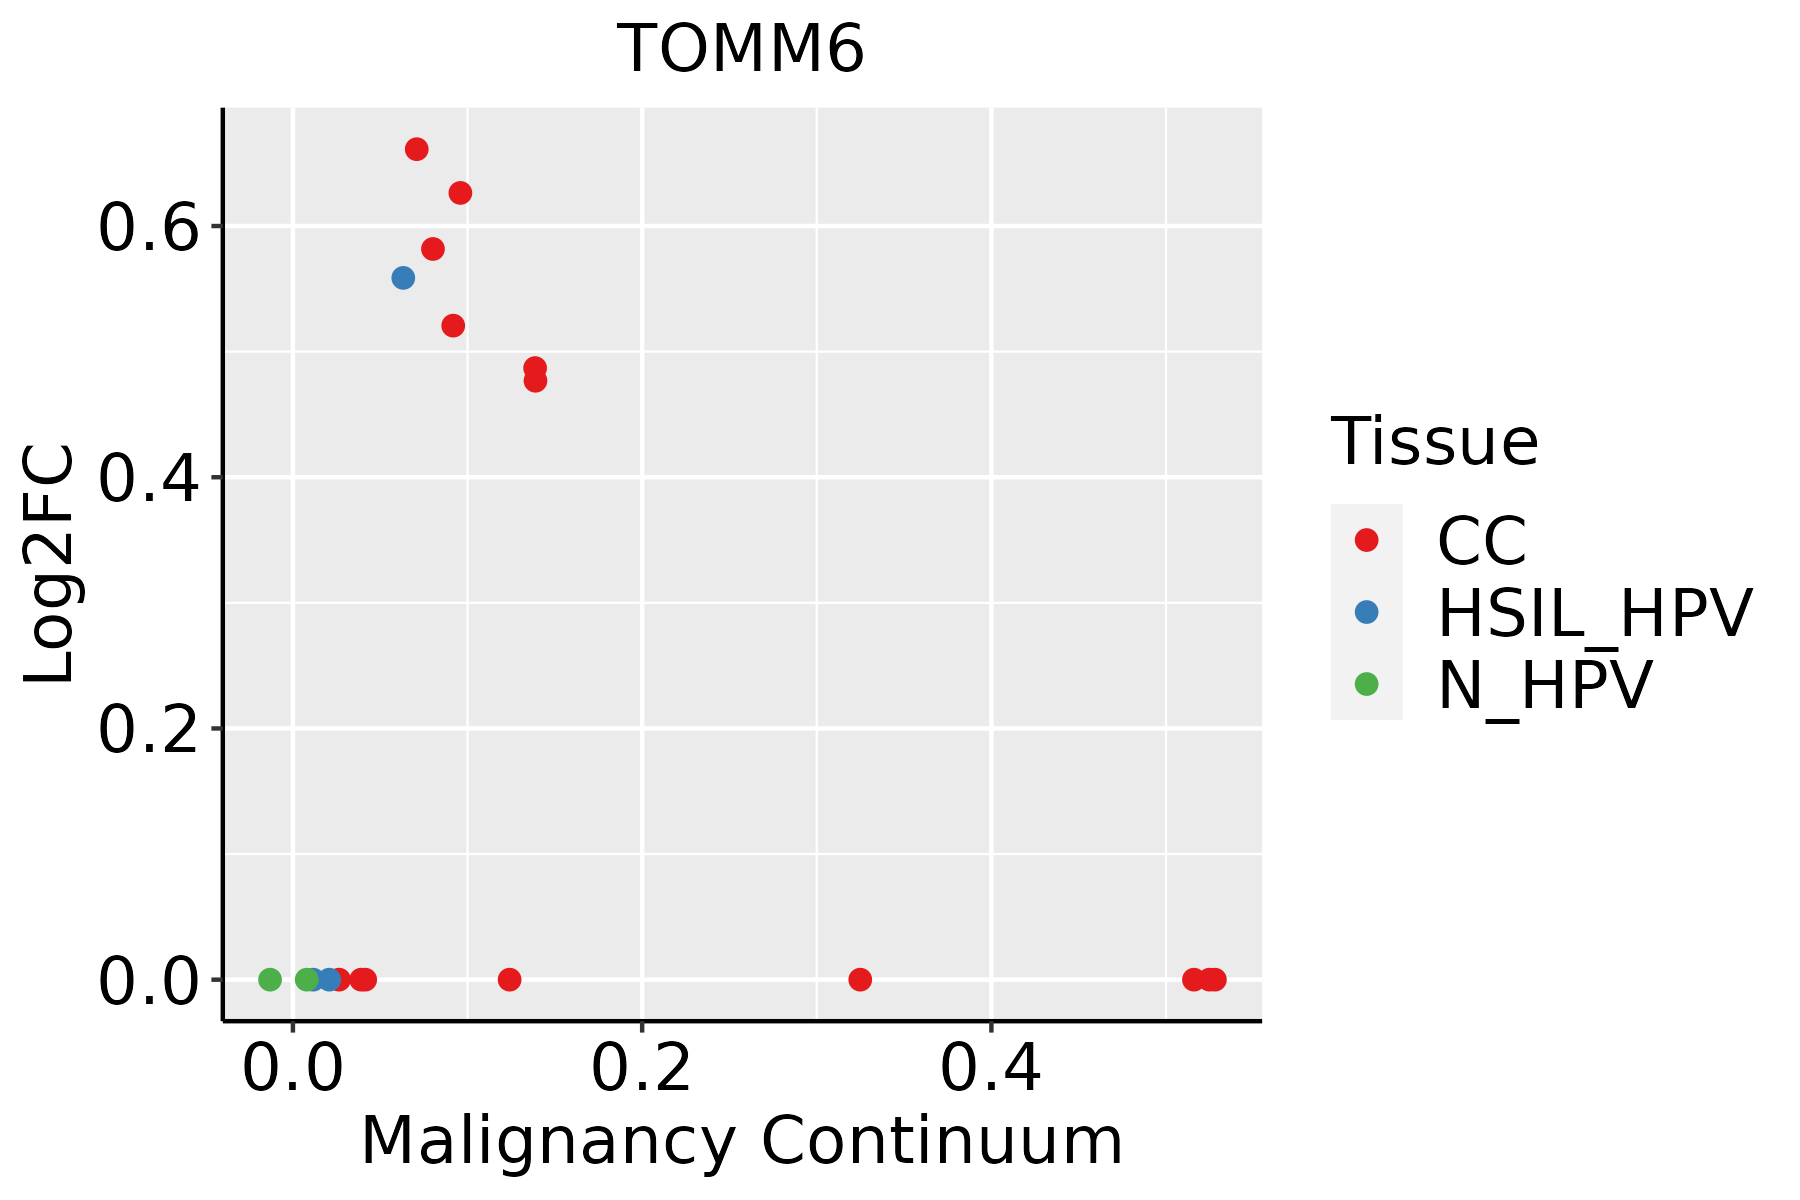 | CC: Cervix cancer |
| HSIL_HPV: HPV-infected high-grade squamous intraepithelial lesions | ||
| N_HPV: HPV-infected normal cervix | ||
| Endometrium |  | AEH: Atypical endometrial hyperplasia |
| EEC: Endometrioid Cancer | ||
| Esophagus | 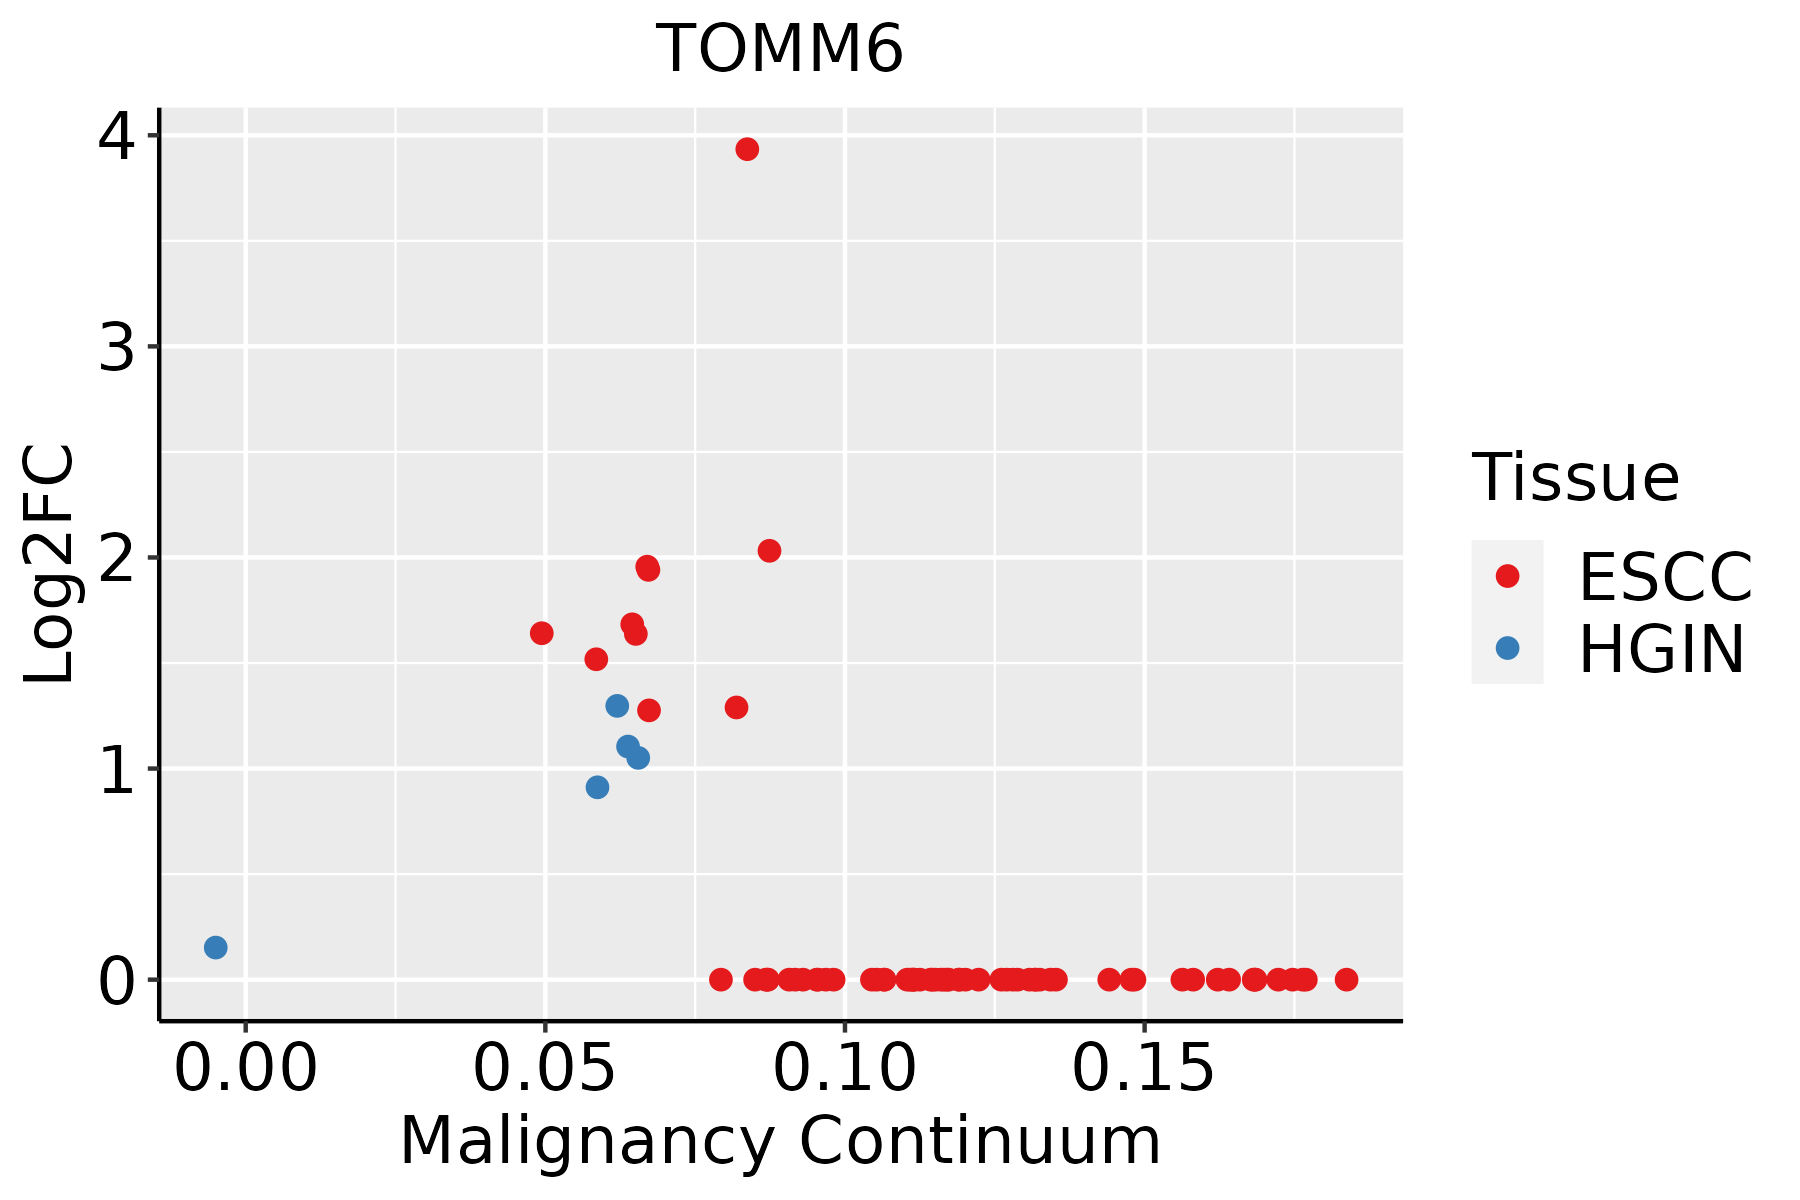 | ESCC: Esophageal squamous cell carcinoma |
| HGIN: High-grade intraepithelial neoplasias | ||
| LGIN: Low-grade intraepithelial neoplasias | ||
| GC |  | CAG: Chronic atrophic gastritis |
| CAG with IM: Chronic atrophic gastritis with intestinal metaplasia | ||
| CSG: Chronic superficial gastritis | ||
| GC: Gastric cancer | ||
| SIM: Severe intestinal metaplasia | ||
| WIM: Wild intestinal metaplasia | ||
| Liver | 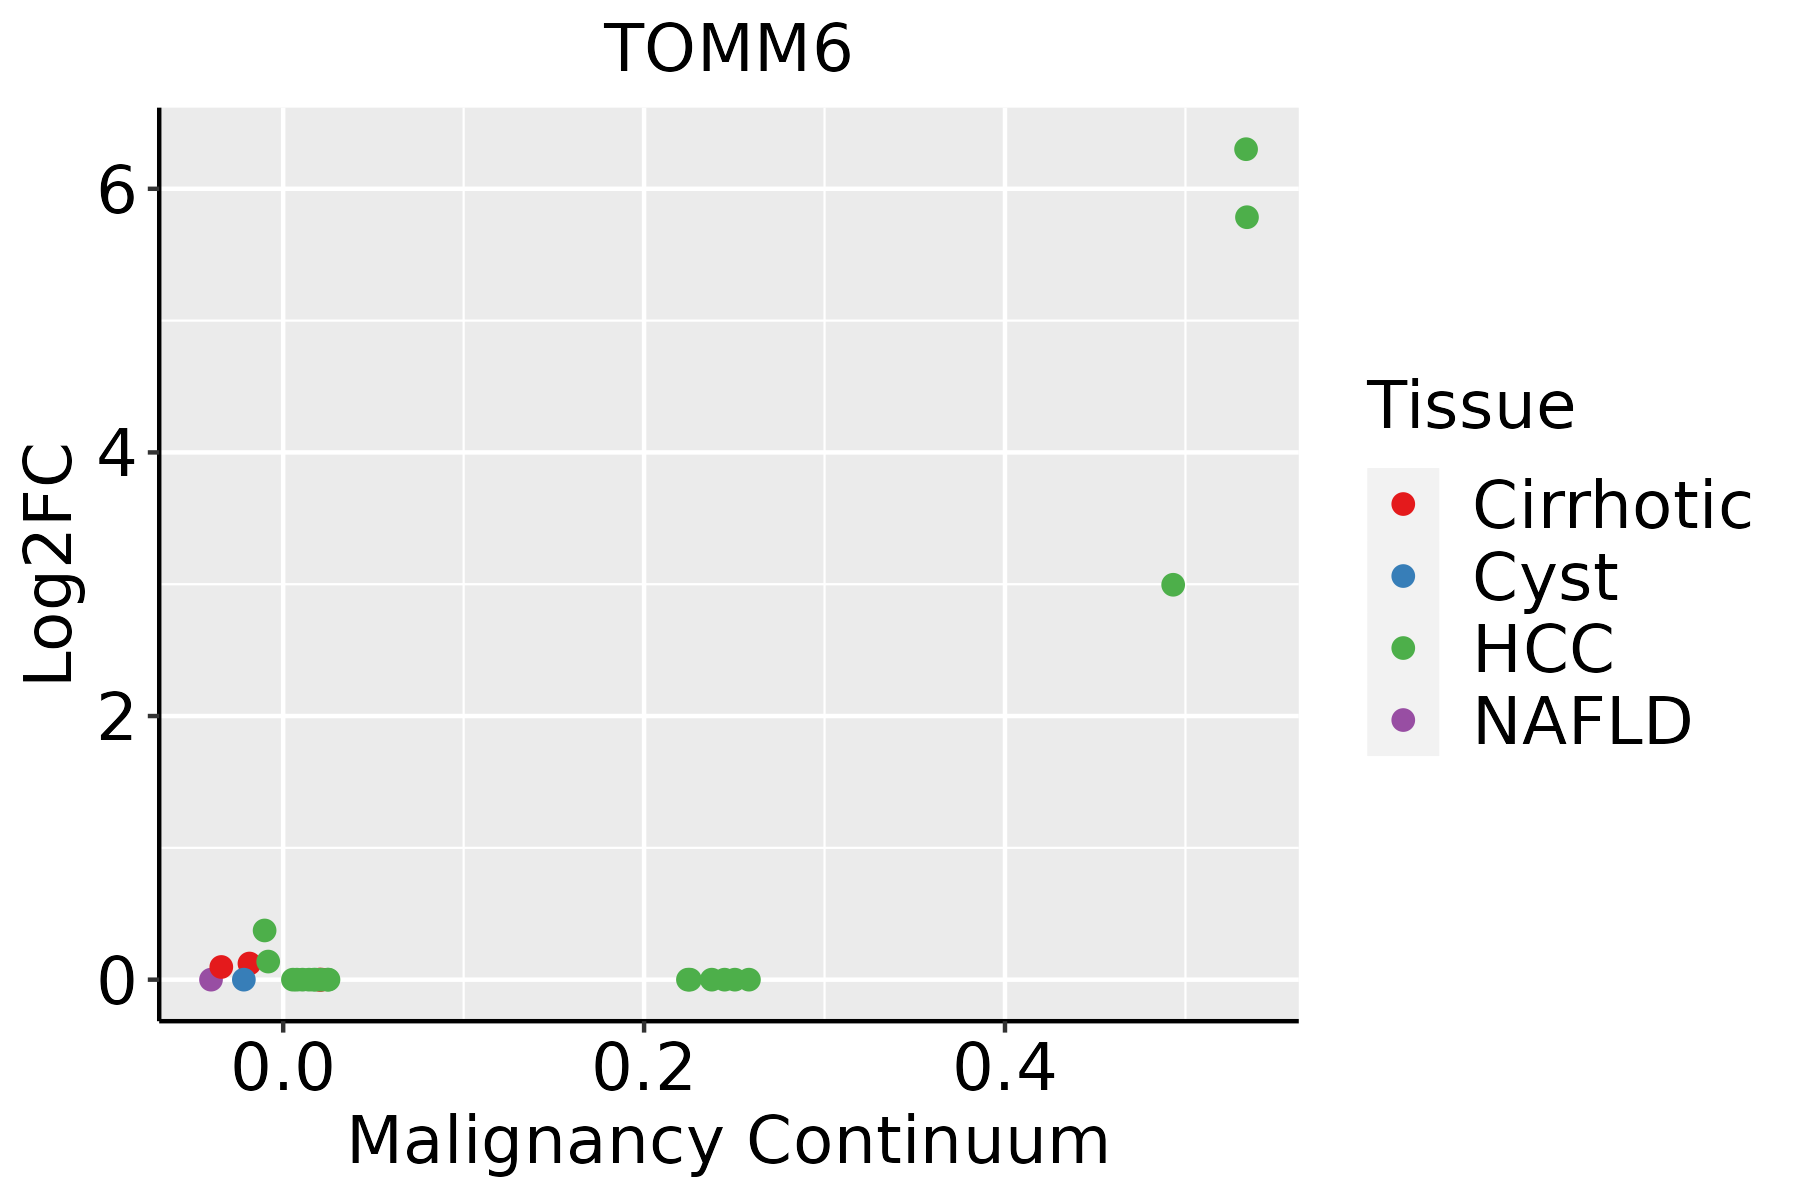 | HCC: Hepatocellular carcinoma |
| NAFLD: Non-alcoholic fatty liver disease | ||
| Lung | 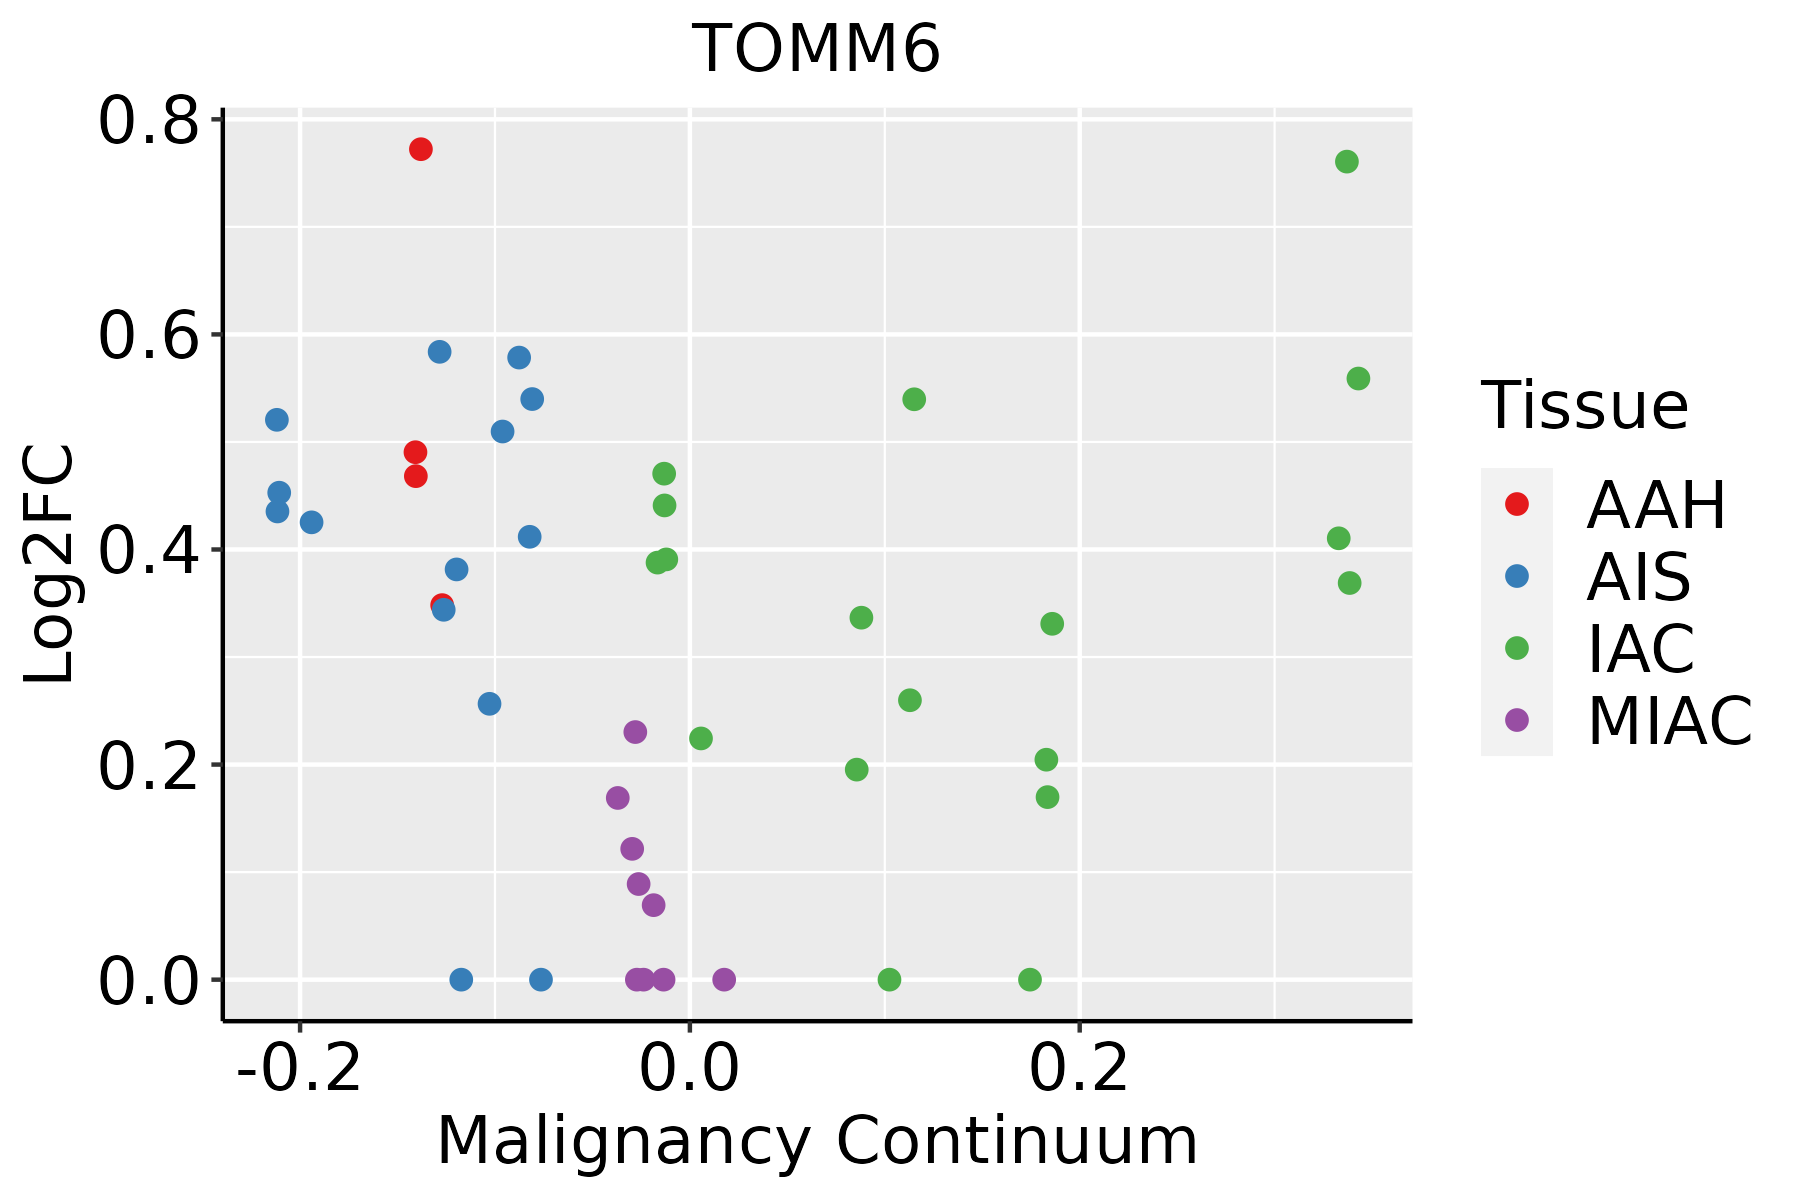 | AAH: Atypical adenomatous hyperplasia |
| AIS: Adenocarcinoma in situ | ||
| IAC: Invasive lung adenocarcinoma | ||
| MIA: Minimally invasive adenocarcinoma | ||
| Prostate | 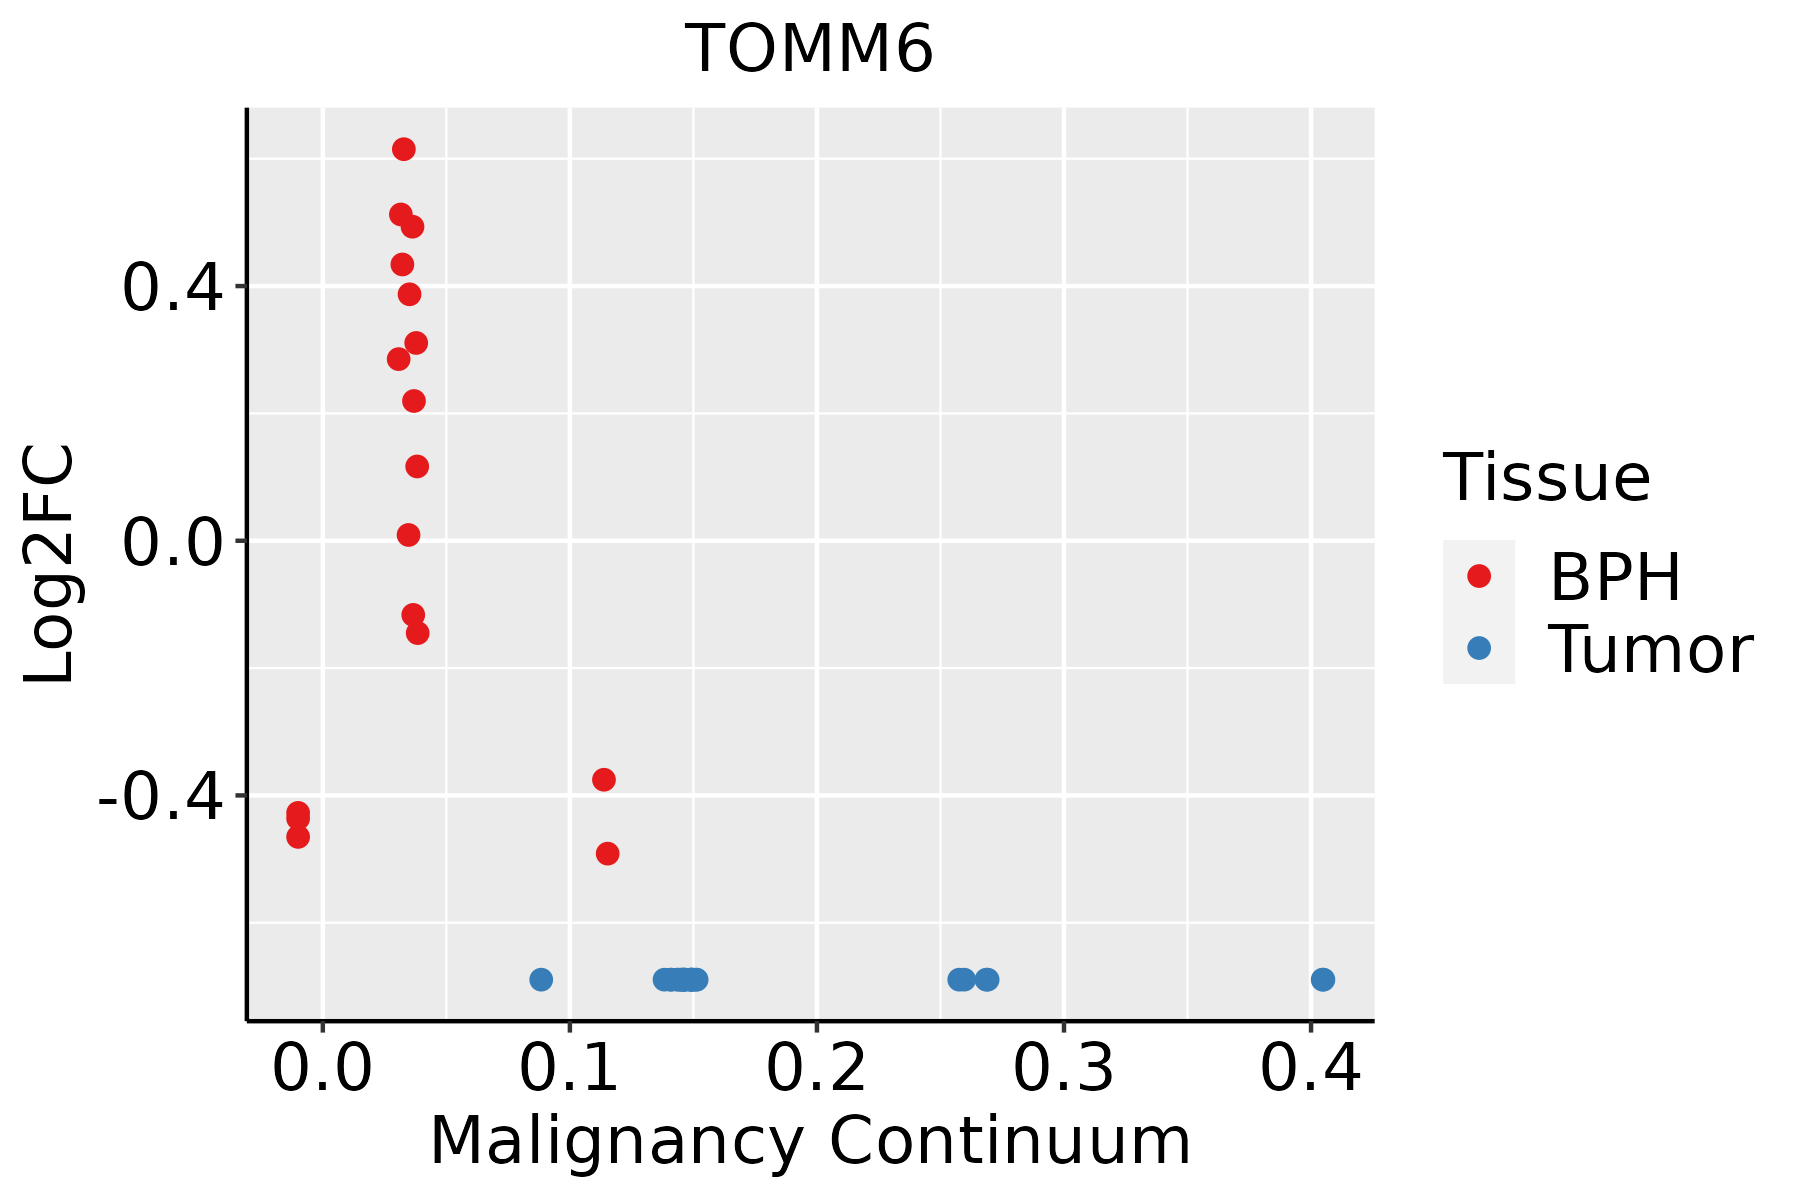 | BPH: Benign Prostatic Hyperplasia |
| Skin | 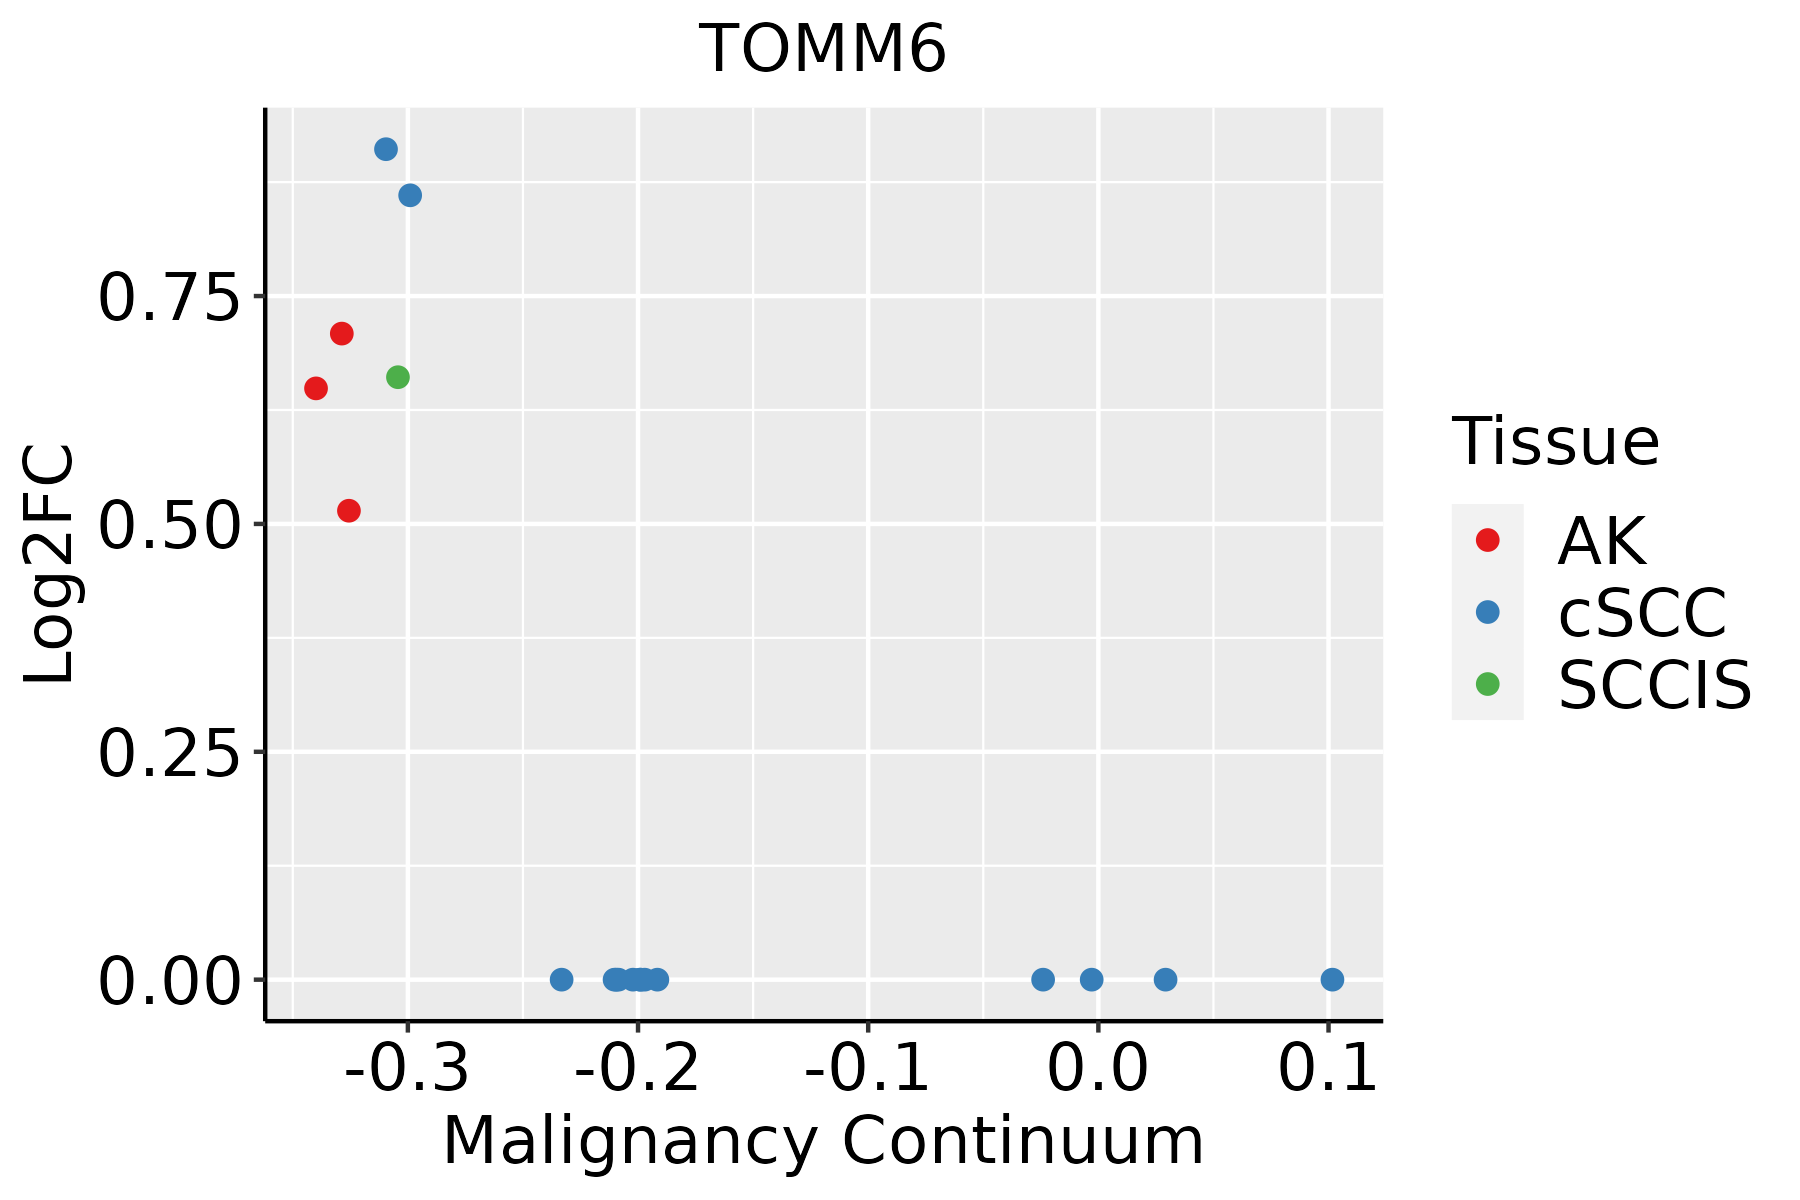 | AK: Actinic keratosis |
| cSCC: Cutaneous squamous cell carcinoma | ||
| SCCIS:squamous cell carcinoma in situ |
| ∗log2FC in expression of this searched gene in stem-like cells from each diseased tissue sample relative to stem-like cells in normal samples in each tissue plotted against the malignancy continuum. Samples are colored based on if they are from different disease stage. |
Top |
Malignant transformation related pathway analysis |
| Find out the enriched GO biological processes and KEGG pathways involved in transition from healthy to precancer to cancer |
| Tissue | Disease Stage | Enriched GO biological Processes |
| Colorectum | AD |  |
| Colorectum | SER |  |
| Colorectum | MSS |  |
| Colorectum | MSI-H |  |
| Colorectum | FAP |  |
| ∗Top 15 enriched GO BP terms are showed in the bar plot of each disease state in each tissue. Each row represents a significant GO biological process which is colored according to the -log10(p.adjust). |
| Page: 1 2 3 4 5 6 7 8 9 |
| GO ID | Tissue | Disease Stage | Description | Gene Ratio | Bg Ratio | pvalue | p.adjust | Count |
| Page: 1 |
| Pathway ID | Tissue | Disease Stage | Description | Gene Ratio | Bg Ratio | pvalue | p.adjust | qvalue | Count |
| Page: 1 |
Top |
Cell-cell communication analysis |
| Identification of potential cell-cell interactions between two cell types and their ligand-receptor pairs for different disease states |
| Ligand | Receptor | LRpair | Pathway | Tissue | Disease Stage |
| Page: 1 |
Top |
Single-cell gene regulatory network inference analysis |
| Find out the significant the regulons (TFs) and the target genes of each regulon across cell types for different disease states |
| TF | Cell Type | Tissue | Disease Stage | Target Gene | RSS | Regulon Activity |
| ∗The dot plots of a searched regulon are shown for all cell subpopulations in each disease state of each tissue based on the regulon specific score inferred using pySCENIC and by calculating the average expression. |
| Page: 1 |
Top |
Somatic mutation of malignant transformation related genes |
| Annotation of somatic variants for genes involved in malignant transformation |
| Hugo Symbol | Variant Class | Variant Classification | dbSNP RS | HGVSc | HGVSp | HGVSp Short | SWISSPROT | BIOTYPE | SIFT | PolyPhen | Tumor Sample Barcode | Tissue | Histology | Sex | Age | Stage | Therapy Types | Drugs | Outcome |
| TOMM6 | SNV | Missense_Mutation | c.38C>G | p.Ser13Trp | p.S13W | Q96B49 | protein_coding | tolerated_low_confidence(0.2) | benign(0.344) | TCGA-AC-A23H-01 | Breast | breast invasive carcinoma | Female | >=65 | I/II | Unknown | Unknown | PD | |
| TOMM6 | SNV | Missense_Mutation | c.206C>A | p.Ala69Glu | p.A69E | Q96B49 | protein_coding | deleterious(0) | probably_damaging(0.998) | TCGA-EW-A1PB-01 | Breast | breast invasive carcinoma | Female | >=65 | III/IV | Unknown | Unknown | SD | |
| TOMM6 | SNV | Missense_Mutation | novel | c.143N>G | p.Asn48Ser | p.N48S | Q96B49 | protein_coding | tolerated(0.11) | probably_damaging(0.99) | TCGA-CA-6717-01 | Colorectum | colon adenocarcinoma | Male | <65 | I/II | Chemotherapy | oxaliplatin | CR |
| TOMM6 | SNV | Missense_Mutation | c.218G>A | p.Gly73Glu | p.G73E | Q96B49 | protein_coding | deleterious_low_confidence(0.01) | possibly_damaging(0.9) | TCGA-G4-6628-01 | Colorectum | colon adenocarcinoma | Male | >=65 | I/II | Unknown | Unknown | SD | |
| TOMM6 | SNV | Missense_Mutation | novel | c.76N>T | p.Asp26Tyr | p.D26Y | Q96B49 | protein_coding | deleterious(0) | possibly_damaging(0.847) | TCGA-AX-A1CE-01 | Endometrium | uterine corpus endometrioid carcinoma | Female | <65 | I/II | Unspecific | Paclitaxel | SD |
| TOMM6 | SNV | Missense_Mutation | c.129N>T | p.Arg43Ser | p.R43S | Q96B49 | protein_coding | deleterious(0.02) | probably_damaging(0.994) | TCGA-BS-A0UV-01 | Endometrium | uterine corpus endometrioid carcinoma | Female | <65 | III/IV | Unknown | Unknown | SD | |
| TOMM6 | SNV | Missense_Mutation | novel | c.76N>T | p.Asp26Tyr | p.D26Y | Q96B49 | protein_coding | deleterious(0) | possibly_damaging(0.847) | TCGA-E6-A1LX-01 | Endometrium | uterine corpus endometrioid carcinoma | Female | <65 | I/II | Unknown | Unknown | SD |
| TOMM6 | SNV | Missense_Mutation | novel | c.191N>G | p.Asp64Gly | p.D64G | Q96B49 | protein_coding | deleterious(0.04) | probably_damaging(0.998) | TCGA-E6-A1LX-01 | Endometrium | uterine corpus endometrioid carcinoma | Female | <65 | I/II | Unknown | Unknown | SD |
| TOMM6 | SNV | Missense_Mutation | novel | c.142N>C | p.Asn48His | p.N48H | Q96B49 | protein_coding | deleterious(0.03) | probably_damaging(0.998) | TCGA-EO-A3B0-01 | Endometrium | uterine corpus endometrioid carcinoma | Female | <65 | III/IV | Unknown | Unknown | SD |
| Page: 1 |
Top |
Related drugs of malignant transformation related genes |
| Identification of chemicals and drugs interact with genes involved in malignant transfromation |
| (DGIdb 4.0) |
| Entrez ID | Symbol | Category | Interaction Types | Drug Claim Name | Drug Name | PMIDs |
| Page: 1 |

Copyright 2023-Present -The University of Texas Health Science Center at Houston |