
|
|||||
|
 | |
| |
| |
| |
| |
| |
|
Gene: TOMM40L |
Gene summary for TOMM40L |
| Gene information | Species | Human | Gene symbol | TOMM40L | Gene ID | 84134 |
| Gene name | translocase of outer mitochondrial membrane 40 like | |
| Gene Alias | TOMM40B | |
| Cytomap | 1q23.3 | |
| Gene Type | protein-coding | GO ID | GO:0006605 | UniProtAcc | Q969M1 |
Top |
Malignant transformation analysis |
| Identification of the aberrant gene expression in precancerous and cancerous lesions by comparing the gene expression of stem-like cells in diseased tissues with normal stem cells |
| Entrez ID | Symbol | Replicates | Species | Organ | Tissue | Adj P-value | Log2FC | Malignancy |
| 84134 | TOMM40L | HCC1_Meng | Human | Liver | HCC | 8.58e-19 | 5.74e-02 | 0.0246 |
| 84134 | TOMM40L | HCC1 | Human | Liver | HCC | 1.30e-02 | 2.75e+00 | 0.5336 |
| 84134 | TOMM40L | HCC2 | Human | Liver | HCC | 3.06e-23 | 3.10e+00 | 0.5341 |
| 84134 | TOMM40L | S014 | Human | Liver | HCC | 1.76e-08 | 3.23e-01 | 0.2254 |
| 84134 | TOMM40L | S015 | Human | Liver | HCC | 1.95e-08 | 3.83e-01 | 0.2375 |
| 84134 | TOMM40L | S016 | Human | Liver | HCC | 3.36e-10 | 3.51e-01 | 0.2243 |
| 84134 | TOMM40L | S027 | Human | Liver | HCC | 7.12e-04 | 3.47e-01 | 0.2446 |
| 84134 | TOMM40L | S028 | Human | Liver | HCC | 1.01e-15 | 4.74e-01 | 0.2503 |
| 84134 | TOMM40L | S029 | Human | Liver | HCC | 2.59e-13 | 4.90e-01 | 0.2581 |
| Page: 1 |
| Tissue | Expression Dynamics | Abbreviation |
| Liver | 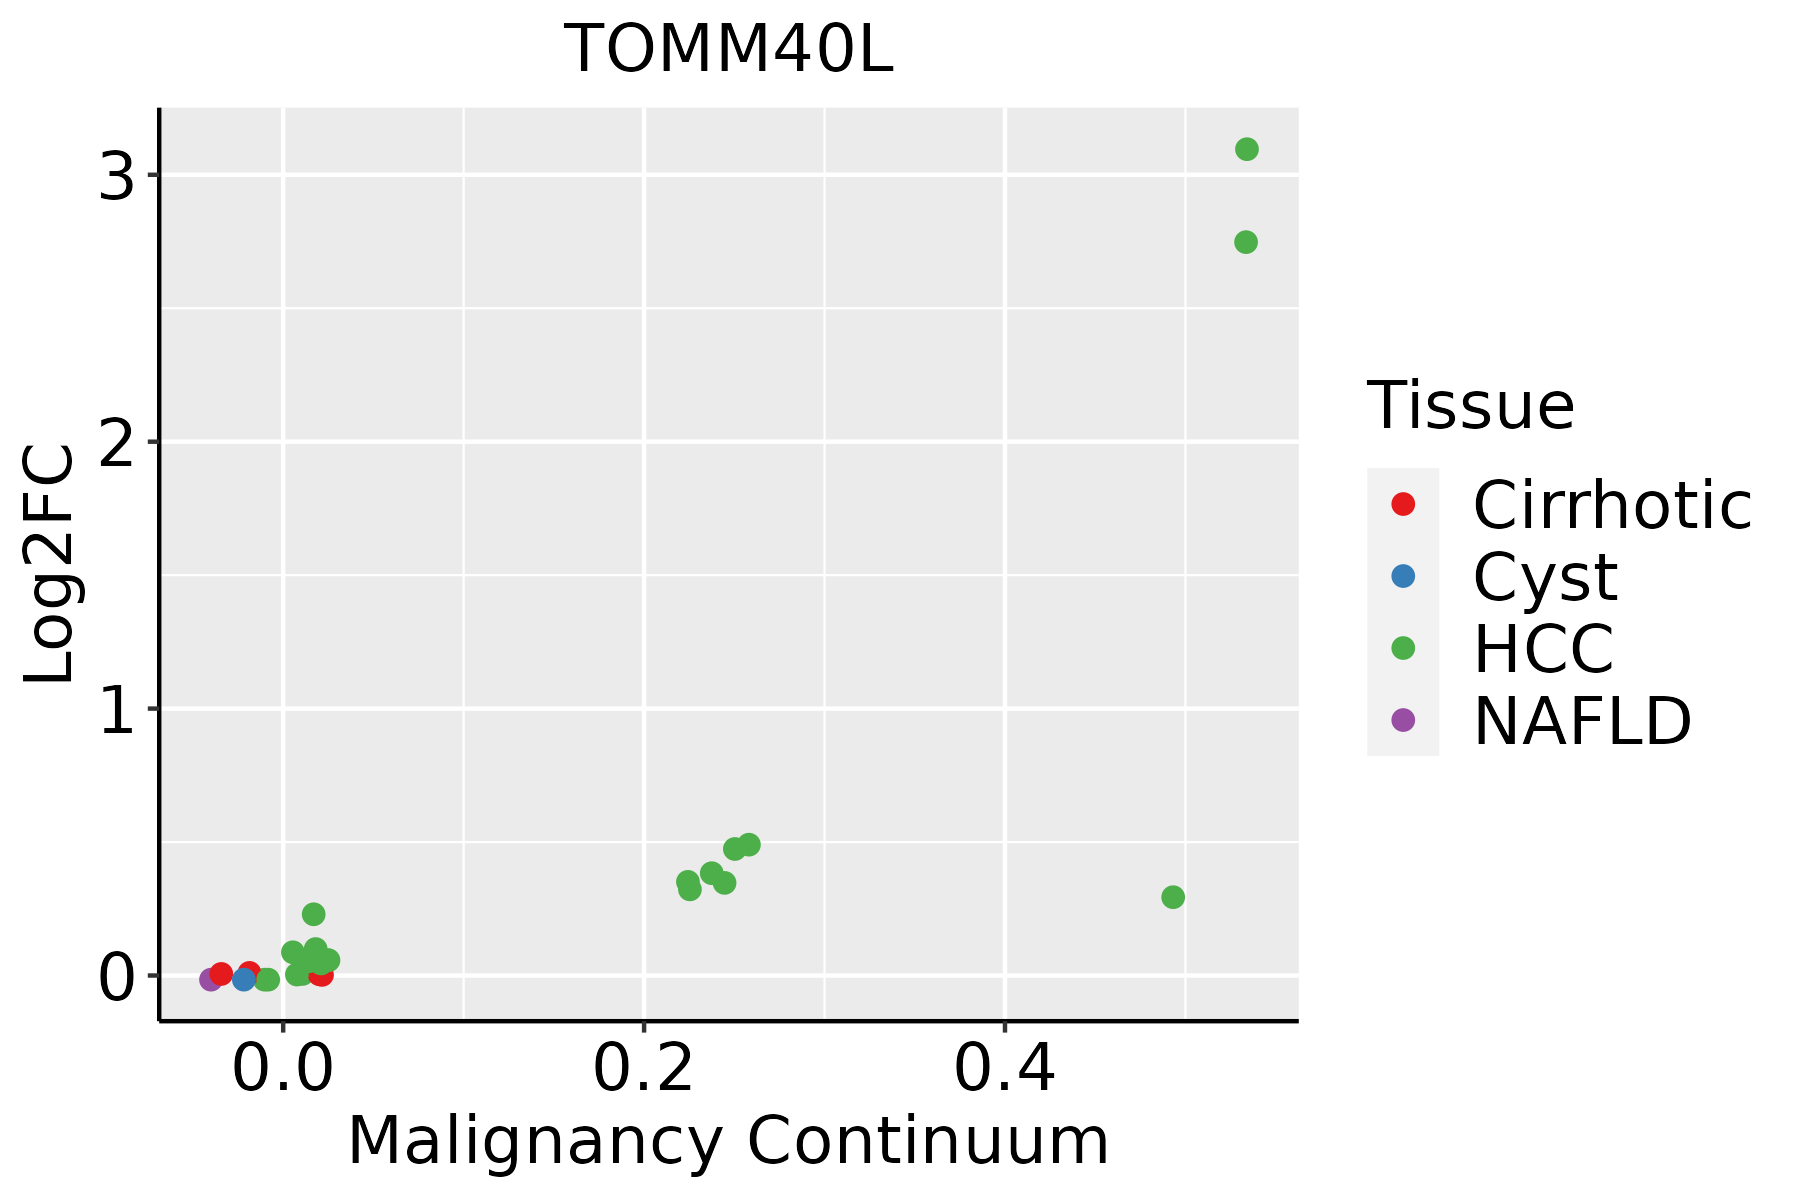 | HCC: Hepatocellular carcinoma |
| NAFLD: Non-alcoholic fatty liver disease |
| ∗log2FC in expression of this searched gene in stem-like cells from each diseased tissue sample relative to stem-like cells in normal samples in each tissue plotted against the malignancy continuum. Samples are colored based on if they are from different disease stage. |
Top |
Malignant transformation related pathway analysis |
| Find out the enriched GO biological processes and KEGG pathways involved in transition from healthy to precancer to cancer |
| Tissue | Disease Stage | Enriched GO biological Processes |
| Colorectum | AD |  |
| Colorectum | SER |  |
| Colorectum | MSS |  |
| Colorectum | MSI-H |  |
| Colorectum | FAP |  |
| ∗Top 15 enriched GO BP terms are showed in the bar plot of each disease state in each tissue. Each row represents a significant GO biological process which is colored according to the -log10(p.adjust). |
| Page: 1 2 3 4 5 6 7 8 9 |
| GO ID | Tissue | Disease Stage | Description | Gene Ratio | Bg Ratio | pvalue | p.adjust | Count |
| GO:007259422 | Liver | HCC | establishment of protein localization to organelle | 299/7958 | 422/18723 | 1.06e-32 | 6.10e-30 | 299 |
| GO:000660512 | Liver | HCC | protein targeting | 219/7958 | 314/18723 | 7.74e-23 | 1.49e-20 | 219 |
| GO:000683912 | Liver | HCC | mitochondrial transport | 184/7958 | 254/18723 | 2.30e-22 | 3.83e-20 | 184 |
| GO:007265512 | Liver | HCC | establishment of protein localization to mitochondrion | 98/7958 | 120/18723 | 1.18e-18 | 1.46e-16 | 98 |
| GO:007058512 | Liver | HCC | protein localization to mitochondrion | 101/7958 | 125/18723 | 1.53e-18 | 1.86e-16 | 101 |
| GO:000662612 | Liver | HCC | protein targeting to mitochondrion | 82/7958 | 100/18723 | 4.93e-16 | 4.05e-14 | 82 |
| GO:001703811 | Liver | HCC | protein import | 140/7958 | 206/18723 | 1.12e-13 | 6.46e-12 | 140 |
| GO:199054212 | Liver | HCC | mitochondrial transmembrane transport | 78/7958 | 102/18723 | 2.73e-12 | 1.26e-10 | 78 |
| GO:007180611 | Liver | HCC | protein transmembrane transport | 47/7958 | 59/18723 | 5.82e-09 | 1.51e-07 | 47 |
| GO:006500211 | Liver | HCC | intracellular protein transmembrane transport | 41/7958 | 51/18723 | 3.41e-08 | 7.61e-07 | 41 |
| GO:00447431 | Liver | HCC | protein transmembrane import into intracellular organelle | 29/7958 | 36/18723 | 3.42e-06 | 4.49e-05 | 29 |
| GO:00301501 | Liver | HCC | protein import into mitochondrial matrix | 17/7958 | 20/18723 | 1.18e-04 | 9.87e-04 | 17 |
| Page: 1 |
| Pathway ID | Tissue | Disease Stage | Description | Gene Ratio | Bg Ratio | pvalue | p.adjust | qvalue | Count |
| hsa0501422 | Liver | HCC | Amyotrophic lateral sclerosis | 252/4020 | 364/8465 | 8.85e-18 | 7.41e-16 | 4.12e-16 | 252 |
| hsa0502222 | Liver | HCC | Pathways of neurodegeneration - multiple diseases | 298/4020 | 476/8465 | 6.59e-12 | 1.30e-10 | 7.22e-11 | 298 |
| hsa0501432 | Liver | HCC | Amyotrophic lateral sclerosis | 252/4020 | 364/8465 | 8.85e-18 | 7.41e-16 | 4.12e-16 | 252 |
| hsa0502232 | Liver | HCC | Pathways of neurodegeneration - multiple diseases | 298/4020 | 476/8465 | 6.59e-12 | 1.30e-10 | 7.22e-11 | 298 |
| Page: 1 |
Top |
Cell-cell communication analysis |
| Identification of potential cell-cell interactions between two cell types and their ligand-receptor pairs for different disease states |
| Ligand | Receptor | LRpair | Pathway | Tissue | Disease Stage |
| Page: 1 |
Top |
Single-cell gene regulatory network inference analysis |
| Find out the significant the regulons (TFs) and the target genes of each regulon across cell types for different disease states |
| TF | Cell Type | Tissue | Disease Stage | Target Gene | RSS | Regulon Activity |
| ∗The dot plots of a searched regulon are shown for all cell subpopulations in each disease state of each tissue based on the regulon specific score inferred using pySCENIC and by calculating the average expression. |
| Page: 1 |
Top |
Somatic mutation of malignant transformation related genes |
| Annotation of somatic variants for genes involved in malignant transformation |
| Hugo Symbol | Variant Class | Variant Classification | dbSNP RS | HGVSc | HGVSp | HGVSp Short | SWISSPROT | BIOTYPE | SIFT | PolyPhen | Tumor Sample Barcode | Tissue | Histology | Sex | Age | Stage | Therapy Types | Drugs | Outcome |
| TOMM40L | SNV | Missense_Mutation | rs768226600 | c.532N>G | p.Leu178Val | p.L178V | Q969M1 | protein_coding | tolerated(0.11) | possibly_damaging(0.773) | TCGA-A2-A0T2-01 | Breast | breast invasive carcinoma | Female | >=65 | III/IV | Chemotherapy | xeloda | PD |
| TOMM40L | SNV | Missense_Mutation | c.716N>G | p.Thr239Arg | p.T239R | Q969M1 | protein_coding | tolerated(0.34) | benign(0.326) | TCGA-AR-A1AY-01 | Breast | breast invasive carcinoma | Female | >=65 | I/II | Unspecific | Doxorubicin | SD | |
| TOMM40L | SNV | Missense_Mutation | c.722T>C | p.Leu241Pro | p.L241P | Q969M1 | protein_coding | deleterious(0.03) | possibly_damaging(0.657) | TCGA-BH-A18G-01 | Breast | breast invasive carcinoma | Female | >=65 | I/II | Unknown | Unknown | SD | |
| TOMM40L | insertion | Frame_Shift_Ins | novel | c.412_413insGTGCTTATTCCTTCCCTTCCCCTACCCCCTTCAGATGTATTCCC | p.Asp138GlyfsTer28 | p.D138Gfs*28 | Q969M1 | protein_coding | TCGA-A8-A07J-01 | Breast | breast invasive carcinoma | Female | <65 | I/II | Chemotherapy | 5-fluorouracil | CR | ||
| TOMM40L | SNV | Missense_Mutation | rs760346591 | c.776T>C | p.Met259Thr | p.M259T | Q969M1 | protein_coding | deleterious(0) | benign(0.281) | TCGA-2W-A8YY-01 | Cervix | cervical & endocervical cancer | Female | <65 | I/II | Chemotherapy | cisplatin | CR |
| TOMM40L | SNV | Missense_Mutation | c.727G>C | p.Asp243His | p.D243H | Q969M1 | protein_coding | deleterious(0) | probably_damaging(0.928) | TCGA-Q1-A73O-01 | Cervix | cervical & endocervical cancer | Female | <65 | I/II | Chemotherapy | cisplatin | CR | |
| TOMM40L | SNV | Missense_Mutation | rs751095727 | c.304N>A | p.Asp102Asn | p.D102N | Q969M1 | protein_coding | deleterious(0.03) | probably_damaging(0.98) | TCGA-AA-3984-01 | Colorectum | colon adenocarcinoma | Female | <65 | I/II | Unknown | Unknown | SD |
| TOMM40L | SNV | Missense_Mutation | rs751824628 | c.523N>T | p.Arg175Trp | p.R175W | Q969M1 | protein_coding | deleterious(0.01) | probably_damaging(0.987) | TCGA-AP-A1DV-01 | Endometrium | uterine corpus endometrioid carcinoma | Female | <65 | I/II | Unknown | Unknown | SD |
| TOMM40L | SNV | Missense_Mutation | novel | c.254A>C | p.Asp85Ala | p.D85A | Q969M1 | protein_coding | tolerated(0.05) | benign(0.229) | TCGA-AX-A2HC-01 | Endometrium | uterine corpus endometrioid carcinoma | Female | <65 | III/IV | Chemotherapy | paclitaxel | PD |
| TOMM40L | SNV | Missense_Mutation | c.128C>T | p.Ala43Val | p.A43V | Q969M1 | protein_coding | tolerated(0.55) | benign(0) | TCGA-B5-A11E-01 | Endometrium | uterine corpus endometrioid carcinoma | Female | <65 | I/II | Unknown | Unknown | SD |
| Page: 1 2 |
Top |
Related drugs of malignant transformation related genes |
| Identification of chemicals and drugs interact with genes involved in malignant transfromation |
| (DGIdb 4.0) |
| Entrez ID | Symbol | Category | Interaction Types | Drug Claim Name | Drug Name | PMIDs |
| Page: 1 |

Copyright 2023-Present -The University of Texas Health Science Center at Houston |