| Tissue | Expression Dynamics | Abbreviation |
| Colorectum (GSE201348) |  | FAP: Familial adenomatous polyposis |
| CRC: Colorectal cancer |
| Colorectum (HTA11) |  | AD: Adenomas |
| SER: Sessile serrated lesions |
| MSI-H: Microsatellite-high colorectal cancer |
| MSS: Microsatellite stable colorectal cancer |
| Esophagus | 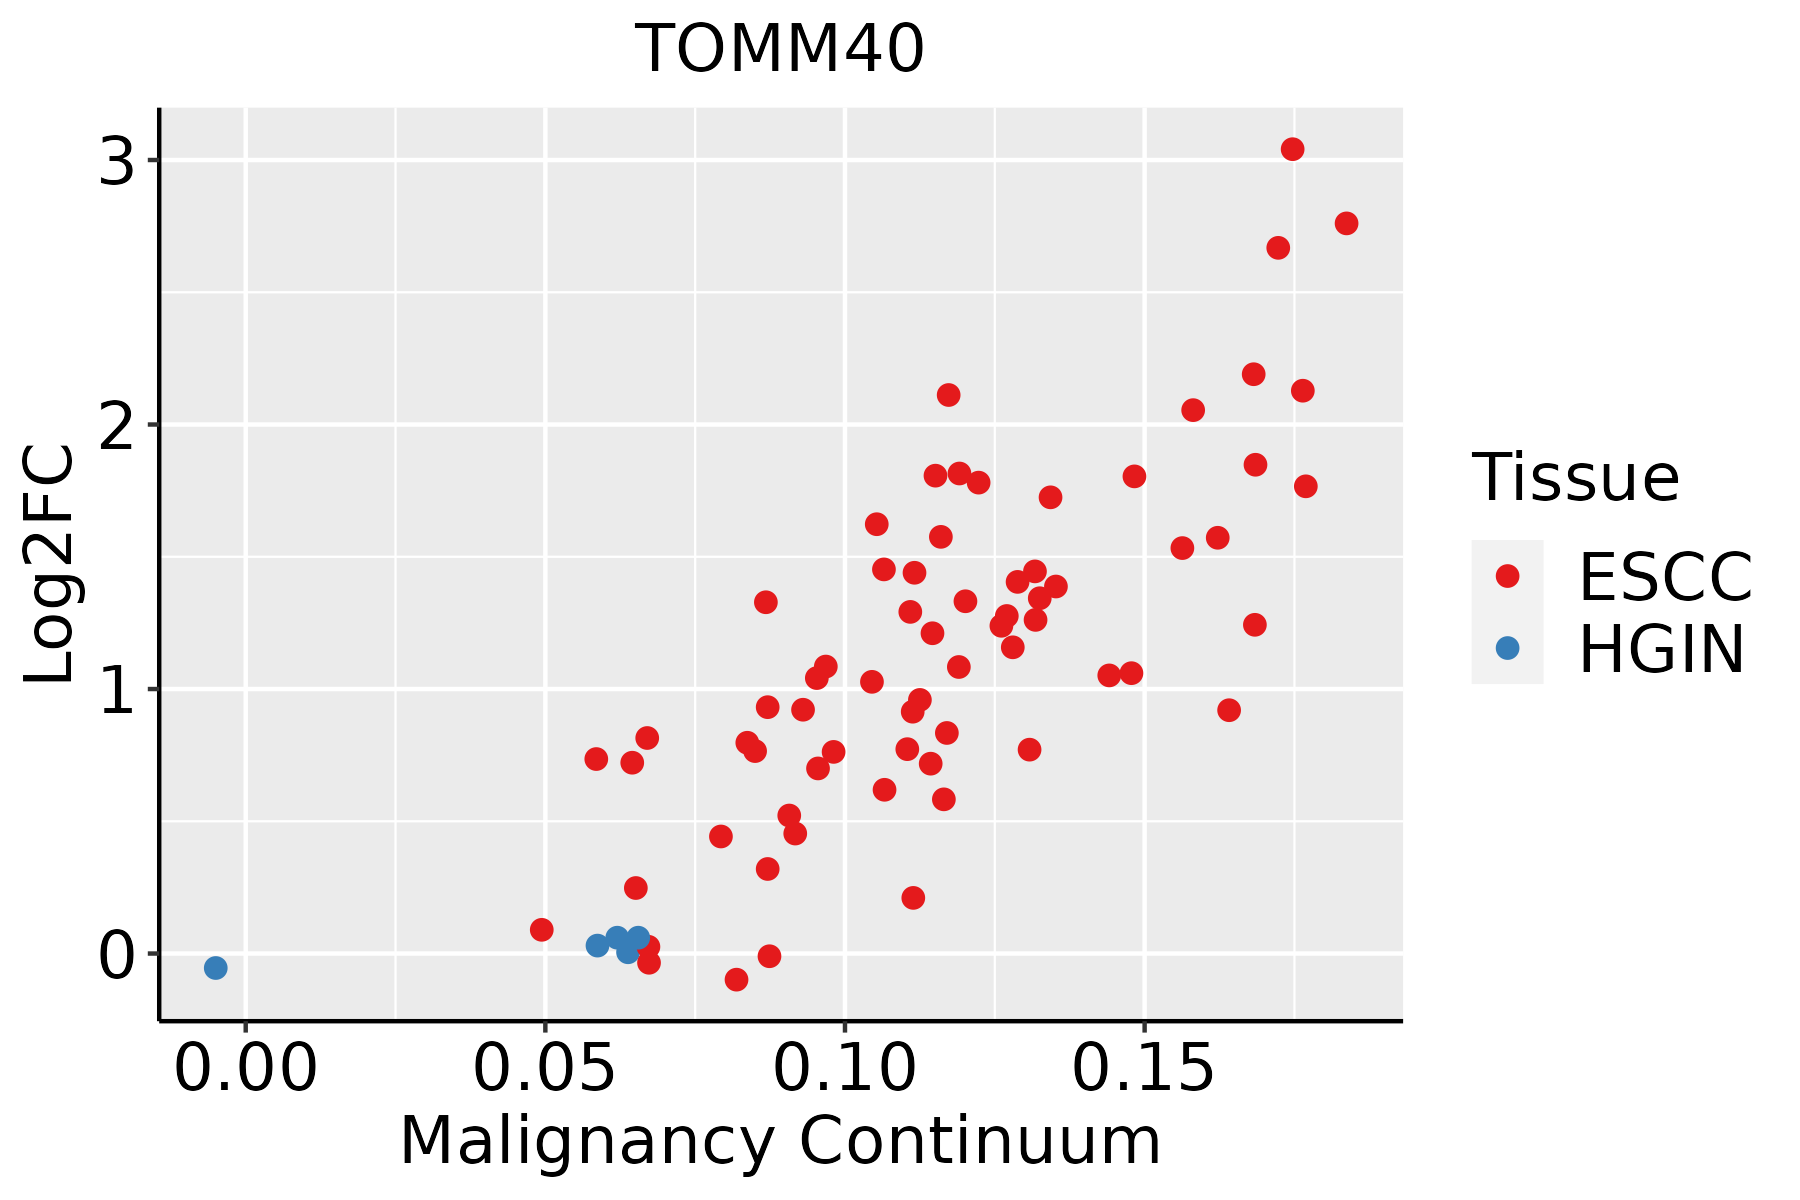 | ESCC: Esophageal squamous cell carcinoma |
| HGIN: High-grade intraepithelial neoplasias |
| LGIN: Low-grade intraepithelial neoplasias |
| Liver | 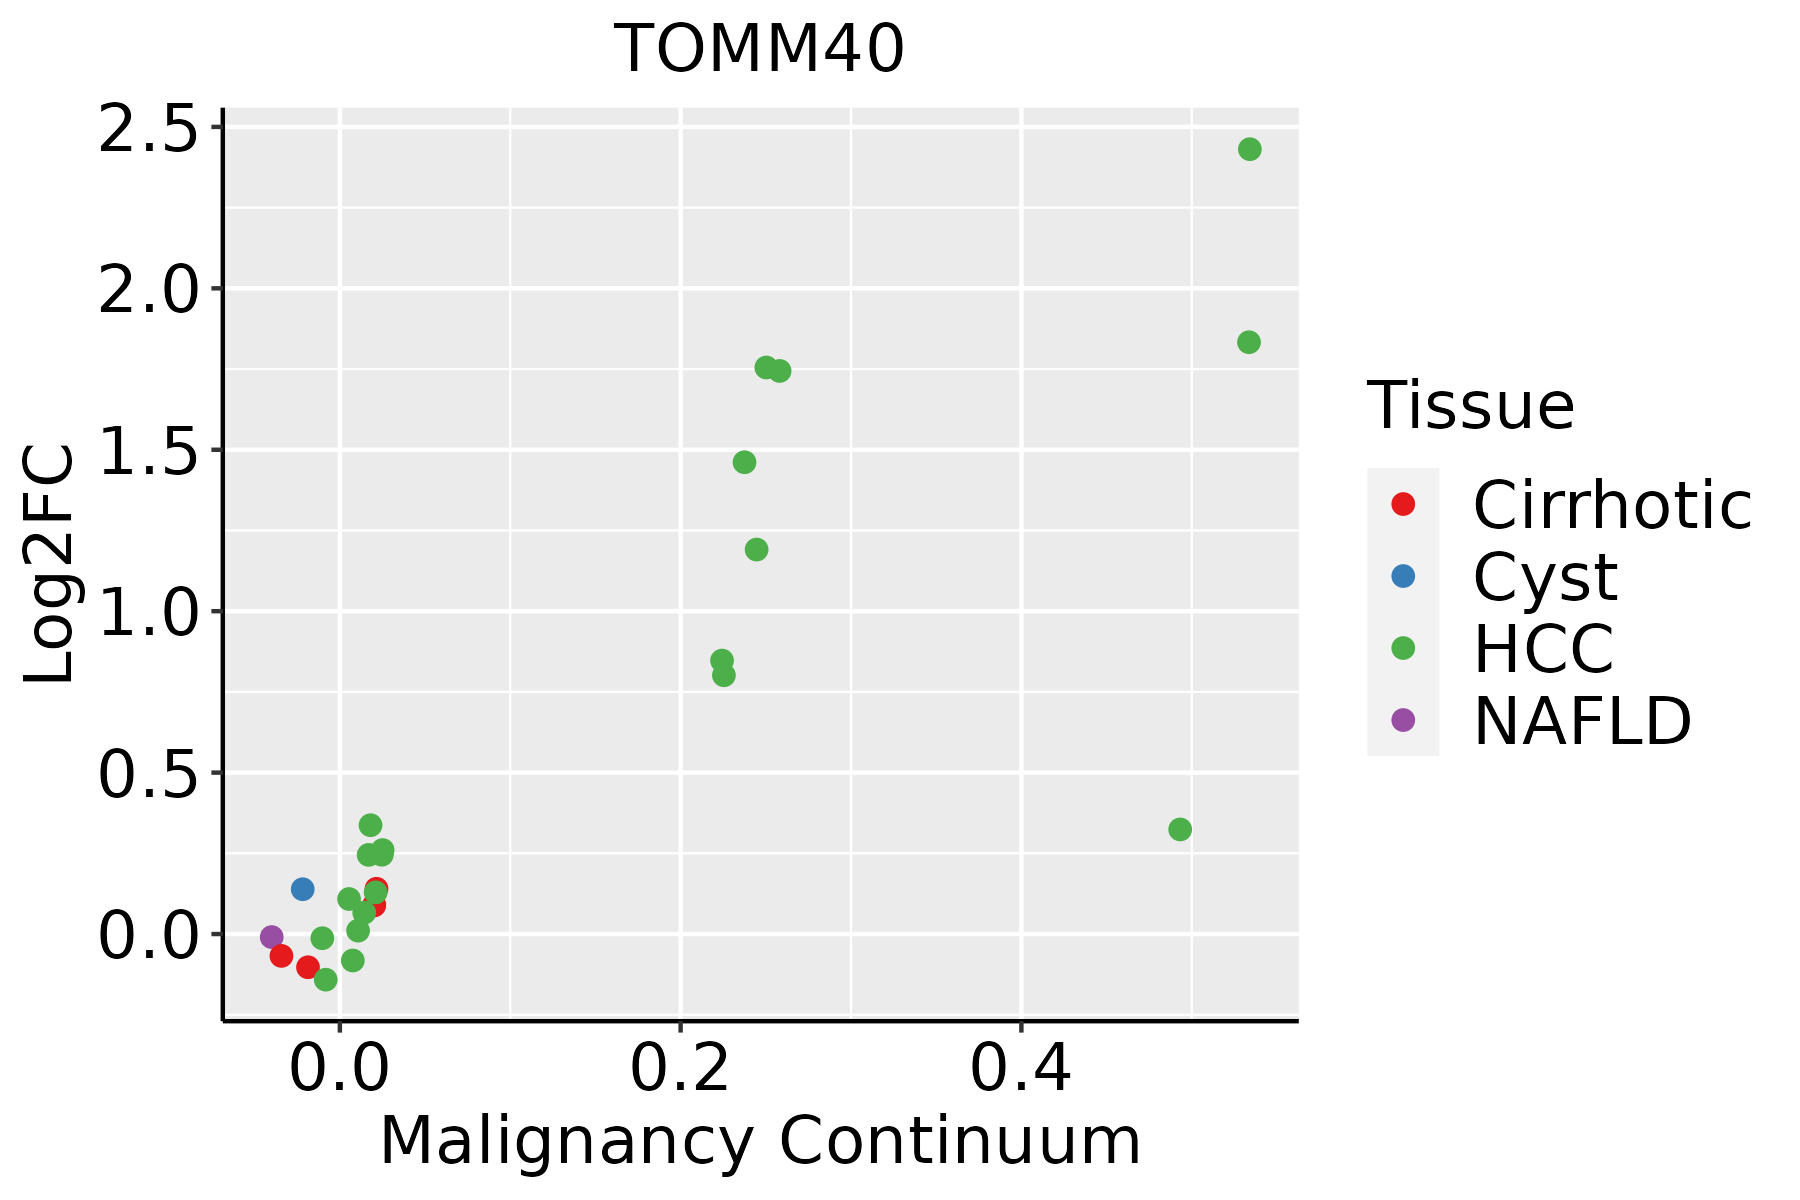 | HCC: Hepatocellular carcinoma |
| NAFLD: Non-alcoholic fatty liver disease |
| Oral Cavity |  | EOLP: Erosive Oral lichen planus |
| LP: leukoplakia |
| NEOLP: Non-erosive oral lichen planus |
| OSCC: Oral squamous cell carcinoma |
| Skin | 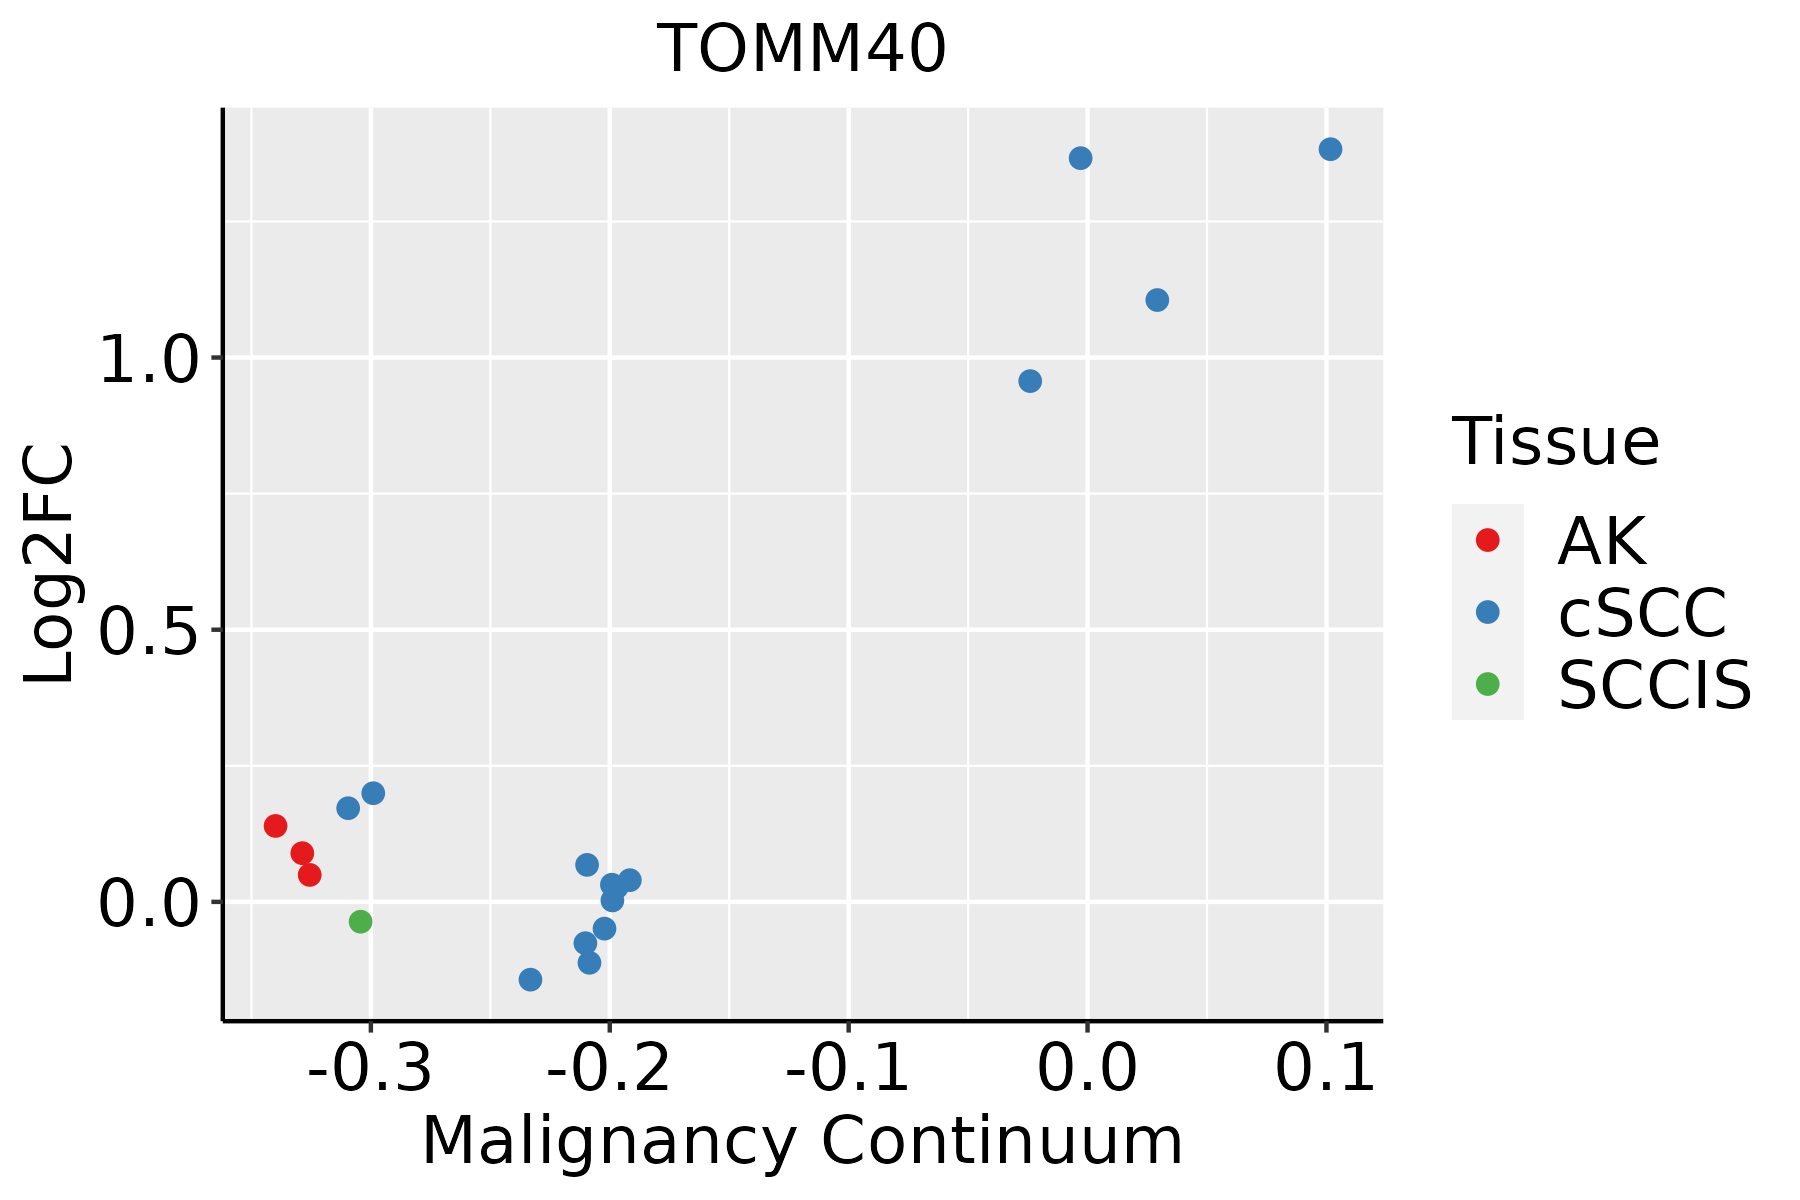 | AK: Actinic keratosis |
| cSCC: Cutaneous squamous cell carcinoma |
| SCCIS:squamous cell carcinoma in situ |
| Thyroid | 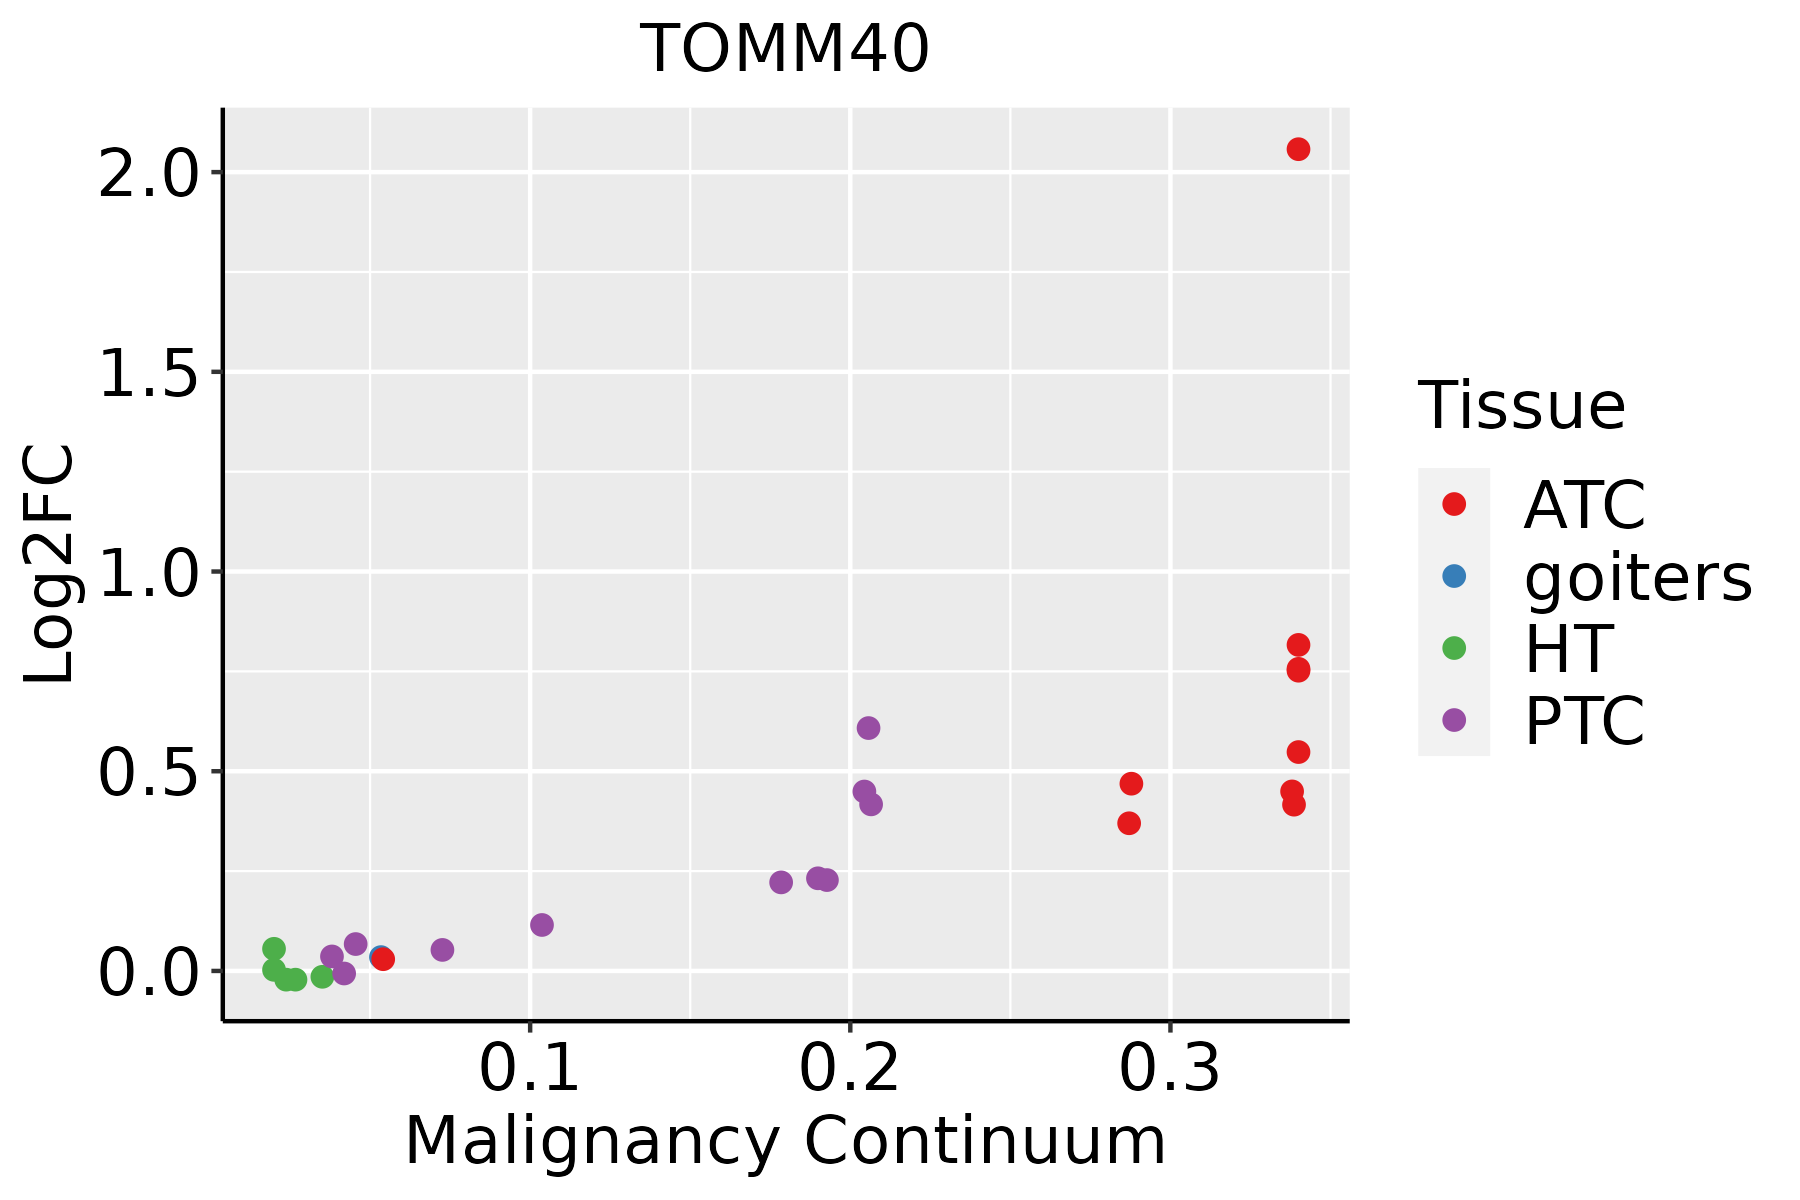 | ATC: Anaplastic thyroid cancer |
| HT: Hashimoto's thyroiditis |
| PTC: Papillary thyroid cancer |
| GO ID | Tissue | Disease Stage | Description | Gene Ratio | Bg Ratio | pvalue | p.adjust | Count |
| GO:0006839 | Colorectum | AD | mitochondrial transport | 102/3918 | 254/18723 | 1.87e-12 | 3.08e-10 | 102 |
| GO:0072594 | Colorectum | AD | establishment of protein localization to organelle | 148/3918 | 422/18723 | 7.95e-12 | 1.04e-09 | 148 |
| GO:1990542 | Colorectum | AD | mitochondrial transmembrane transport | 47/3918 | 102/18723 | 1.09e-08 | 6.52e-07 | 47 |
| GO:0006605 | Colorectum | AD | protein targeting | 105/3918 | 314/18723 | 1.39e-07 | 6.44e-06 | 105 |
| GO:0070585 | Colorectum | AD | protein localization to mitochondrion | 51/3918 | 125/18723 | 3.40e-07 | 1.33e-05 | 51 |
| GO:0072655 | Colorectum | AD | establishment of protein localization to mitochondrion | 47/3918 | 120/18723 | 3.76e-06 | 1.04e-04 | 47 |
| GO:0017038 | Colorectum | AD | protein import | 67/3918 | 206/18723 | 6.34e-05 | 1.05e-03 | 67 |
| GO:0006626 | Colorectum | AD | protein targeting to mitochondrion | 37/3918 | 100/18723 | 1.58e-04 | 2.20e-03 | 37 |
| GO:0071806 | Colorectum | AD | protein transmembrane transport | 21/3918 | 59/18723 | 6.58e-03 | 4.08e-02 | 21 |
| GO:00068391 | Colorectum | SER | mitochondrial transport | 87/2897 | 254/18723 | 7.91e-14 | 3.03e-11 | 87 |
| GO:19905421 | Colorectum | SER | mitochondrial transmembrane transport | 42/2897 | 102/18723 | 3.65e-10 | 4.77e-08 | 42 |
| GO:00725941 | Colorectum | SER | establishment of protein localization to organelle | 111/2897 | 422/18723 | 4.98e-09 | 4.49e-07 | 111 |
| GO:00705851 | Colorectum | SER | protein localization to mitochondrion | 42/2897 | 125/18723 | 3.75e-07 | 1.98e-05 | 42 |
| GO:00726551 | Colorectum | SER | establishment of protein localization to mitochondrion | 38/2897 | 120/18723 | 6.60e-06 | 2.33e-04 | 38 |
| GO:00066051 | Colorectum | SER | protein targeting | 76/2897 | 314/18723 | 3.19e-05 | 8.47e-04 | 76 |
| GO:00066261 | Colorectum | SER | protein targeting to mitochondrion | 31/2897 | 100/18723 | 7.09e-05 | 1.61e-03 | 31 |
| GO:00170381 | Colorectum | SER | protein import | 49/2897 | 206/18723 | 1.12e-03 | 1.29e-02 | 49 |
| GO:00718061 | Colorectum | SER | protein transmembrane transport | 17/2897 | 59/18723 | 6.64e-03 | 4.69e-02 | 17 |
| GO:00725942 | Colorectum | MSS | establishment of protein localization to organelle | 139/3467 | 422/18723 | 5.75e-13 | 1.12e-10 | 139 |
| GO:00068392 | Colorectum | MSS | mitochondrial transport | 93/3467 | 254/18723 | 6.14e-12 | 9.82e-10 | 93 |
| Pathway ID | Tissue | Disease Stage | Description | Gene Ratio | Bg Ratio | pvalue | p.adjust | qvalue | Count |
| hsa05014 | Colorectum | AD | Amyotrophic lateral sclerosis | 164/2092 | 364/8465 | 4.28e-18 | 1.27e-16 | 8.09e-17 | 164 |
| hsa05022 | Colorectum | AD | Pathways of neurodegeneration - multiple diseases | 201/2092 | 476/8465 | 4.54e-18 | 1.27e-16 | 8.09e-17 | 201 |
| hsa050141 | Colorectum | AD | Amyotrophic lateral sclerosis | 164/2092 | 364/8465 | 4.28e-18 | 1.27e-16 | 8.09e-17 | 164 |
| hsa050221 | Colorectum | AD | Pathways of neurodegeneration - multiple diseases | 201/2092 | 476/8465 | 4.54e-18 | 1.27e-16 | 8.09e-17 | 201 |
| hsa050222 | Colorectum | SER | Pathways of neurodegeneration - multiple diseases | 168/1580 | 476/8465 | 6.23e-19 | 2.07e-17 | 1.50e-17 | 168 |
| hsa050142 | Colorectum | SER | Amyotrophic lateral sclerosis | 138/1580 | 364/8465 | 9.89e-19 | 2.99e-17 | 2.17e-17 | 138 |
| hsa050223 | Colorectum | SER | Pathways of neurodegeneration - multiple diseases | 168/1580 | 476/8465 | 6.23e-19 | 2.07e-17 | 1.50e-17 | 168 |
| hsa050143 | Colorectum | SER | Amyotrophic lateral sclerosis | 138/1580 | 364/8465 | 9.89e-19 | 2.99e-17 | 2.17e-17 | 138 |
| hsa050224 | Colorectum | MSS | Pathways of neurodegeneration - multiple diseases | 192/1875 | 476/8465 | 2.79e-20 | 1.04e-18 | 6.36e-19 | 192 |
| hsa050144 | Colorectum | MSS | Amyotrophic lateral sclerosis | 156/1875 | 364/8465 | 1.43e-19 | 4.62e-18 | 2.83e-18 | 156 |
| hsa050225 | Colorectum | MSS | Pathways of neurodegeneration - multiple diseases | 192/1875 | 476/8465 | 2.79e-20 | 1.04e-18 | 6.36e-19 | 192 |
| hsa050145 | Colorectum | MSS | Amyotrophic lateral sclerosis | 156/1875 | 364/8465 | 1.43e-19 | 4.62e-18 | 2.83e-18 | 156 |
| hsa05014210 | Esophagus | ESCC | Amyotrophic lateral sclerosis | 266/4205 | 364/8465 | 1.31e-20 | 2.20e-18 | 1.13e-18 | 266 |
| hsa05022210 | Esophagus | ESCC | Pathways of neurodegeneration - multiple diseases | 318/4205 | 476/8465 | 6.10e-15 | 2.04e-13 | 1.05e-13 | 318 |
| hsa0501438 | Esophagus | ESCC | Amyotrophic lateral sclerosis | 266/4205 | 364/8465 | 1.31e-20 | 2.20e-18 | 1.13e-18 | 266 |
| hsa0502238 | Esophagus | ESCC | Pathways of neurodegeneration - multiple diseases | 318/4205 | 476/8465 | 6.10e-15 | 2.04e-13 | 1.05e-13 | 318 |
| hsa0501414 | Liver | Cirrhotic | Amyotrophic lateral sclerosis | 187/2530 | 364/8465 | 1.56e-18 | 6.50e-17 | 4.01e-17 | 187 |
| hsa0502214 | Liver | Cirrhotic | Pathways of neurodegeneration - multiple diseases | 217/2530 | 476/8465 | 7.30e-14 | 2.03e-12 | 1.25e-12 | 217 |
| hsa0501415 | Liver | Cirrhotic | Amyotrophic lateral sclerosis | 187/2530 | 364/8465 | 1.56e-18 | 6.50e-17 | 4.01e-17 | 187 |
| hsa0502215 | Liver | Cirrhotic | Pathways of neurodegeneration - multiple diseases | 217/2530 | 476/8465 | 7.30e-14 | 2.03e-12 | 1.25e-12 | 217 |
| Hugo Symbol | Variant Class | Variant Classification | dbSNP RS | HGVSc | HGVSp | HGVSp Short | SWISSPROT | BIOTYPE | SIFT | PolyPhen | Tumor Sample Barcode | Tissue | Histology | Sex | Age | Stage | Therapy Types | Drugs | Outcome |
| TOMM40 | SNV | Missense_Mutation | novel | c.919N>A | p.Leu307Met | p.L307M | O96008 | protein_coding | deleterious(0) | possibly_damaging(0.842) | TCGA-AR-A24K-01 | Breast | breast invasive carcinoma | Female | <65 | I/II | Unspecific | Paclitaxel | SD |
| TOMM40 | SNV | Missense_Mutation | | c.788N>C | p.Val263Ala | p.V263A | O96008 | protein_coding | tolerated(1) | benign(0.007) | TCGA-D8-A1XK-01 | Breast | breast invasive carcinoma | Female | <65 | I/II | Chemotherapy | doxorubicine+cyclophosphamide | SD |
| TOMM40 | SNV | Missense_Mutation | | c.295N>C | p.Glu99Gln | p.E99Q | O96008 | protein_coding | deleterious(0) | probably_damaging(0.94) | TCGA-EK-A2PM-01 | Cervix | cervical & endocervical cancer | Female | >=65 | I/II | Unknown | Unknown | SD |
| TOMM40 | SNV | Missense_Mutation | novel | c.745T>G | p.Ser249Ala | p.S249A | O96008 | protein_coding | deleterious(0) | benign(0.264) | TCGA-AG-A02X-01 | Colorectum | rectum adenocarcinoma | Male | >=65 | I/II | Unknown | Unknown | SD |
| TOMM40 | SNV | Missense_Mutation | novel | c.1007N>T | p.Pro336Leu | p.P336L | O96008 | protein_coding | deleterious(0.03) | possibly_damaging(0.905) | TCGA-A5-A1OF-01 | Endometrium | uterine corpus endometrioid carcinoma | Female | <65 | I/II | Unknown | Unknown | SD |
| TOMM40 | SNV | Missense_Mutation | | c.1047G>T | p.Lys349Asn | p.K349N | O96008 | protein_coding | deleterious(0) | possibly_damaging(0.838) | TCGA-BS-A0UF-01 | Endometrium | uterine corpus endometrioid carcinoma | Female | >=65 | I/II | Unknown | Unknown | SD |
| TOMM40 | SNV | Missense_Mutation | novel | c.791N>T | p.Thr264Met | p.T264M | O96008 | protein_coding | tolerated(0.06) | possibly_damaging(0.627) | TCGA-FI-A2D0-01 | Endometrium | uterine corpus endometrioid carcinoma | Female | <65 | I/II | Unknown | Unknown | SD |
| TOMM40 | SNV | Missense_Mutation | novel | c.316N>G | p.Asn106Asp | p.N106D | O96008 | protein_coding | deleterious(0) | probably_damaging(0.978) | TCGA-FI-A2D5-01 | Endometrium | uterine corpus endometrioid carcinoma | Female | <65 | III/IV | Chemotherapy | carboplatinum | PD |
| TOMM40 | SNV | Missense_Mutation | novel | c.298N>C | p.Gly100Arg | p.G100R | O96008 | protein_coding | deleterious(0) | probably_damaging(1) | TCGA-95-7043-01 | Lung | lung adenocarcinoma | Female | <65 | I/II | Unknown | Unknown | PD |
| TOMM40 | SNV | Missense_Mutation | | c.478N>G | p.Leu160Val | p.L160V | O96008 | protein_coding | deleterious(0.04) | possibly_damaging(0.781) | TCGA-66-2789-01 | Lung | lung squamous cell carcinoma | Male | >=65 | III/IV | Unknown | Unknown | SD |


