
|
|||||
|
 | |
| |
| |
| |
| |
| |
|
Gene: TOMM34 |
Gene summary for TOMM34 |
| Gene information | Species | Human | Gene symbol | TOMM34 | Gene ID | 10953 |
| Gene name | translocase of outer mitochondrial membrane 34 | |
| Gene Alias | HTOM34P | |
| Cytomap | 20q13.12 | |
| Gene Type | protein-coding | GO ID | GO:0006605 | UniProtAcc | Q15785 |
Top |
Malignant transformation analysis |
| Identification of the aberrant gene expression in precancerous and cancerous lesions by comparing the gene expression of stem-like cells in diseased tissues with normal stem cells |
| Entrez ID | Symbol | Replicates | Species | Organ | Tissue | Adj P-value | Log2FC | Malignancy |
| 10953 | TOMM34 | HTA11_1391_2000001011 | Human | Colorectum | AD | 3.01e-05 | 3.60e-01 | -0.059 |
| 10953 | TOMM34 | HTA11_866_3004761011 | Human | Colorectum | AD | 5.93e-07 | 3.21e-01 | 0.096 |
| 10953 | TOMM34 | HTA11_99999970781_79442 | Human | Colorectum | MSS | 4.31e-03 | 2.30e-01 | 0.294 |
| 10953 | TOMM34 | HTA11_99999971662_82457 | Human | Colorectum | MSS | 1.35e-45 | 1.10e+00 | 0.3859 |
| 10953 | TOMM34 | HTA11_99999973899_84307 | Human | Colorectum | MSS | 7.60e-12 | 7.01e-01 | 0.2585 |
| 10953 | TOMM34 | HTA11_99999974143_84620 | Human | Colorectum | MSS | 2.46e-17 | 5.02e-01 | 0.3005 |
| 10953 | TOMM34 | LZE4T | Human | Esophagus | ESCC | 3.18e-04 | 1.84e-01 | 0.0811 |
| 10953 | TOMM34 | LZE24T | Human | Esophagus | ESCC | 6.98e-03 | 1.60e-01 | 0.0596 |
| 10953 | TOMM34 | LZE6T | Human | Esophagus | ESCC | 2.55e-03 | 1.75e-01 | 0.0845 |
| 10953 | TOMM34 | P1T-E | Human | Esophagus | ESCC | 5.44e-03 | 2.07e-01 | 0.0875 |
| 10953 | TOMM34 | P2T-E | Human | Esophagus | ESCC | 4.10e-21 | 4.14e-01 | 0.1177 |
| 10953 | TOMM34 | P4T-E | Human | Esophagus | ESCC | 3.39e-15 | 4.59e-01 | 0.1323 |
| 10953 | TOMM34 | P5T-E | Human | Esophagus | ESCC | 2.51e-14 | 2.62e-01 | 0.1327 |
| 10953 | TOMM34 | P8T-E | Human | Esophagus | ESCC | 1.85e-14 | 3.23e-01 | 0.0889 |
| 10953 | TOMM34 | P9T-E | Human | Esophagus | ESCC | 6.64e-13 | 1.66e-01 | 0.1131 |
| 10953 | TOMM34 | P10T-E | Human | Esophagus | ESCC | 1.54e-25 | 4.72e-01 | 0.116 |
| 10953 | TOMM34 | P11T-E | Human | Esophagus | ESCC | 3.93e-09 | 3.35e-01 | 0.1426 |
| 10953 | TOMM34 | P12T-E | Human | Esophagus | ESCC | 5.25e-23 | 5.08e-01 | 0.1122 |
| 10953 | TOMM34 | P15T-E | Human | Esophagus | ESCC | 9.60e-18 | 3.84e-01 | 0.1149 |
| 10953 | TOMM34 | P16T-E | Human | Esophagus | ESCC | 6.44e-31 | 7.22e-01 | 0.1153 |
| Page: 1 2 3 4 5 |
| Tissue | Expression Dynamics | Abbreviation |
| Colorectum (GSE201348) |  | FAP: Familial adenomatous polyposis |
| CRC: Colorectal cancer | ||
| Colorectum (HTA11) |  | AD: Adenomas |
| SER: Sessile serrated lesions | ||
| MSI-H: Microsatellite-high colorectal cancer | ||
| MSS: Microsatellite stable colorectal cancer | ||
| Esophagus | 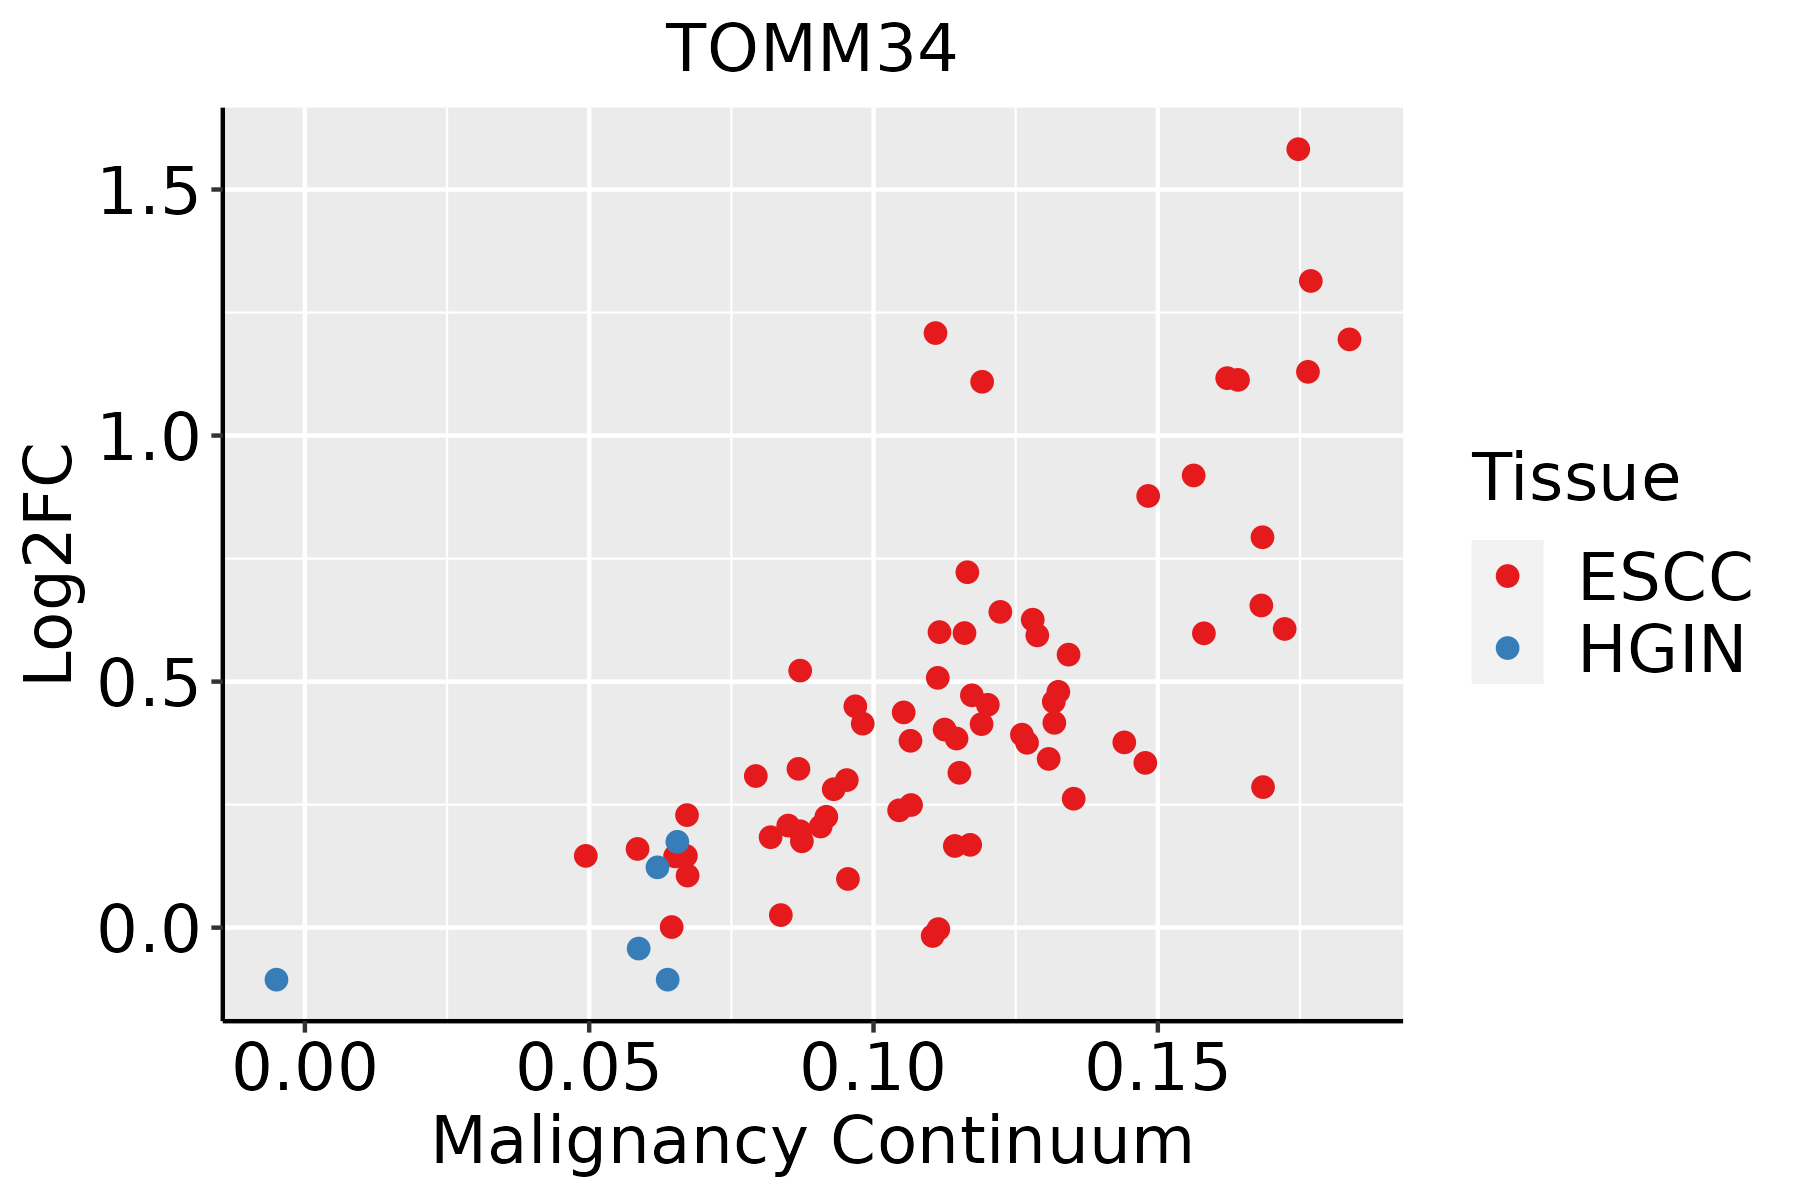 | ESCC: Esophageal squamous cell carcinoma |
| HGIN: High-grade intraepithelial neoplasias | ||
| LGIN: Low-grade intraepithelial neoplasias | ||
| Liver | 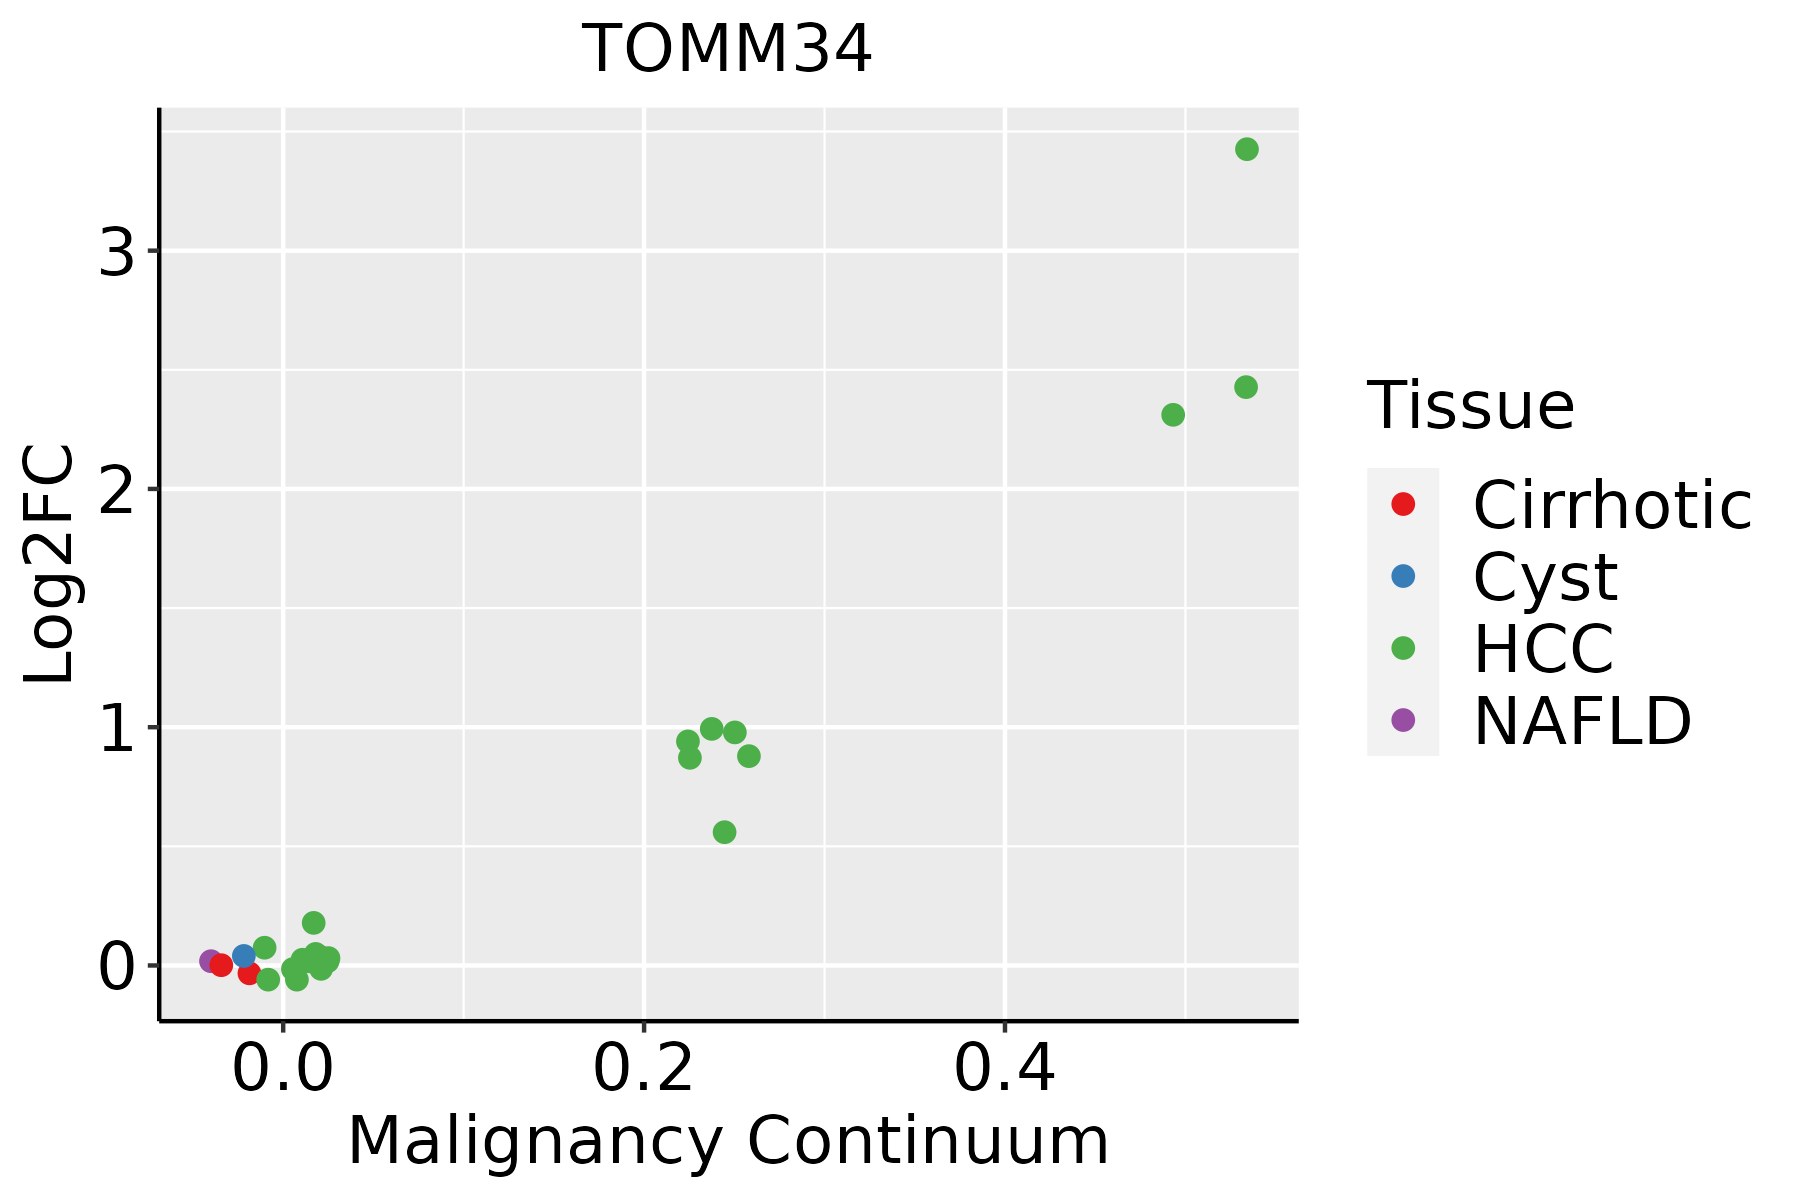 | HCC: Hepatocellular carcinoma |
| NAFLD: Non-alcoholic fatty liver disease | ||
| Oral Cavity | 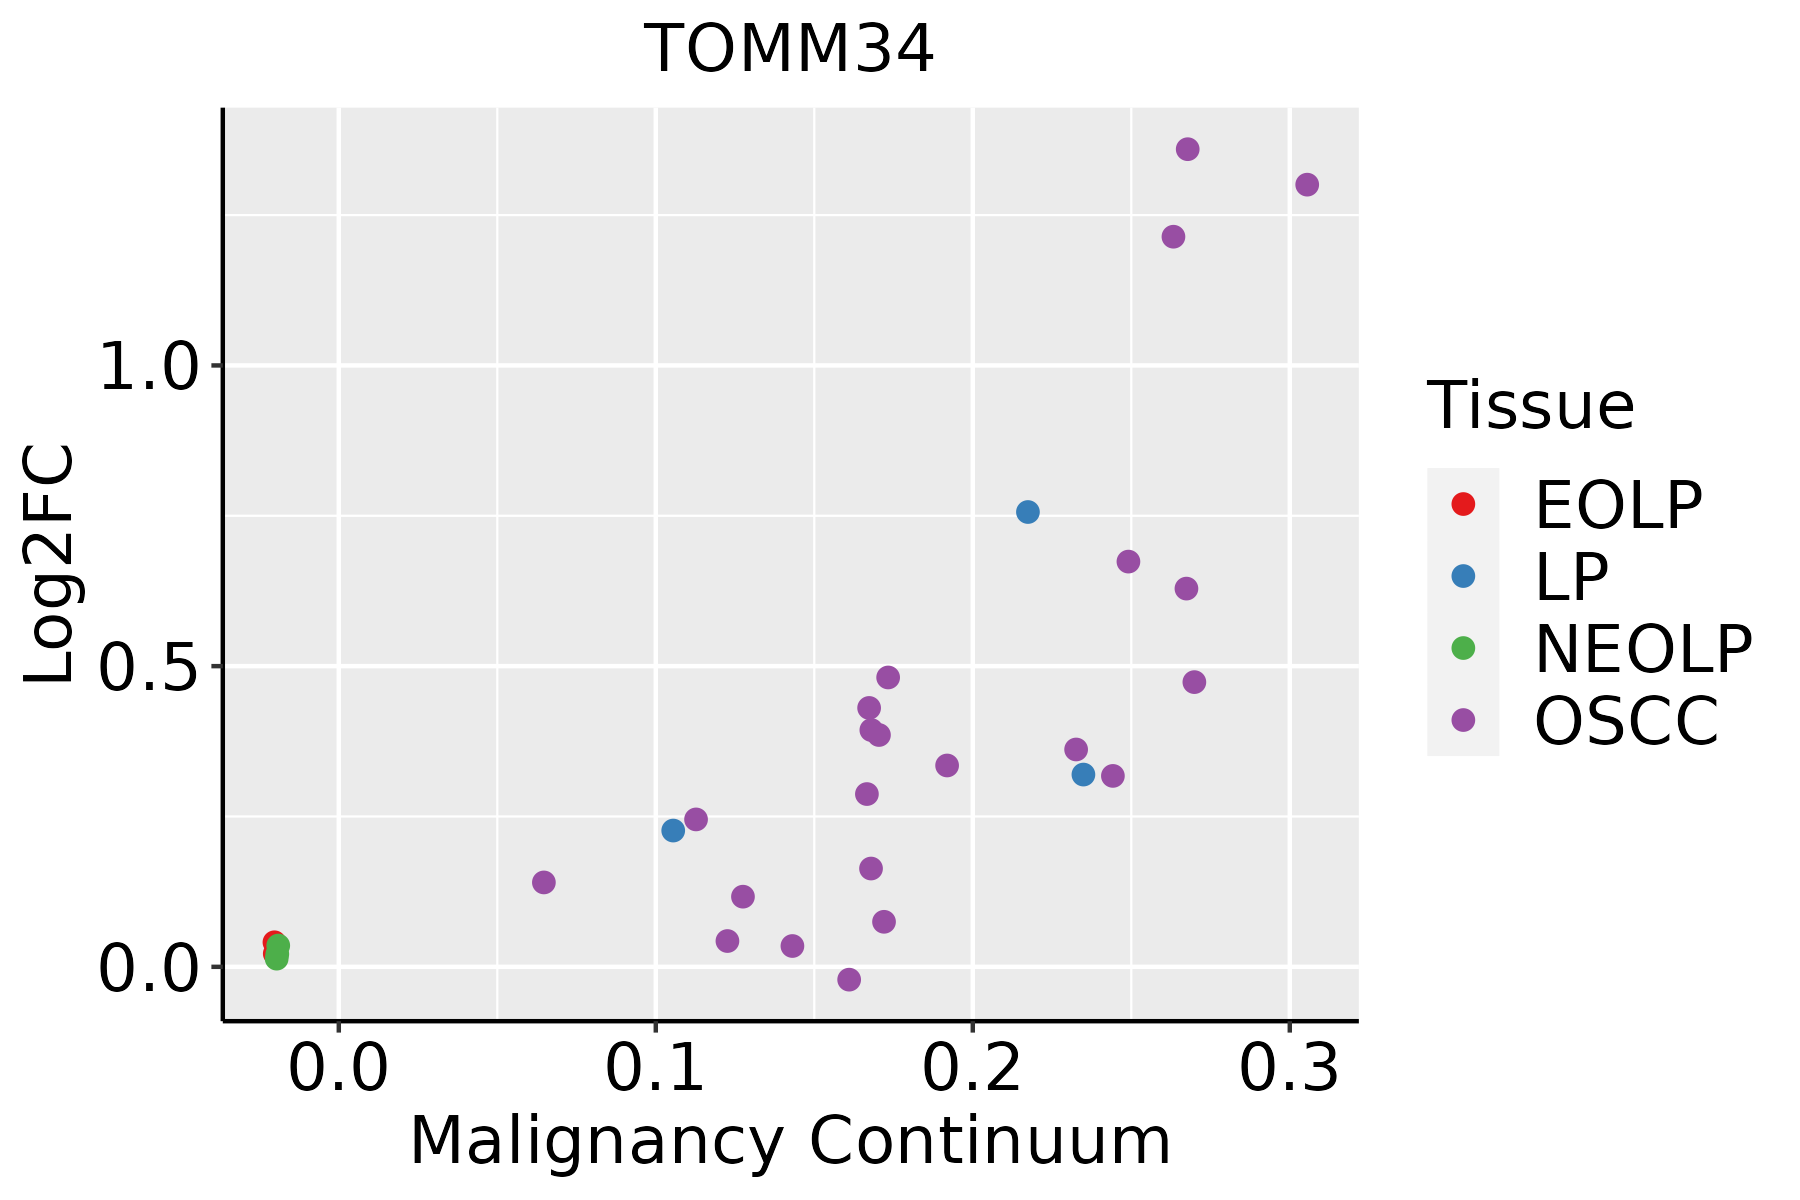 | EOLP: Erosive Oral lichen planus |
| LP: leukoplakia | ||
| NEOLP: Non-erosive oral lichen planus | ||
| OSCC: Oral squamous cell carcinoma |
| ∗log2FC in expression of this searched gene in stem-like cells from each diseased tissue sample relative to stem-like cells in normal samples in each tissue plotted against the malignancy continuum. Samples are colored based on if they are from different disease stage. |
Top |
Malignant transformation related pathway analysis |
| Find out the enriched GO biological processes and KEGG pathways involved in transition from healthy to precancer to cancer |
| Tissue | Disease Stage | Enriched GO biological Processes |
| Colorectum | AD |  |
| Colorectum | SER |  |
| Colorectum | MSS |  |
| Colorectum | MSI-H |  |
| Colorectum | FAP |  |
| ∗Top 15 enriched GO BP terms are showed in the bar plot of each disease state in each tissue. Each row represents a significant GO biological process which is colored according to the -log10(p.adjust). |
| Page: 1 2 3 4 5 6 7 8 9 |
| GO ID | Tissue | Disease Stage | Description | Gene Ratio | Bg Ratio | pvalue | p.adjust | Count |
| GO:0006839 | Colorectum | AD | mitochondrial transport | 102/3918 | 254/18723 | 1.87e-12 | 3.08e-10 | 102 |
| GO:0072594 | Colorectum | AD | establishment of protein localization to organelle | 148/3918 | 422/18723 | 7.95e-12 | 1.04e-09 | 148 |
| GO:0006605 | Colorectum | AD | protein targeting | 105/3918 | 314/18723 | 1.39e-07 | 6.44e-06 | 105 |
| GO:0070585 | Colorectum | AD | protein localization to mitochondrion | 51/3918 | 125/18723 | 3.40e-07 | 1.33e-05 | 51 |
| GO:0072655 | Colorectum | AD | establishment of protein localization to mitochondrion | 47/3918 | 120/18723 | 3.76e-06 | 1.04e-04 | 47 |
| GO:0006626 | Colorectum | AD | protein targeting to mitochondrion | 37/3918 | 100/18723 | 1.58e-04 | 2.20e-03 | 37 |
| GO:00725942 | Colorectum | MSS | establishment of protein localization to organelle | 139/3467 | 422/18723 | 5.75e-13 | 1.12e-10 | 139 |
| GO:00068392 | Colorectum | MSS | mitochondrial transport | 93/3467 | 254/18723 | 6.14e-12 | 9.82e-10 | 93 |
| GO:00066052 | Colorectum | MSS | protein targeting | 97/3467 | 314/18723 | 6.76e-08 | 3.46e-06 | 97 |
| GO:00705852 | Colorectum | MSS | protein localization to mitochondrion | 47/3467 | 125/18723 | 3.98e-07 | 1.58e-05 | 47 |
| GO:00726552 | Colorectum | MSS | establishment of protein localization to mitochondrion | 44/3467 | 120/18723 | 2.03e-06 | 6.28e-05 | 44 |
| GO:00066262 | Colorectum | MSS | protein targeting to mitochondrion | 36/3467 | 100/18723 | 2.65e-05 | 5.46e-04 | 36 |
| GO:0072594110 | Esophagus | ESCC | establishment of protein localization to organelle | 311/8552 | 422/18723 | 3.02e-32 | 2.13e-29 | 311 |
| GO:0006605111 | Esophagus | ESCC | protein targeting | 229/8552 | 314/18723 | 4.93e-23 | 1.01e-20 | 229 |
| GO:0006839110 | Esophagus | ESCC | mitochondrial transport | 187/8552 | 254/18723 | 8.35e-20 | 9.81e-18 | 187 |
| GO:0072655110 | Esophagus | ESCC | establishment of protein localization to mitochondrion | 97/8552 | 120/18723 | 2.17e-15 | 1.33e-13 | 97 |
| GO:0070585110 | Esophagus | ESCC | protein localization to mitochondrion | 100/8552 | 125/18723 | 2.96e-15 | 1.77e-13 | 100 |
| GO:0006626110 | Esophagus | ESCC | protein targeting to mitochondrion | 81/8552 | 100/18723 | 3.60e-13 | 1.67e-11 | 81 |
| GO:007259422 | Liver | HCC | establishment of protein localization to organelle | 299/7958 | 422/18723 | 1.06e-32 | 6.10e-30 | 299 |
| GO:000660512 | Liver | HCC | protein targeting | 219/7958 | 314/18723 | 7.74e-23 | 1.49e-20 | 219 |
| Page: 1 2 |
| Pathway ID | Tissue | Disease Stage | Description | Gene Ratio | Bg Ratio | pvalue | p.adjust | qvalue | Count |
| Page: 1 |
Top |
Cell-cell communication analysis |
| Identification of potential cell-cell interactions between two cell types and their ligand-receptor pairs for different disease states |
| Ligand | Receptor | LRpair | Pathway | Tissue | Disease Stage |
| Page: 1 |
Top |
Single-cell gene regulatory network inference analysis |
| Find out the significant the regulons (TFs) and the target genes of each regulon across cell types for different disease states |
| TF | Cell Type | Tissue | Disease Stage | Target Gene | RSS | Regulon Activity |
| ∗The dot plots of a searched regulon are shown for all cell subpopulations in each disease state of each tissue based on the regulon specific score inferred using pySCENIC and by calculating the average expression. |
| Page: 1 |
Top |
Somatic mutation of malignant transformation related genes |
| Annotation of somatic variants for genes involved in malignant transformation |
| Hugo Symbol | Variant Class | Variant Classification | dbSNP RS | HGVSc | HGVSp | HGVSp Short | SWISSPROT | BIOTYPE | SIFT | PolyPhen | Tumor Sample Barcode | Tissue | Histology | Sex | Age | Stage | Therapy Types | Drugs | Outcome |
| TOMM34 | SNV | Missense_Mutation | c.148N>A | p.Glu50Lys | p.E50K | Q15785 | protein_coding | deleterious(0.03) | benign(0.047) | TCGA-B6-A0WZ-01 | Breast | breast invasive carcinoma | Female | <65 | I/II | Unknown | Unknown | PD | |
| TOMM34 | SNV | Missense_Mutation | novel | c.203N>A | p.Arg68Lys | p.R68K | Q15785 | protein_coding | tolerated(0.08) | benign(0.003) | TCGA-FU-A40J-01 | Cervix | cervical & endocervical cancer | Female | <65 | III/IV | Chemotherapy | carboplatin | CR |
| TOMM34 | SNV | Missense_Mutation | c.557N>G | p.Ser186Cys | p.S186C | Q15785 | protein_coding | deleterious(0.03) | possibly_damaging(0.628) | TCGA-IR-A3LK-01 | Cervix | cervical & endocervical cancer | Female | >=65 | I/II | Chemotherapy | cisplatin | PD | |
| TOMM34 | SNV | Missense_Mutation | c.415N>C | p.Glu139Gln | p.E139Q | Q15785 | protein_coding | tolerated(0.13) | benign(0.003) | TCGA-Q1-A73O-01 | Cervix | cervical & endocervical cancer | Female | <65 | I/II | Chemotherapy | cisplatin | CR | |
| TOMM34 | SNV | Missense_Mutation | novel | c.502N>A | p.Glu168Lys | p.E168K | Q15785 | protein_coding | tolerated(0.33) | benign(0.001) | TCGA-VS-A958-01 | Cervix | cervical & endocervical cancer | Female | <65 | I/II | Chemotherapy | cisplatin | CR |
| TOMM34 | SNV | Missense_Mutation | c.262N>G | p.Leu88Val | p.L88V | Q15785 | protein_coding | deleterious(0) | benign(0.262) | TCGA-ZJ-AAXU-01 | Cervix | cervical & endocervical cancer | Female | <65 | I/II | Unknown | Unknown | SD | |
| TOMM34 | SNV | Missense_Mutation | rs756307089 | c.422N>T | p.Arg141Leu | p.R141L | Q15785 | protein_coding | deleterious(0) | probably_damaging(0.998) | TCGA-AA-3697-01 | Colorectum | colon adenocarcinoma | Male | >=65 | I/II | Unknown | Unknown | SD |
| TOMM34 | SNV | Missense_Mutation | c.262N>A | p.Leu88Met | p.L88M | Q15785 | protein_coding | deleterious(0) | probably_damaging(0.977) | TCGA-AA-3844-01 | Colorectum | colon adenocarcinoma | Female | >=65 | III/IV | Chemotherapy | capecitabine | PD | |
| TOMM34 | SNV | Missense_Mutation | c.897G>T | p.Lys299Asn | p.K299N | Q15785 | protein_coding | tolerated(0.07) | benign(0.012) | TCGA-AA-A010-01 | Colorectum | colon adenocarcinoma | Female | <65 | I/II | Chemotherapy | folinic | CR | |
| TOMM34 | SNV | Missense_Mutation | c.492N>T | p.Glu164Asp | p.E164D | Q15785 | protein_coding | tolerated(0.45) | benign(0) | TCGA-AZ-4315-01 | Colorectum | colon adenocarcinoma | Male | <65 | I/II | Unknown | Unknown | SD |
| Page: 1 2 3 4 |
Top |
Related drugs of malignant transformation related genes |
| Identification of chemicals and drugs interact with genes involved in malignant transfromation |
| (DGIdb 4.0) |
| Entrez ID | Symbol | Category | Interaction Types | Drug Claim Name | Drug Name | PMIDs |
| Page: 1 |

Copyright 2023-Present -The University of Texas Health Science Center at Houston |