
|
|||||
|
 | |
| |
| |
| |
| |
| |
|
Gene: TOMM22 |
Gene summary for TOMM22 |
| Gene information | Species | Human | Gene symbol | TOMM22 | Gene ID | 56993 |
| Gene name | translocase of outer mitochondrial membrane 22 | |
| Gene Alias | 1C9-2 | |
| Cytomap | 22q13.1 | |
| Gene Type | protein-coding | GO ID | GO:0006605 | UniProtAcc | Q549C5 |
Top |
Malignant transformation analysis |
| Identification of the aberrant gene expression in precancerous and cancerous lesions by comparing the gene expression of stem-like cells in diseased tissues with normal stem cells |
| Entrez ID | Symbol | Replicates | Species | Organ | Tissue | Adj P-value | Log2FC | Malignancy |
| 56993 | TOMM22 | HTA11_3410_2000001011 | Human | Colorectum | AD | 6.88e-14 | 3.32e-01 | 0.0155 |
| 56993 | TOMM22 | HTA11_2487_2000001011 | Human | Colorectum | SER | 7.23e-23 | 6.10e-01 | -0.1808 |
| 56993 | TOMM22 | HTA11_1938_2000001011 | Human | Colorectum | AD | 9.22e-26 | 8.37e-01 | -0.0811 |
| 56993 | TOMM22 | HTA11_78_2000001011 | Human | Colorectum | AD | 7.96e-22 | 5.70e-01 | -0.1088 |
| 56993 | TOMM22 | HTA11_347_2000001011 | Human | Colorectum | AD | 3.07e-38 | 7.89e-01 | -0.1954 |
| 56993 | TOMM22 | HTA11_411_2000001011 | Human | Colorectum | SER | 5.78e-08 | 6.87e-01 | -0.2602 |
| 56993 | TOMM22 | HTA11_2112_2000001011 | Human | Colorectum | SER | 1.59e-04 | 6.28e-01 | -0.2196 |
| 56993 | TOMM22 | HTA11_3361_2000001011 | Human | Colorectum | AD | 3.50e-13 | 5.41e-01 | -0.1207 |
| 56993 | TOMM22 | HTA11_83_2000001011 | Human | Colorectum | SER | 9.95e-18 | 6.54e-01 | -0.1526 |
| 56993 | TOMM22 | HTA11_696_2000001011 | Human | Colorectum | AD | 3.92e-24 | 5.52e-01 | -0.1464 |
| 56993 | TOMM22 | HTA11_866_2000001011 | Human | Colorectum | AD | 1.96e-15 | 4.47e-01 | -0.1001 |
| 56993 | TOMM22 | HTA11_1391_2000001011 | Human | Colorectum | AD | 4.04e-34 | 9.76e-01 | -0.059 |
| 56993 | TOMM22 | HTA11_2992_2000001011 | Human | Colorectum | SER | 1.84e-07 | 5.34e-01 | -0.1706 |
| 56993 | TOMM22 | HTA11_5212_2000001011 | Human | Colorectum | AD | 1.13e-07 | 4.28e-01 | -0.2061 |
| 56993 | TOMM22 | HTA11_5216_2000001011 | Human | Colorectum | SER | 2.79e-11 | 5.99e-01 | -0.1462 |
| 56993 | TOMM22 | HTA11_546_2000001011 | Human | Colorectum | AD | 3.05e-08 | 4.62e-01 | -0.0842 |
| 56993 | TOMM22 | HTA11_9341_2000001011 | Human | Colorectum | SER | 3.94e-07 | 5.38e-01 | -0.00410000000000005 |
| 56993 | TOMM22 | HTA11_7862_2000001011 | Human | Colorectum | AD | 2.15e-20 | 8.81e-01 | -0.0179 |
| 56993 | TOMM22 | HTA11_866_3004761011 | Human | Colorectum | AD | 9.36e-35 | 8.81e-01 | 0.096 |
| 56993 | TOMM22 | HTA11_4255_2000001011 | Human | Colorectum | SER | 6.82e-09 | 8.05e-01 | 0.0446 |
| Page: 1 2 3 4 5 6 7 8 9 10 |
| Tissue | Expression Dynamics | Abbreviation |
| Colorectum (GSE201348) |  | FAP: Familial adenomatous polyposis |
| CRC: Colorectal cancer | ||
| Colorectum (HTA11) | 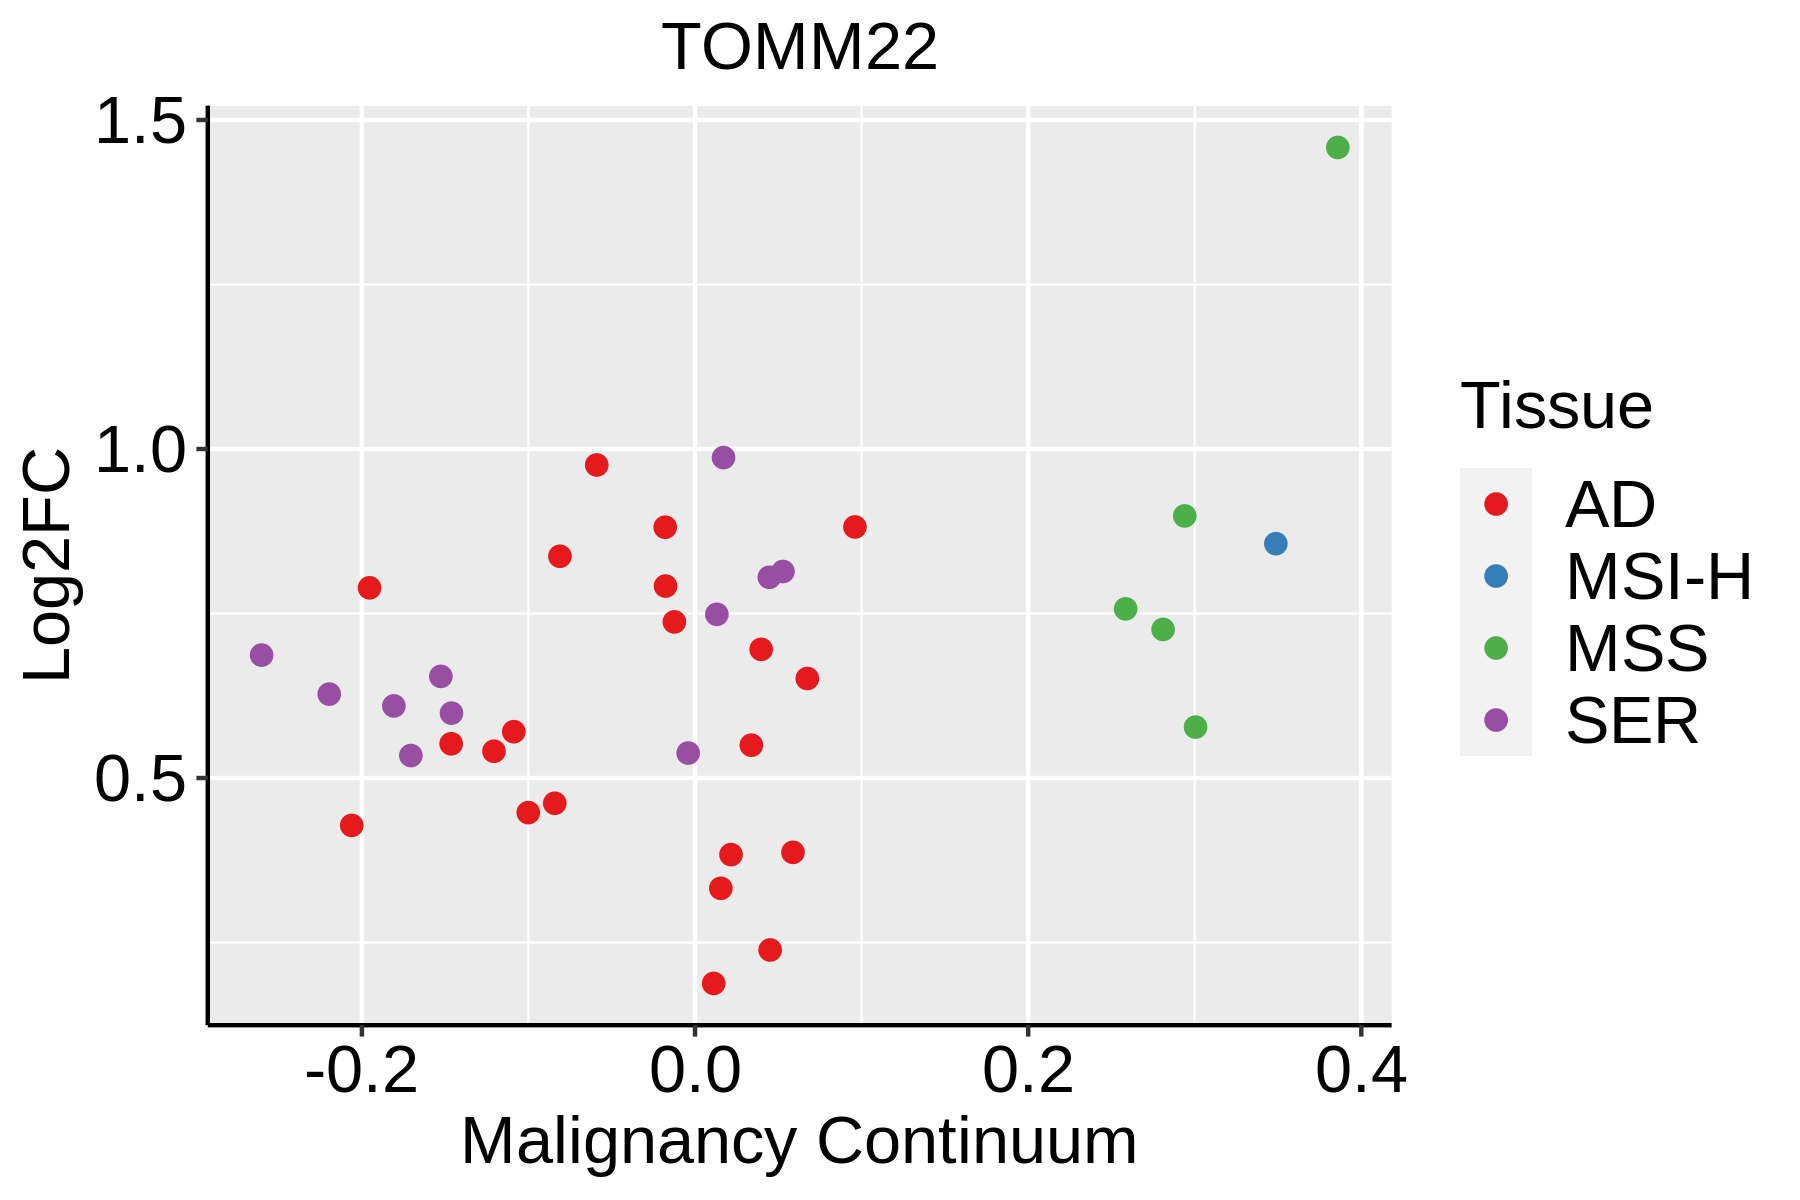 | AD: Adenomas |
| SER: Sessile serrated lesions | ||
| MSI-H: Microsatellite-high colorectal cancer | ||
| MSS: Microsatellite stable colorectal cancer | ||
| Endometrium | 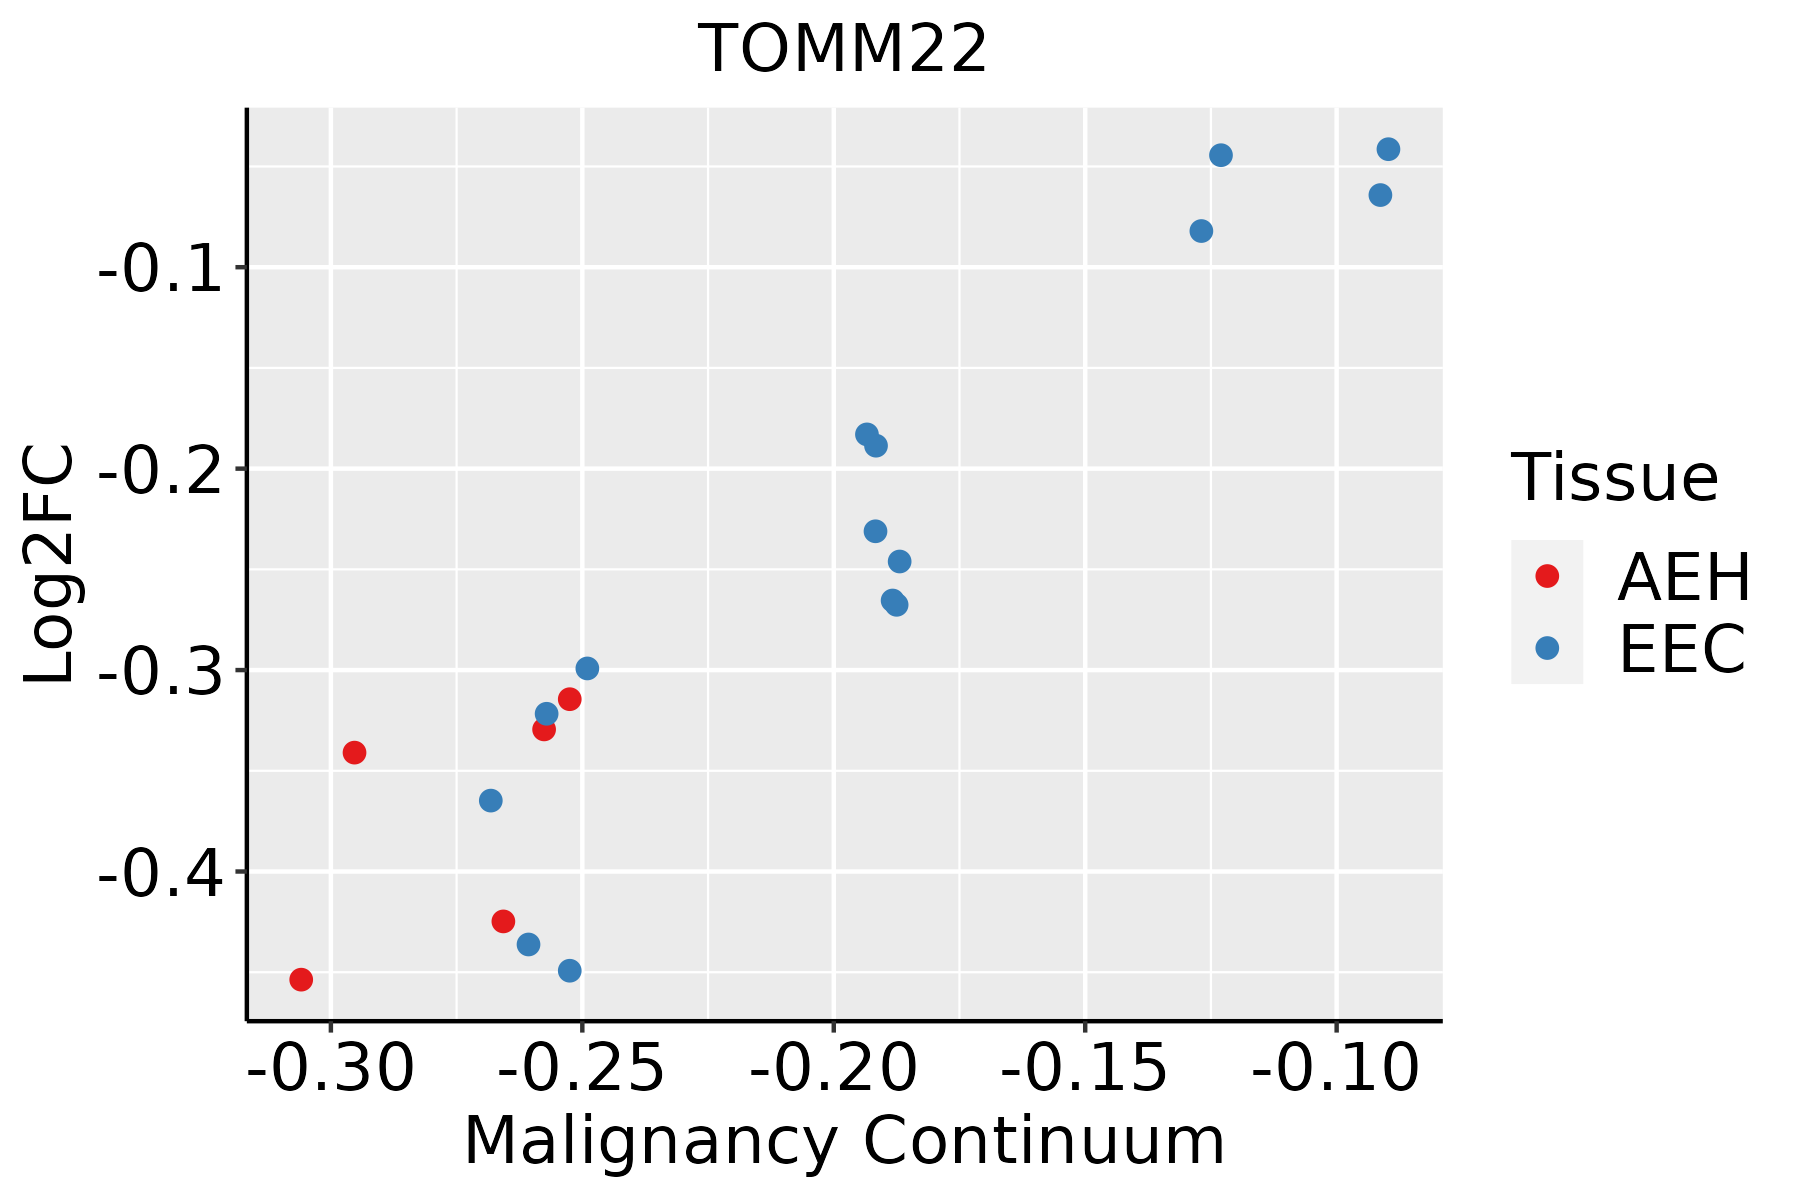 | AEH: Atypical endometrial hyperplasia |
| EEC: Endometrioid Cancer | ||
| Esophagus |  | ESCC: Esophageal squamous cell carcinoma |
| HGIN: High-grade intraepithelial neoplasias | ||
| LGIN: Low-grade intraepithelial neoplasias | ||
| Liver | 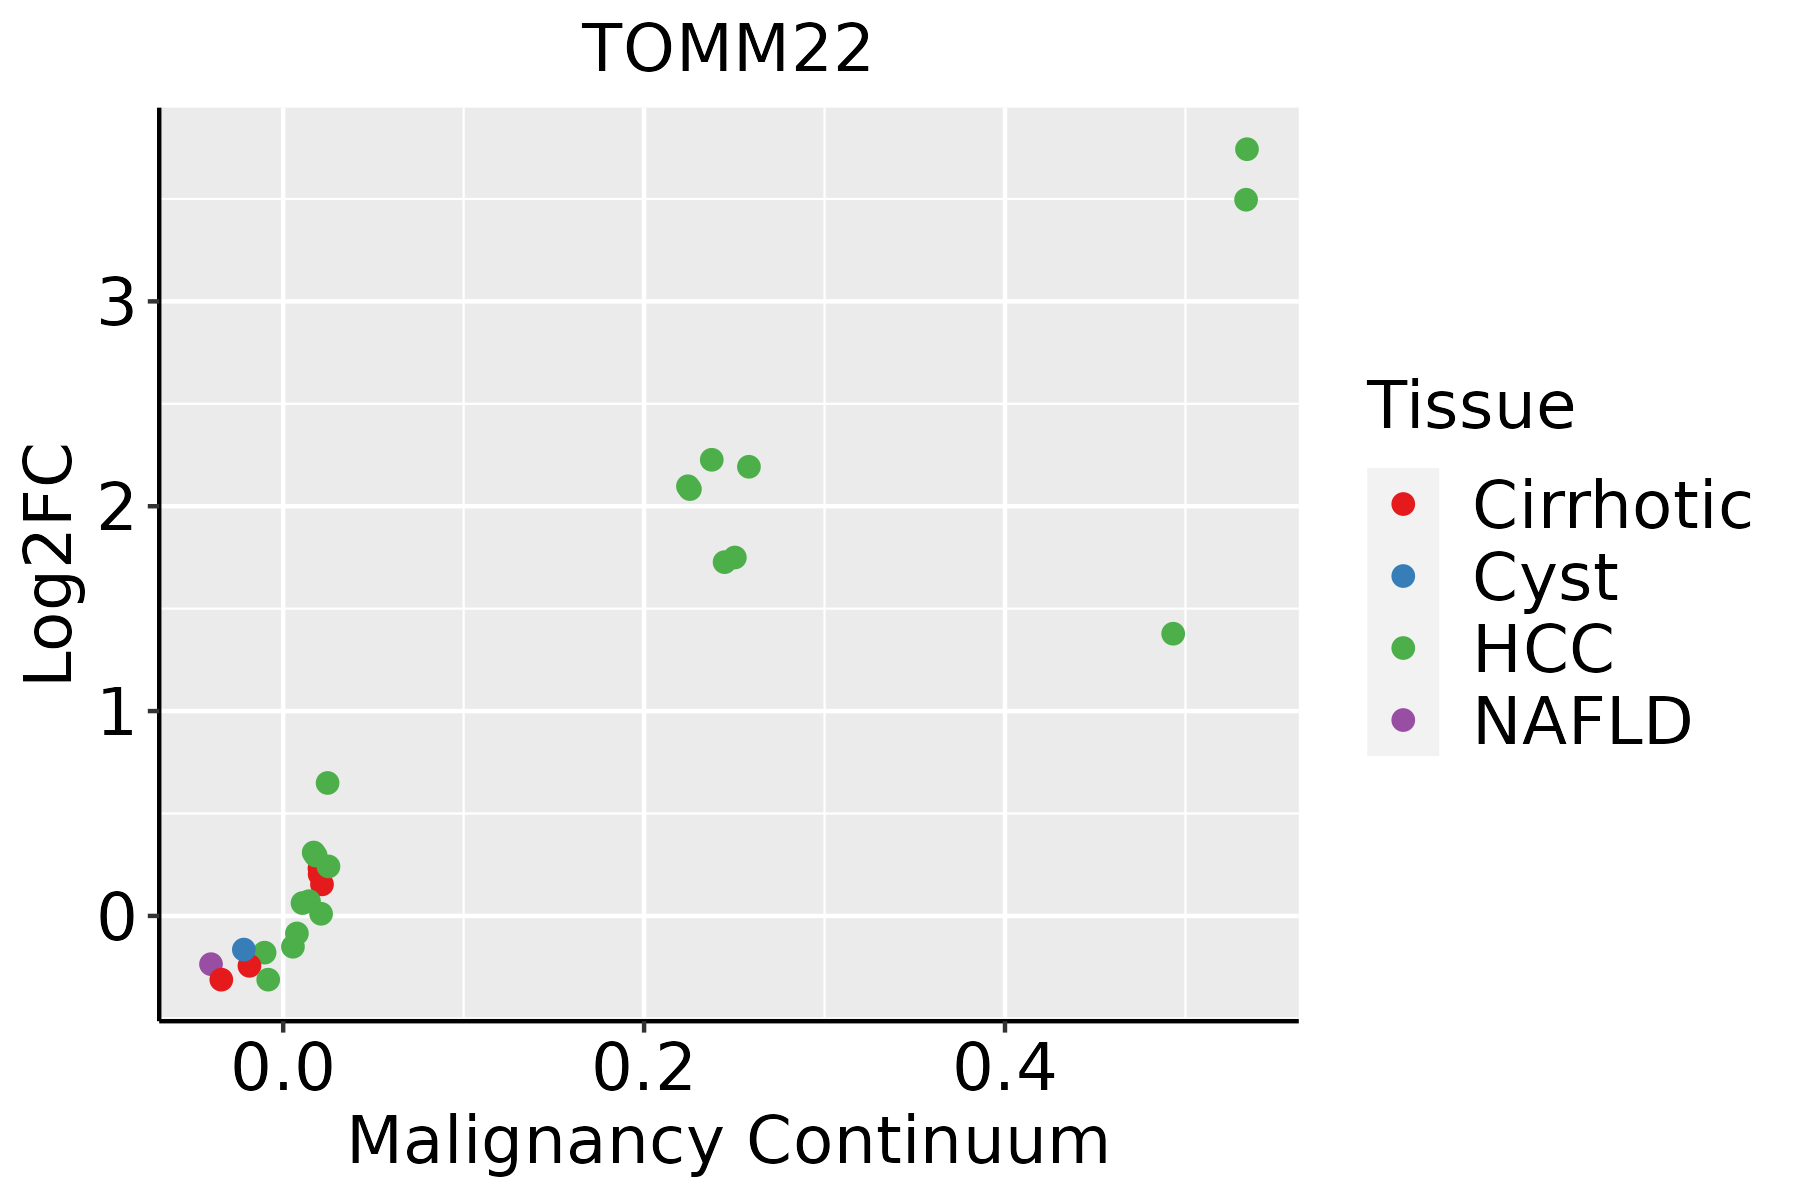 | HCC: Hepatocellular carcinoma |
| NAFLD: Non-alcoholic fatty liver disease | ||
| Oral Cavity |  | EOLP: Erosive Oral lichen planus |
| LP: leukoplakia | ||
| NEOLP: Non-erosive oral lichen planus | ||
| OSCC: Oral squamous cell carcinoma | ||
| Skin | 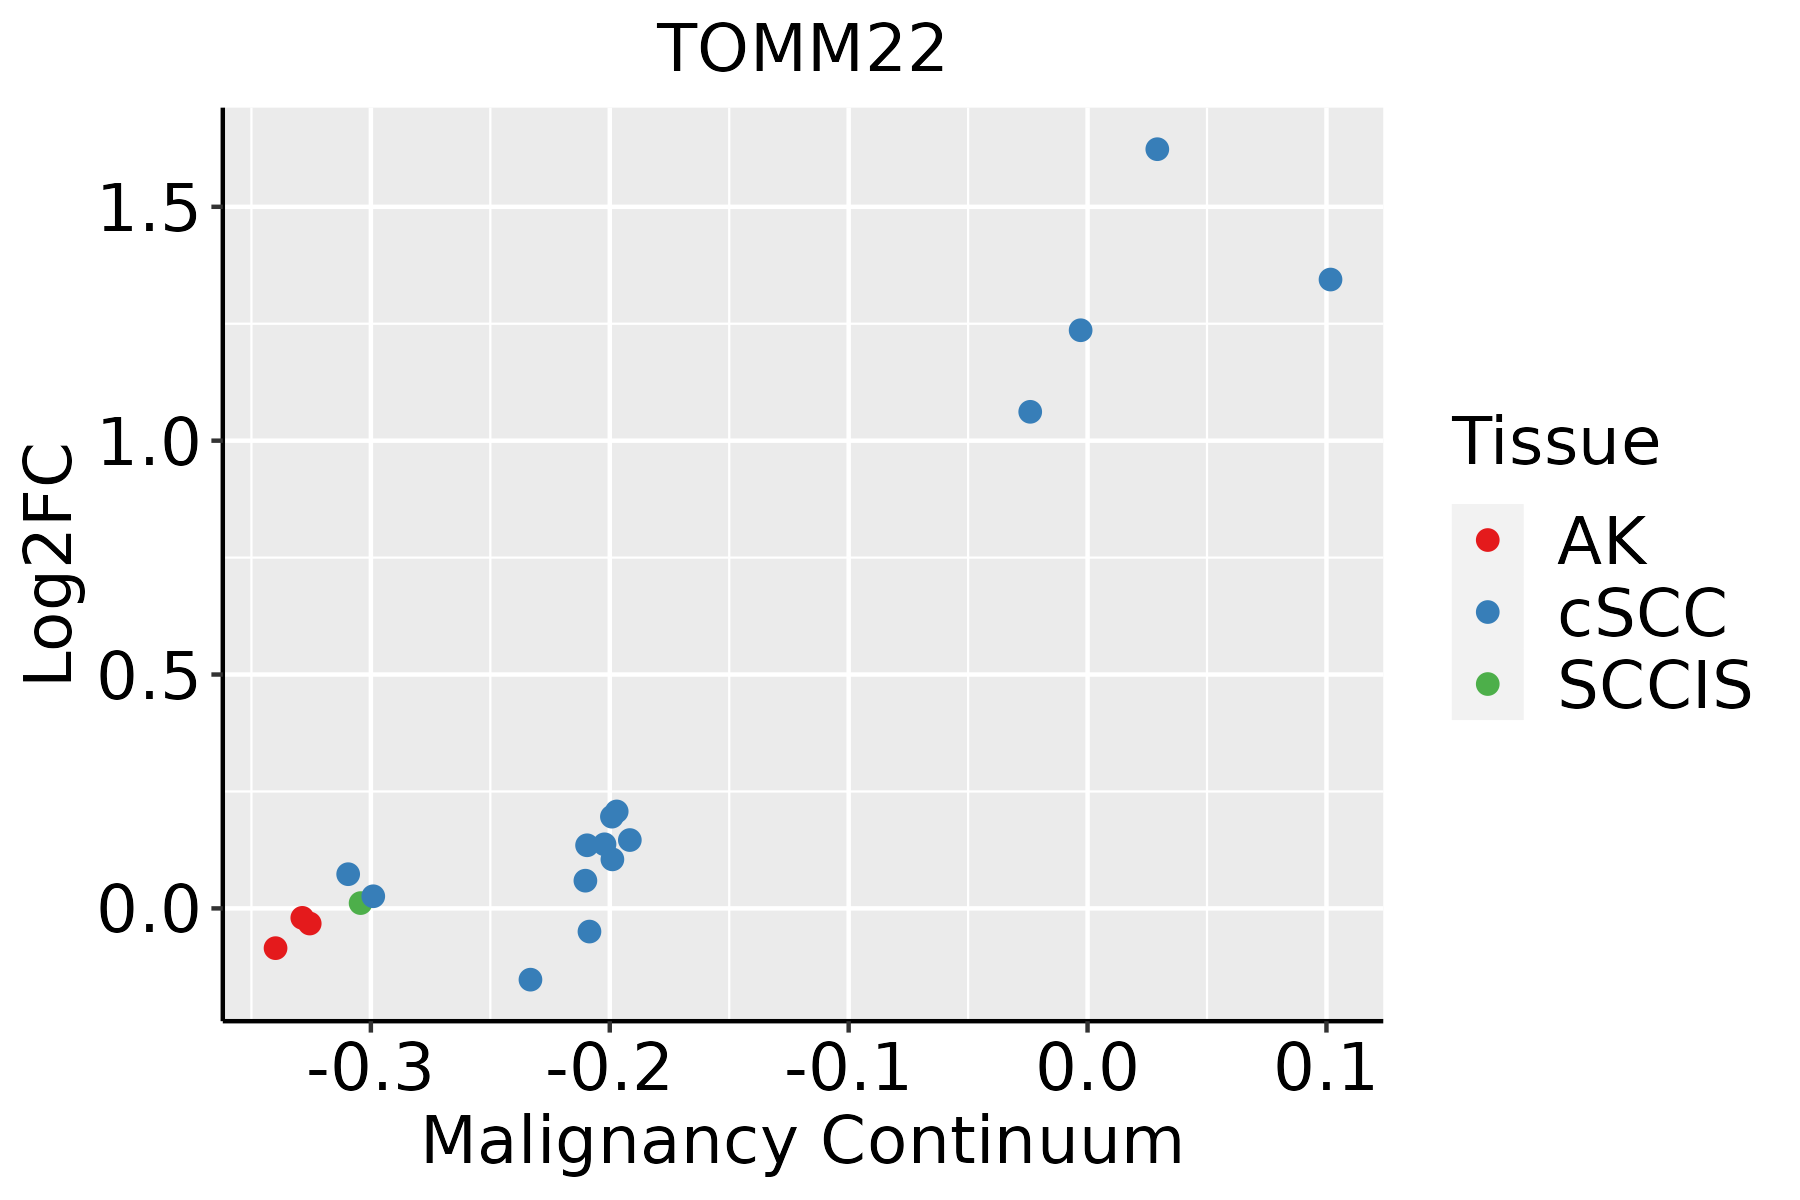 | AK: Actinic keratosis |
| cSCC: Cutaneous squamous cell carcinoma | ||
| SCCIS:squamous cell carcinoma in situ | ||
| Thyroid |  | ATC: Anaplastic thyroid cancer |
| HT: Hashimoto's thyroiditis | ||
| PTC: Papillary thyroid cancer |
| ∗log2FC in expression of this searched gene in stem-like cells from each diseased tissue sample relative to stem-like cells in normal samples in each tissue plotted against the malignancy continuum. Samples are colored based on if they are from different disease stage. |
Top |
Malignant transformation related pathway analysis |
| Find out the enriched GO biological processes and KEGG pathways involved in transition from healthy to precancer to cancer |
| Tissue | Disease Stage | Enriched GO biological Processes |
| Colorectum | AD |  |
| Colorectum | SER |  |
| Colorectum | MSS |  |
| Colorectum | MSI-H |  |
| Colorectum | FAP |  |
| ∗Top 15 enriched GO BP terms are showed in the bar plot of each disease state in each tissue. Each row represents a significant GO biological process which is colored according to the -log10(p.adjust). |
| Page: 1 2 3 4 5 6 7 8 9 |
| GO ID | Tissue | Disease Stage | Description | Gene Ratio | Bg Ratio | pvalue | p.adjust | Count |
| GO:0006839 | Colorectum | AD | mitochondrial transport | 102/3918 | 254/18723 | 1.87e-12 | 3.08e-10 | 102 |
| GO:0072594 | Colorectum | AD | establishment of protein localization to organelle | 148/3918 | 422/18723 | 7.95e-12 | 1.04e-09 | 148 |
| GO:0090150 | Colorectum | AD | establishment of protein localization to membrane | 100/3918 | 260/18723 | 6.01e-11 | 6.33e-09 | 100 |
| GO:0006605 | Colorectum | AD | protein targeting | 105/3918 | 314/18723 | 1.39e-07 | 6.44e-06 | 105 |
| GO:0070585 | Colorectum | AD | protein localization to mitochondrion | 51/3918 | 125/18723 | 3.40e-07 | 1.33e-05 | 51 |
| GO:0007006 | Colorectum | AD | mitochondrial membrane organization | 48/3918 | 116/18723 | 4.53e-07 | 1.72e-05 | 48 |
| GO:0072655 | Colorectum | AD | establishment of protein localization to mitochondrion | 47/3918 | 120/18723 | 3.76e-06 | 1.04e-04 | 47 |
| GO:0017038 | Colorectum | AD | protein import | 67/3918 | 206/18723 | 6.34e-05 | 1.05e-03 | 67 |
| GO:0006626 | Colorectum | AD | protein targeting to mitochondrion | 37/3918 | 100/18723 | 1.58e-04 | 2.20e-03 | 37 |
| GO:0090151 | Colorectum | AD | establishment of protein localization to mitochondrial membrane | 15/3918 | 30/18723 | 3.85e-04 | 4.39e-03 | 15 |
| GO:0051205 | Colorectum | AD | protein insertion into membrane | 23/3918 | 57/18723 | 6.62e-04 | 6.80e-03 | 23 |
| GO:0051204 | Colorectum | AD | protein insertion into mitochondrial membrane | 12/3918 | 25/18723 | 2.30e-03 | 1.80e-02 | 12 |
| GO:0071806 | Colorectum | AD | protein transmembrane transport | 21/3918 | 59/18723 | 6.58e-03 | 4.08e-02 | 21 |
| GO:00068391 | Colorectum | SER | mitochondrial transport | 87/2897 | 254/18723 | 7.91e-14 | 3.03e-11 | 87 |
| GO:00725941 | Colorectum | SER | establishment of protein localization to organelle | 111/2897 | 422/18723 | 4.98e-09 | 4.49e-07 | 111 |
| GO:00705851 | Colorectum | SER | protein localization to mitochondrion | 42/2897 | 125/18723 | 3.75e-07 | 1.98e-05 | 42 |
| GO:00070061 | Colorectum | SER | mitochondrial membrane organization | 38/2897 | 116/18723 | 2.66e-06 | 1.10e-04 | 38 |
| GO:00901501 | Colorectum | SER | establishment of protein localization to membrane | 68/2897 | 260/18723 | 5.55e-06 | 2.01e-04 | 68 |
| GO:00726551 | Colorectum | SER | establishment of protein localization to mitochondrion | 38/2897 | 120/18723 | 6.60e-06 | 2.33e-04 | 38 |
| GO:00066051 | Colorectum | SER | protein targeting | 76/2897 | 314/18723 | 3.19e-05 | 8.47e-04 | 76 |
| Page: 1 2 3 4 5 6 7 8 9 |
| Pathway ID | Tissue | Disease Stage | Description | Gene Ratio | Bg Ratio | pvalue | p.adjust | qvalue | Count |
| Page: 1 |
Top |
Cell-cell communication analysis |
| Identification of potential cell-cell interactions between two cell types and their ligand-receptor pairs for different disease states |
| Ligand | Receptor | LRpair | Pathway | Tissue | Disease Stage |
| Page: 1 |
Top |
Single-cell gene regulatory network inference analysis |
| Find out the significant the regulons (TFs) and the target genes of each regulon across cell types for different disease states |
| TF | Cell Type | Tissue | Disease Stage | Target Gene | RSS | Regulon Activity |
| ∗The dot plots of a searched regulon are shown for all cell subpopulations in each disease state of each tissue based on the regulon specific score inferred using pySCENIC and by calculating the average expression. |
| Page: 1 |
Top |
Somatic mutation of malignant transformation related genes |
| Annotation of somatic variants for genes involved in malignant transformation |
| Hugo Symbol | Variant Class | Variant Classification | dbSNP RS | HGVSc | HGVSp | HGVSp Short | SWISSPROT | BIOTYPE | SIFT | PolyPhen | Tumor Sample Barcode | Tissue | Histology | Sex | Age | Stage | Therapy Types | Drugs | Outcome |
| TOMM22 | SNV | Missense_Mutation | c.365G>A | p.Gly122Glu | p.G122E | Q9NS69 | protein_coding | deleterious(0.04) | probably_damaging(0.953) | TCGA-AN-A0FV-01 | Breast | breast invasive carcinoma | Female | <65 | I/II | Unknown | Unknown | SD | |
| TOMM22 | SNV | Missense_Mutation | c.202N>C | p.Asp68His | p.D68H | Q9NS69 | protein_coding | deleterious(0.03) | benign(0.054) | TCGA-EK-A2PG-01 | Cervix | cervical & endocervical cancer | Female | >=65 | I/II | Unknown | Unknown | SD | |
| TOMM22 | SNV | Missense_Mutation | c.128C>T | p.Thr43Ile | p.T43I | Q9NS69 | protein_coding | deleterious(0.04) | possibly_damaging(0.46) | TCGA-AA-3660-01 | Colorectum | colon adenocarcinoma | Female | <65 | I/II | Unknown | Unknown | SD | |
| TOMM22 | SNV | Missense_Mutation | novel | c.152N>C | p.Leu51Pro | p.L51P | Q9NS69 | protein_coding | deleterious(0) | probably_damaging(0.99) | TCGA-AZ-6601-01 | Colorectum | colon adenocarcinoma | Male | >=65 | I/II | Unknown | Unknown | PD |
| TOMM22 | SNV | Missense_Mutation | rs757015391 | c.193N>A | p.Ala65Thr | p.A65T | Q9NS69 | protein_coding | tolerated(0.24) | benign(0.022) | TCGA-CM-6171-01 | Colorectum | colon adenocarcinoma | Female | >=65 | I/II | Unknown | Unknown | SD |
| TOMM22 | SNV | Missense_Mutation | c.138G>T | p.Glu46Asp | p.E46D | Q9NS69 | protein_coding | deleterious(0.01) | probably_damaging(0.998) | TCGA-AG-A002-01 | Colorectum | rectum adenocarcinoma | Male | <65 | I/II | Unknown | Unknown | SD | |
| TOMM22 | SNV | Missense_Mutation | novel | c.221C>T | p.Ala74Val | p.A74V | Q9NS69 | protein_coding | tolerated(0.87) | benign(0.018) | TCGA-A5-A0G2-01 | Endometrium | uterine corpus endometrioid carcinoma | Female | <65 | III/IV | Unknown | Unknown | SD |
| TOMM22 | SNV | Missense_Mutation | novel | c.152N>C | p.Leu51Pro | p.L51P | Q9NS69 | protein_coding | deleterious(0) | probably_damaging(0.99) | TCGA-AX-A1CE-01 | Endometrium | uterine corpus endometrioid carcinoma | Female | <65 | I/II | Unspecific | Paclitaxel | SD |
| TOMM22 | SNV | Missense_Mutation | novel | c.67N>T | p.Gly23Cys | p.G23C | Q9NS69 | protein_coding | deleterious(0.01) | possibly_damaging(0.879) | TCGA-AX-A2HC-01 | Endometrium | uterine corpus endometrioid carcinoma | Female | <65 | III/IV | Chemotherapy | paclitaxel | PD |
| TOMM22 | SNV | Missense_Mutation | c.225N>T | p.Gln75His | p.Q75H | Q9NS69 | protein_coding | deleterious(0.01) | probably_damaging(0.956) | TCGA-B5-A0JY-01 | Endometrium | uterine corpus endometrioid carcinoma | Female | <65 | III/IV | Chemotherapy | doxorubicin | SD |
| Page: 1 2 |
Top |
Related drugs of malignant transformation related genes |
| Identification of chemicals and drugs interact with genes involved in malignant transfromation |
| (DGIdb 4.0) |
| Entrez ID | Symbol | Category | Interaction Types | Drug Claim Name | Drug Name | PMIDs |
| Page: 1 |

Copyright 2023-Present -The University of Texas Health Science Center at Houston |