Schematic overview of the cellular and molecular mechanisms involved in the cancer progression, including the proposed cellular and molecular mechanisms in cancer cells trajectory. AT1: alveolar type 1 cells; AT2: alveolar type 2 cells; AAH: atypical adenomatous hyperplasia; AIS: adenocarcinoma in situ; MIA: minimally invasive adenocarcinoma; IA: invasive adenocarcinoma; EMT: epithelial-mesenchymal transition

Home

Download

Statistics

Help

Contact

Center for Computational Systems Medicine
leaf

Gene summary

leaf

Malignant transformation analysis

leaf

Malignant transformation related pathway analysis

leaf

Cell-cell communication analysis

leaf

Single-cell gene regulatory network inference analysis

leaf

Somatic mutation of malignant transformation related genes

leaf

Related drugs of malignant transformation related genes

Gene: TOM1

Gene summary for TOM1

check button Gene summary.

Gene informationSpeciesHuman
Gene symbol

TOM1

Gene ID

10043

Gene nametarget of myb1 membrane trafficking protein
Gene AliasIMD85
Cytomap22q12.3
Gene Typeprotein-coding
GO ID

GO:0006810

UniProtAcc

B3KUF5


Top

Malignant transformation analysis

check button Identification of the aberrant gene expression in precancerous and cancerous lesions by comparing the gene expression of stem-like cells in diseased tissues with normal stem cells
check button Malignant transformation involving gene list.
Entrez IDSymbolReplicatesSpeciesOrganTissueAdj P-valueLog2FCMalignancy
10043TOM1HTA11_2487_2000001011HumanColorectumSER1.16e-074.15e-01-0.1808
10043TOM1HTA11_1938_2000001011HumanColorectumAD7.05e-073.10e-01-0.0811
10043TOM1HTA11_347_2000001011HumanColorectumAD2.73e-092.84e-01-0.1954
10043TOM1HTA11_411_2000001011HumanColorectumSER3.64e-036.62e-01-0.2602
10043TOM1HTA11_3361_2000001011HumanColorectumAD3.03e-043.26e-01-0.1207
10043TOM1HTA11_696_2000001011HumanColorectumAD2.35e-072.84e-01-0.1464
10043TOM1HTA11_866_2000001011HumanColorectumAD3.05e-021.59e-01-0.1001
10043TOM1HTA11_1391_2000001011HumanColorectumAD4.37e-114.71e-01-0.059
10043TOM1HTA11_866_3004761011HumanColorectumAD1.29e-021.55e-010.096
10043TOM1HTA11_99999971662_82457HumanColorectumMSS4.01e-074.10e-010.3859
10043TOM1HTA11_99999973899_84307HumanColorectumMSS4.23e-064.18e-010.2585
10043TOM1HTA11_99999974143_84620HumanColorectumMSS7.47e-041.55e-010.3005
10043TOM1LZE4THumanEsophagusESCC3.05e-072.63e-010.0811
10043TOM1LZE5THumanEsophagusESCC1.20e-022.45e-010.0514
10043TOM1LZE7THumanEsophagusESCC1.52e-023.04e-010.0667
10043TOM1LZE8THumanEsophagusESCC2.60e-041.59e-010.067
10043TOM1LZE20THumanEsophagusESCC6.59e-072.79e-010.0662
10043TOM1LZE24THumanEsophagusESCC4.21e-153.99e-010.0596
10043TOM1LZE6THumanEsophagusESCC4.51e-032.33e-010.0845
10043TOM1P1T-EHumanEsophagusESCC2.64e-097.38e-010.0875
Page: 1 2 3 4 5 6 

check button Transcriptomic changes along malignancy continuum.
TissueExpression DynamicsAbbreviation
Colorectum (GSE201348)The image shows the transcriptomic changes along malignancy continuum.log2FC in expression of this searched gene in stem-like cells from each diseased tissue sample relative to stem-like cells in normal samples in each tissue plotted against the malignancy continuum. Samples are colored based on if they are from different disease stage.
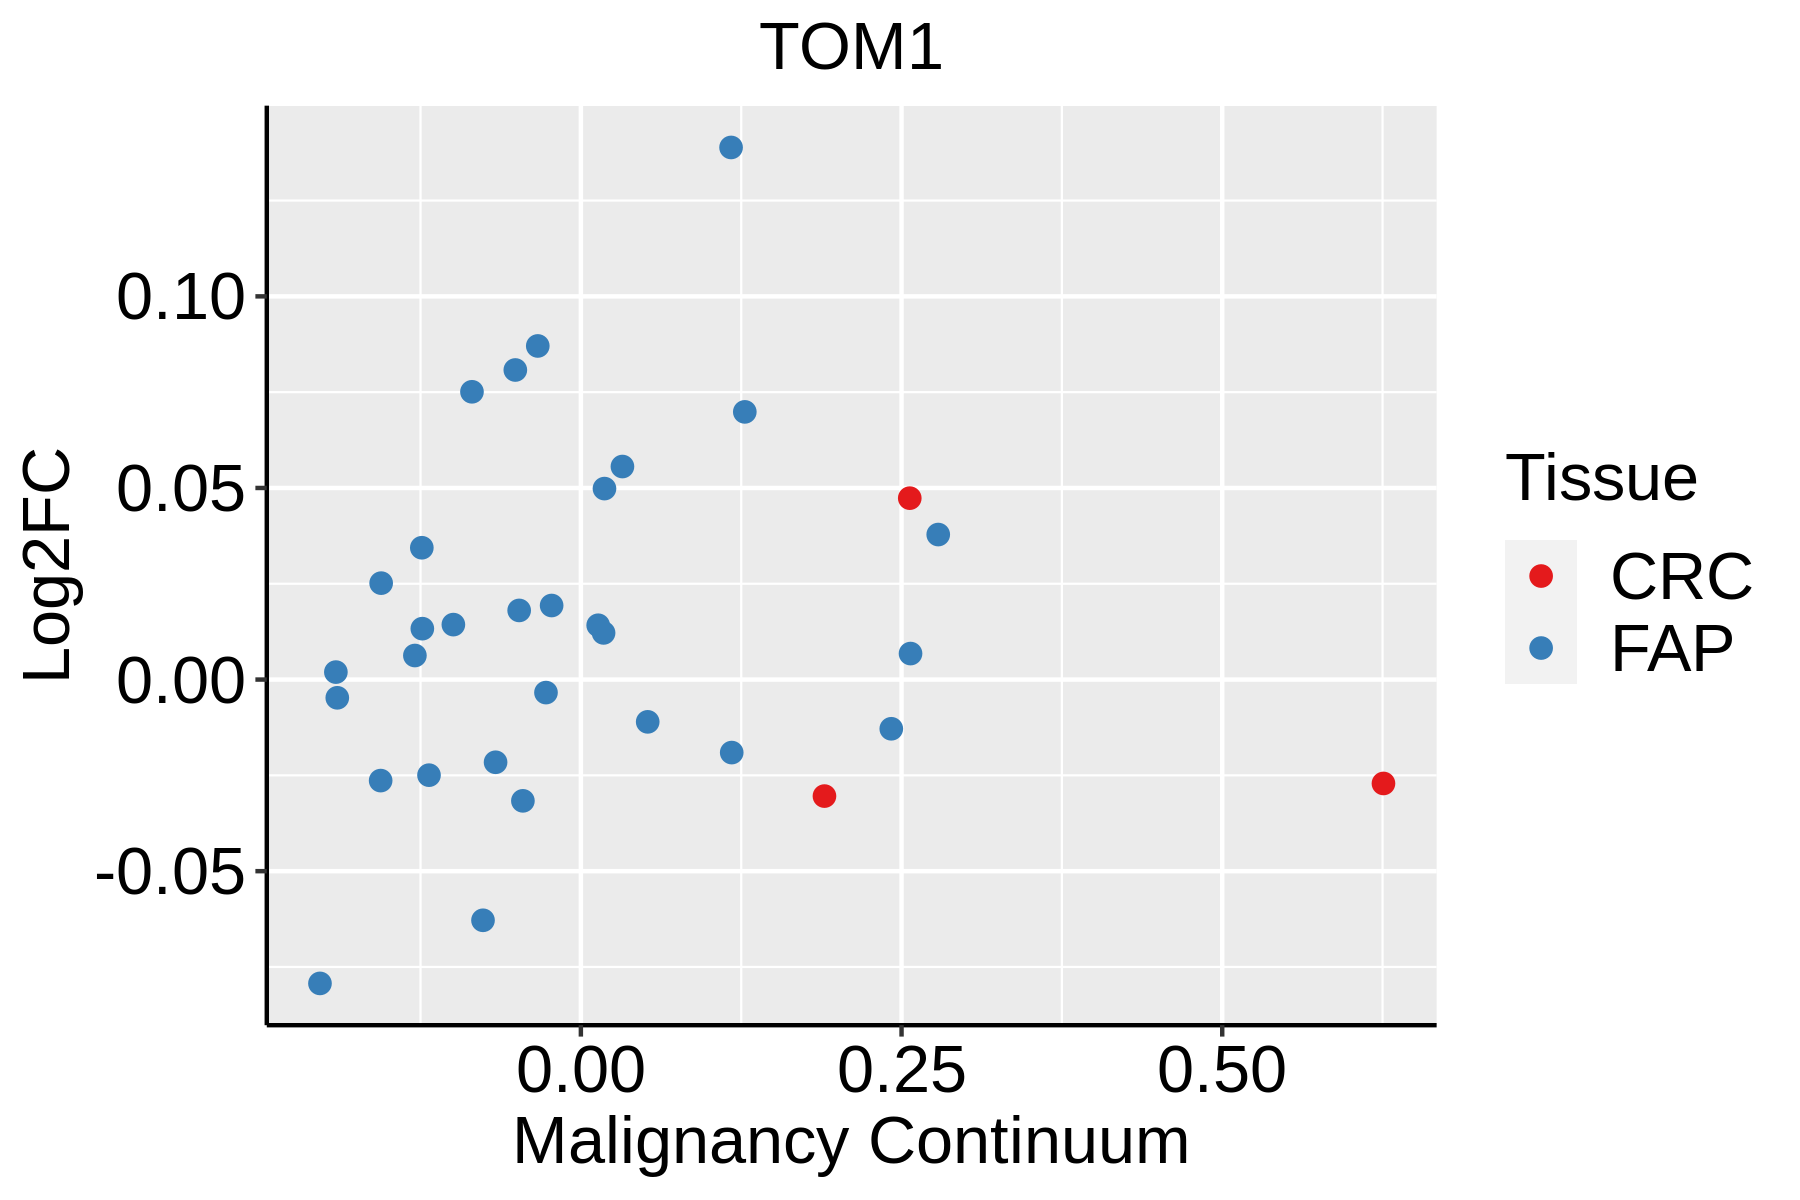
FAP: Familial adenomatous polyposis
CRC: Colorectal cancer
Colorectum (HTA11)The image shows the transcriptomic changes along malignancy continuum.log2FC in expression of this searched gene in stem-like cells from each diseased tissue sample relative to stem-like cells in normal samples in each tissue plotted against the malignancy continuum. Samples are colored based on if they are from different disease stage.AD: Adenomas
SER: Sessile serrated lesions
MSI-H: Microsatellite-high colorectal cancer
MSS: Microsatellite stable colorectal cancer
EsophagusThe image shows the transcriptomic changes along malignancy continuum.log2FC in expression of this searched gene in stem-like cells from each diseased tissue sample relative to stem-like cells in normal samples in each tissue plotted against the malignancy continuum. Samples are colored based on if they are from different disease stage.
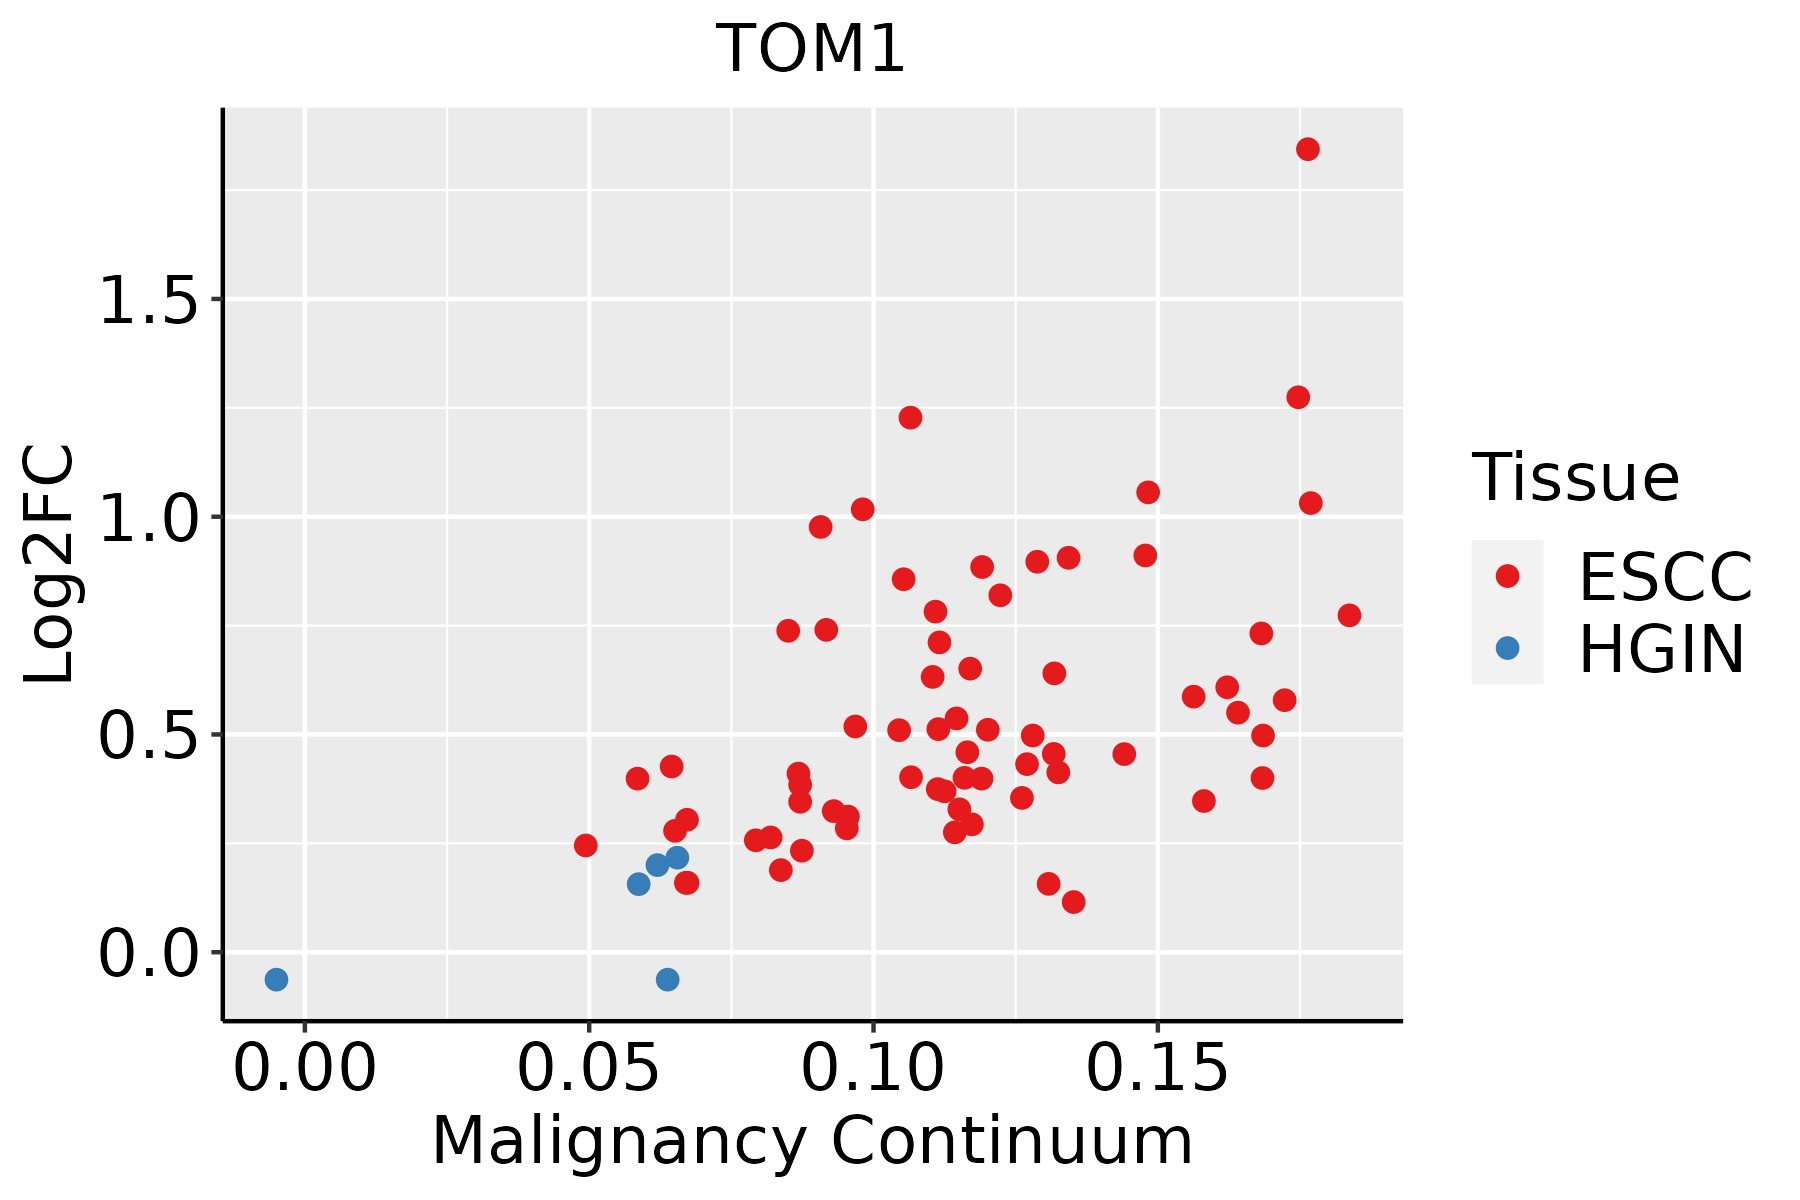
ESCC: Esophageal squamous cell carcinoma
HGIN: High-grade intraepithelial neoplasias
LGIN: Low-grade intraepithelial neoplasias
LiverThe image shows the transcriptomic changes along malignancy continuum.log2FC in expression of this searched gene in stem-like cells from each diseased tissue sample relative to stem-like cells in normal samples in each tissue plotted against the malignancy continuum. Samples are colored based on if they are from different disease stage.
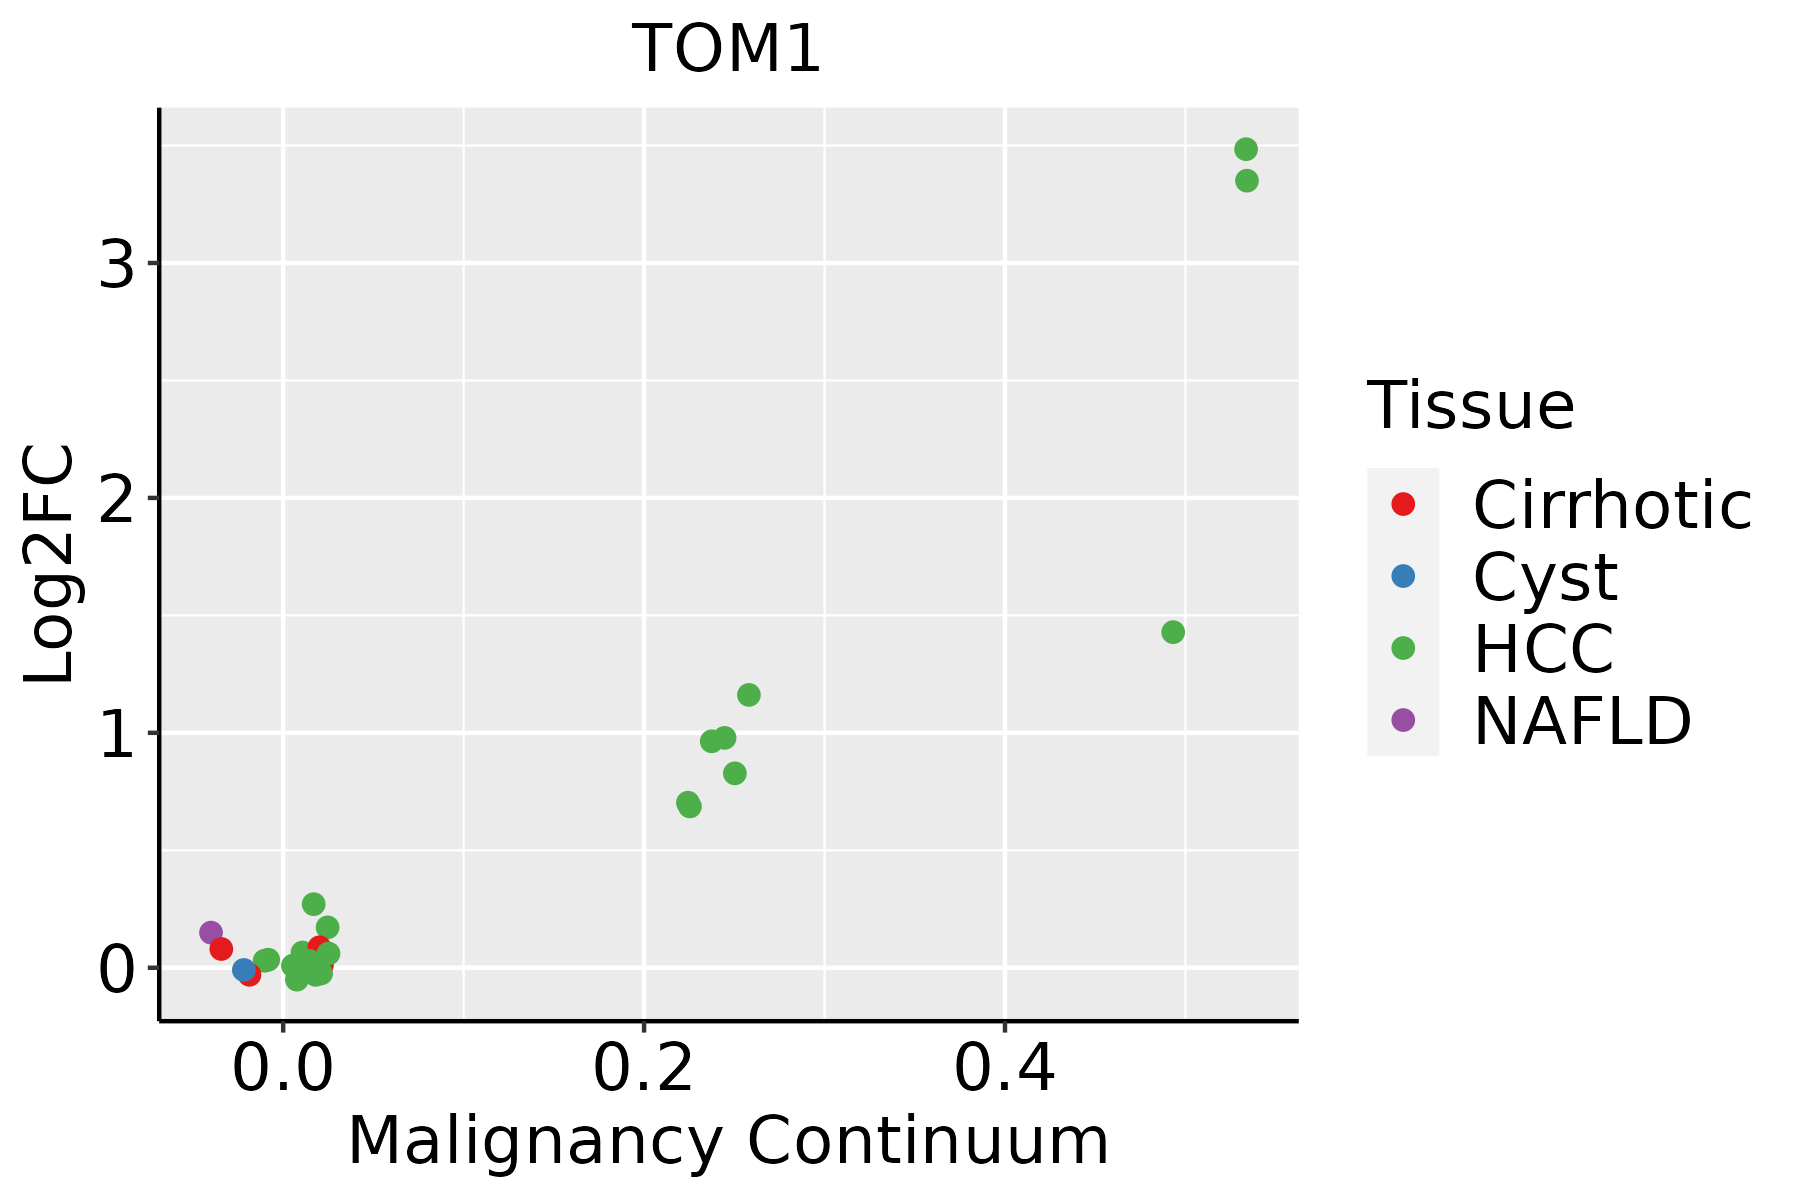
HCC: Hepatocellular carcinoma
NAFLD: Non-alcoholic fatty liver disease
Oral CavityThe image shows the transcriptomic changes along malignancy continuum.log2FC in expression of this searched gene in stem-like cells from each diseased tissue sample relative to stem-like cells in normal samples in each tissue plotted against the malignancy continuum. Samples are colored based on if they are from different disease stage.
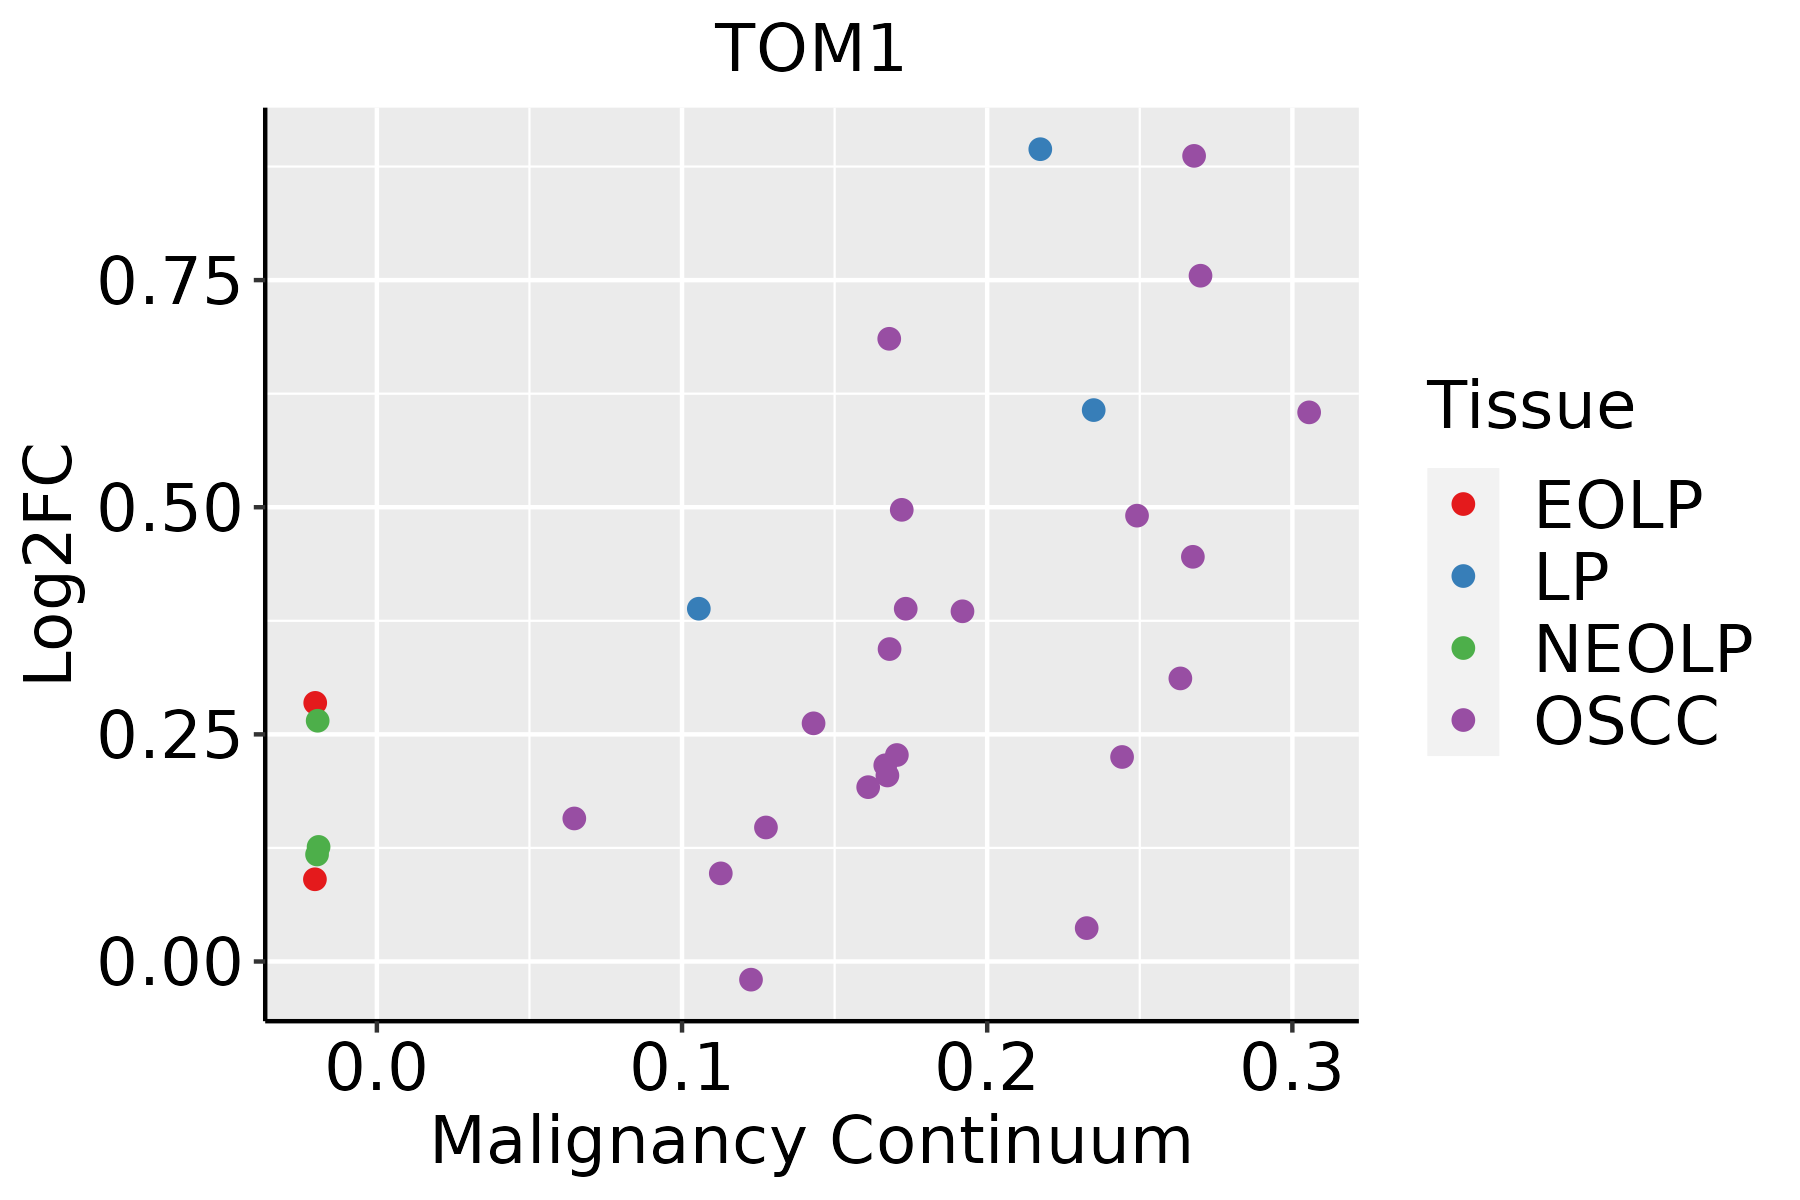
EOLP: Erosive Oral lichen planus
LP: leukoplakia
NEOLP: Non-erosive oral lichen planus
OSCC: Oral squamous cell carcinoma
∗log2FC in expression of this searched gene in stem-like cells from each diseased tissue sample relative to stem-like cells in normal samples in each tissue plotted against the malignancy continuum. Samples are colored based on if they are from different disease stage.

Top

Malignant transformation related pathway analysis

check buttonFind out the enriched GO biological processes and KEGG pathways involved in transition from healthy to precancer to cancer
check button Figure of enriched GO biological processes.
TissueDisease StageEnriched GO biological Processes
ColorectumADGO analysis - Figure of enriched GO biological processes: Top 15 enriched GO BP terms are showed in the bar plot of each disease state in each tissue. Each row represents a significant GO biological process which is colored according to the -log10(p.adjust).
ColorectumSERGO analysis - Figure of enriched GO biological processes: Top 15 enriched GO BP terms are showed in the bar plot of each disease state in each tissue. Each row represents a significant GO biological process which is colored according to the -log10(p.adjust).
ColorectumMSSGO analysis - Figure of enriched GO biological processes: Top 15 enriched GO BP terms are showed in the bar plot of each disease state in each tissue. Each row represents a significant GO biological process which is colored according to the -log10(p.adjust).
ColorectumMSI-HGO analysis - Figure of enriched GO biological processes: Top 15 enriched GO BP terms are showed in the bar plot of each disease state in each tissue. Each row represents a significant GO biological process which is colored according to the -log10(p.adjust).
ColorectumFAPGO analysis - Figure of enriched GO biological processes: Top 15 enriched GO BP terms are showed in the bar plot of each disease state in each tissue. Each row represents a significant GO biological process which is colored according to the -log10(p.adjust).
∗Top 15 enriched GO BP terms are showed in the bar plot of each disease state in each tissue. Each row represents a significant GO biological process which is colored according to the -log10(p.adjust).
Page: 1 2 3 4 5 6 7 8 9 

check button Enriched GO biological processes.
GO IDTissueDisease StageDescriptionGene RatioBg Ratiopvaluep.adjustCount
GO:00073466CervixCCregulation of mitotic cell cycle88/2311457/187231.26e-052.60e-0488
GO:00106399CervixCCnegative regulation of organelle organization68/2311348/187237.40e-051.03e-0368
GO:00457862CervixCCnegative regulation of cell cycle67/2311385/187232.21e-031.59e-0267
GO:00459302CervixCCnegative regulation of mitotic cell cycle44/2311235/187233.02e-031.99e-0244
GO:01400143CervixCCmitotic nuclear division50/2311287/187237.27e-033.91e-0250
GO:00109482CervixCCnegative regulation of cell cycle process51/2311294/187237.35e-033.94e-0251
GO:00482851CervixCCorganelle fission78/2311488/187239.70e-034.79e-0278
GO:0016197ColorectumADendosomal transport90/3918230/187231.88e-101.73e-0890
GO:0010639ColorectumADnegative regulation of organelle organization114/3918348/187231.41e-076.49e-06114
GO:0046777ColorectumADprotein autophosphorylation74/3918227/187232.48e-054.76e-0474
GO:0033674ColorectumADpositive regulation of kinase activity131/3918467/187231.28e-041.85e-03131
GO:0045860ColorectumADpositive regulation of protein kinase activity107/3918386/187238.01e-047.92e-03107
GO:0007346ColorectumADregulation of mitotic cell cycle119/3918457/187234.60e-033.14e-02119
GO:0140014ColorectumADmitotic nuclear division78/3918287/187236.48e-034.05e-0278
GO:00106391ColorectumSERnegative regulation of organelle organization90/2897348/187233.14e-071.69e-0590
GO:00161971ColorectumSERendosomal transport61/2897230/187231.03e-053.35e-0461
GO:00161972ColorectumMSSendosomal transport79/3467230/187237.04e-094.39e-0779
GO:00106392ColorectumMSSnegative regulation of organelle organization102/3467348/187235.36e-072.05e-05102
GO:00336742ColorectumMSSpositive regulation of kinase activity122/3467467/187232.50e-055.21e-04122
GO:00458602ColorectumMSSpositive regulation of protein kinase activity102/3467386/187236.93e-051.20e-03102
Page: 1 2 3 4 5 6 7 8 9 10 

check button Enriched KEGG pathways.
Pathway IDTissueDisease StageDescriptionGene RatioBg Ratiopvaluep.adjustqvalueCount
Page: 1 

Top

Cell-cell communication analysis

check buttonIdentification of potential cell-cell interactions between two cell types and their ligand-receptor pairs for different disease states
LigandReceptorLRpairPathwayTissueDisease Stage
Page: 1 

Top

Single-cell gene regulatory network inference analysis

check buttonFind out the significant the regulons (TFs) and the target genes of each regulon across cell types for different disease states
TFCell TypeTissueDisease StageTarget GeneRSSRegulon Activity
∗The dot plots of a searched regulon are shown for all cell subpopulations in each disease state of each tissue based on the regulon specific score inferred using pySCENIC and by calculating the average expression.
Page: 1 

Top

Somatic mutation of malignant transformation related genes

check buttonAnnotation of somatic variants for genes involved in malignant transformation
Hugo SymbolVariant ClassVariant ClassificationdbSNP RSHGVScHGVSpHGVSp ShortSWISSPROTBIOTYPESIFTPolyPhenTumor Sample BarcodeTissueHistologySexAgeStageTherapy TypesDrugsOutcome
TOM1SNVMissense_Mutationrs201539247c.128N>Tp.Thr43Metp.T43MO60784protein_codingdeleterious(0)probably_damaging(0.999)TCGA-A7-A26E-01Breastbreast invasive carcinomaFemale>=65III/IVChemotherapycytoxanSD
TOM1SNVMissense_Mutationnovelc.5N>Gp.Asp2Glyp.D2GO60784protein_codingdeleterious(0)possibly_damaging(0.461)TCGA-AO-A0J5-01Breastbreast invasive carcinomaFemale<65III/IVOther, specify in notesBisphosphonatezoledronicPD
TOM1SNVMissense_Mutationc.1163C>Tp.Ala388Valp.A388VO60784protein_codingdeleterious(0.01)benign(0.234)TCGA-EW-A1P8-01Breastbreast invasive carcinomaFemale<65III/IVChemotherapyfluorouracilPD
TOM1insertionFrame_Shift_Insnovelc.566_567insAGGGAAGp.Asp190GlyfsTer20p.D190Gfs*20O60784protein_codingTCGA-A2-A0CT-01Breastbreast invasive carcinomaFemale>=65I/IIChemotherapycytoxanSD
TOM1insertionFrame_Shift_Insnovelc.794_795insAAAATTAGCCAGGCGTGGTGp.Gln266LysfsTer22p.Q266Kfs*22O60784protein_codingTCGA-A8-A08H-01Breastbreast invasive carcinomaFemale>=65I/IIUnknownUnknownSD
TOM1insertionFrame_Shift_Insnovelc.1132_1133insGAGGGTACATTATGGTACTGTGGGCACCCp.Ala378GlyfsTer17p.A378Gfs*17O60784protein_codingTCGA-A8-A08H-01Breastbreast invasive carcinomaFemale>=65I/IIUnknownUnknownSD
TOM1insertionNonsense_Mutationnovelc.1123_1124insCTTCCCCAGCAGAATCAATGGATAGCGTTTTGACTGTTCTCTAACp.Ser375delinsThrSerProAlaGluSerMetAspSerValLeuThrValLeuTerArgp.S375delinsTSPAESMDSVLTVL*RO60784protein_codingTCGA-AQ-A04J-01Breastbreast invasive carcinomaFemale<65I/IIChemotherapycytoxanSD
TOM1SNVMissense_Mutationnovelc.784C>Gp.Arg262Glyp.R262GO60784protein_codingdeleterious(0)possibly_damaging(0.551)TCGA-EK-A2R9-01Cervixcervical & endocervical cancerFemale<65I/IIUnknownUnknownSD
TOM1SNVMissense_Mutationrs371088274c.505N>Ap.Val169Metp.V169MO60784protein_codingdeleterious(0.05)possibly_damaging(0.872)TCGA-EK-A2RL-01Cervixcervical & endocervical cancerFemale<65I/IIChemotherapytaxolPD
TOM1SNVMissense_Mutationrs371791801c.283N>Ap.Val95Metp.V95MO60784protein_codingdeleterious(0.03)probably_damaging(0.993)TCGA-VS-A958-01Cervixcervical & endocervical cancerFemale<65I/IIChemotherapycisplatinCR
Page: 1 2 3 4 5 6 

Top

Related drugs of malignant transformation related genes

check buttonIdentification of chemicals and drugs interact with genes involved in malignant transfromation
(DGIdb 4.0)
Entrez IDSymbolCategoryInteraction TypesDrug Claim NameDrug NamePMIDs
Page: 1