
|
|||||
|
 | |
| |
| |
| |
| |
| |
|
Gene: TOGARAM1 |
Gene summary for TOGARAM1 |
| Gene information | Species | Human | Gene symbol | TOGARAM1 | Gene ID | 23116 |
| Gene name | TOG array regulator of axonemal microtubules 1 | |
| Gene Alias | FAM179B | |
| Cytomap | 14q21.2 | |
| Gene Type | protein-coding | GO ID | GO:0000226 | UniProtAcc | B4DHM7 |
Top |
Malignant transformation analysis |
| Identification of the aberrant gene expression in precancerous and cancerous lesions by comparing the gene expression of stem-like cells in diseased tissues with normal stem cells |
| Entrez ID | Symbol | Replicates | Species | Organ | Tissue | Adj P-value | Log2FC | Malignancy |
| 23116 | TOGARAM1 | HTA11_3410_2000001011 | Human | Colorectum | AD | 9.84e-12 | -5.60e-01 | 0.0155 |
| 23116 | TOGARAM1 | HTA11_2487_2000001011 | Human | Colorectum | SER | 1.56e-04 | -5.17e-01 | -0.1808 |
| 23116 | TOGARAM1 | HTA11_78_2000001011 | Human | Colorectum | AD | 1.74e-05 | -5.22e-01 | -0.1088 |
| 23116 | TOGARAM1 | HTA11_347_2000001011 | Human | Colorectum | AD | 1.56e-02 | -3.82e-01 | -0.1954 |
| 23116 | TOGARAM1 | HTA11_3361_2000001011 | Human | Colorectum | AD | 1.83e-06 | -6.02e-01 | -0.1207 |
| 23116 | TOGARAM1 | HTA11_696_2000001011 | Human | Colorectum | AD | 1.14e-12 | -4.62e-01 | -0.1464 |
| 23116 | TOGARAM1 | HTA11_866_2000001011 | Human | Colorectum | AD | 5.46e-14 | -5.16e-01 | -0.1001 |
| 23116 | TOGARAM1 | HTA11_1391_2000001011 | Human | Colorectum | AD | 2.59e-04 | -4.57e-01 | -0.059 |
| 23116 | TOGARAM1 | HTA11_5212_2000001011 | Human | Colorectum | AD | 9.80e-05 | -6.52e-01 | -0.2061 |
| 23116 | TOGARAM1 | HTA11_866_3004761011 | Human | Colorectum | AD | 4.37e-06 | -4.92e-01 | 0.096 |
| 23116 | TOGARAM1 | HTA11_10623_2000001011 | Human | Colorectum | AD | 4.45e-02 | -5.87e-01 | -0.0177 |
| 23116 | TOGARAM1 | HTA11_10711_2000001011 | Human | Colorectum | AD | 6.52e-03 | -4.88e-01 | 0.0338 |
| 23116 | TOGARAM1 | HTA11_7696_3000711011 | Human | Colorectum | AD | 1.32e-06 | -4.21e-01 | 0.0674 |
| 23116 | TOGARAM1 | HTA11_6818_2000001021 | Human | Colorectum | AD | 6.32e-03 | -5.19e-01 | 0.0588 |
| 23116 | TOGARAM1 | HTA11_99999970781_79442 | Human | Colorectum | MSS | 7.40e-36 | -6.52e-01 | 0.294 |
| 23116 | TOGARAM1 | HTA11_99999965104_69814 | Human | Colorectum | MSS | 1.30e-11 | -6.52e-01 | 0.281 |
| 23116 | TOGARAM1 | HTA11_99999971662_82457 | Human | Colorectum | MSS | 8.39e-34 | -6.52e-01 | 0.3859 |
| 23116 | TOGARAM1 | HTA11_99999973899_84307 | Human | Colorectum | MSS | 9.55e-09 | -6.52e-01 | 0.2585 |
| 23116 | TOGARAM1 | HTA11_99999974143_84620 | Human | Colorectum | MSS | 4.96e-35 | -6.52e-01 | 0.3005 |
| 23116 | TOGARAM1 | A015-C-203 | Human | Colorectum | FAP | 8.91e-19 | -1.44e-01 | -0.1294 |
| Page: 1 2 3 4 |
| Tissue | Expression Dynamics | Abbreviation |
| Colorectum (GSE201348) |  | FAP: Familial adenomatous polyposis |
| CRC: Colorectal cancer | ||
| Colorectum (HTA11) |  | AD: Adenomas |
| SER: Sessile serrated lesions | ||
| MSI-H: Microsatellite-high colorectal cancer | ||
| MSS: Microsatellite stable colorectal cancer | ||
| Lung | 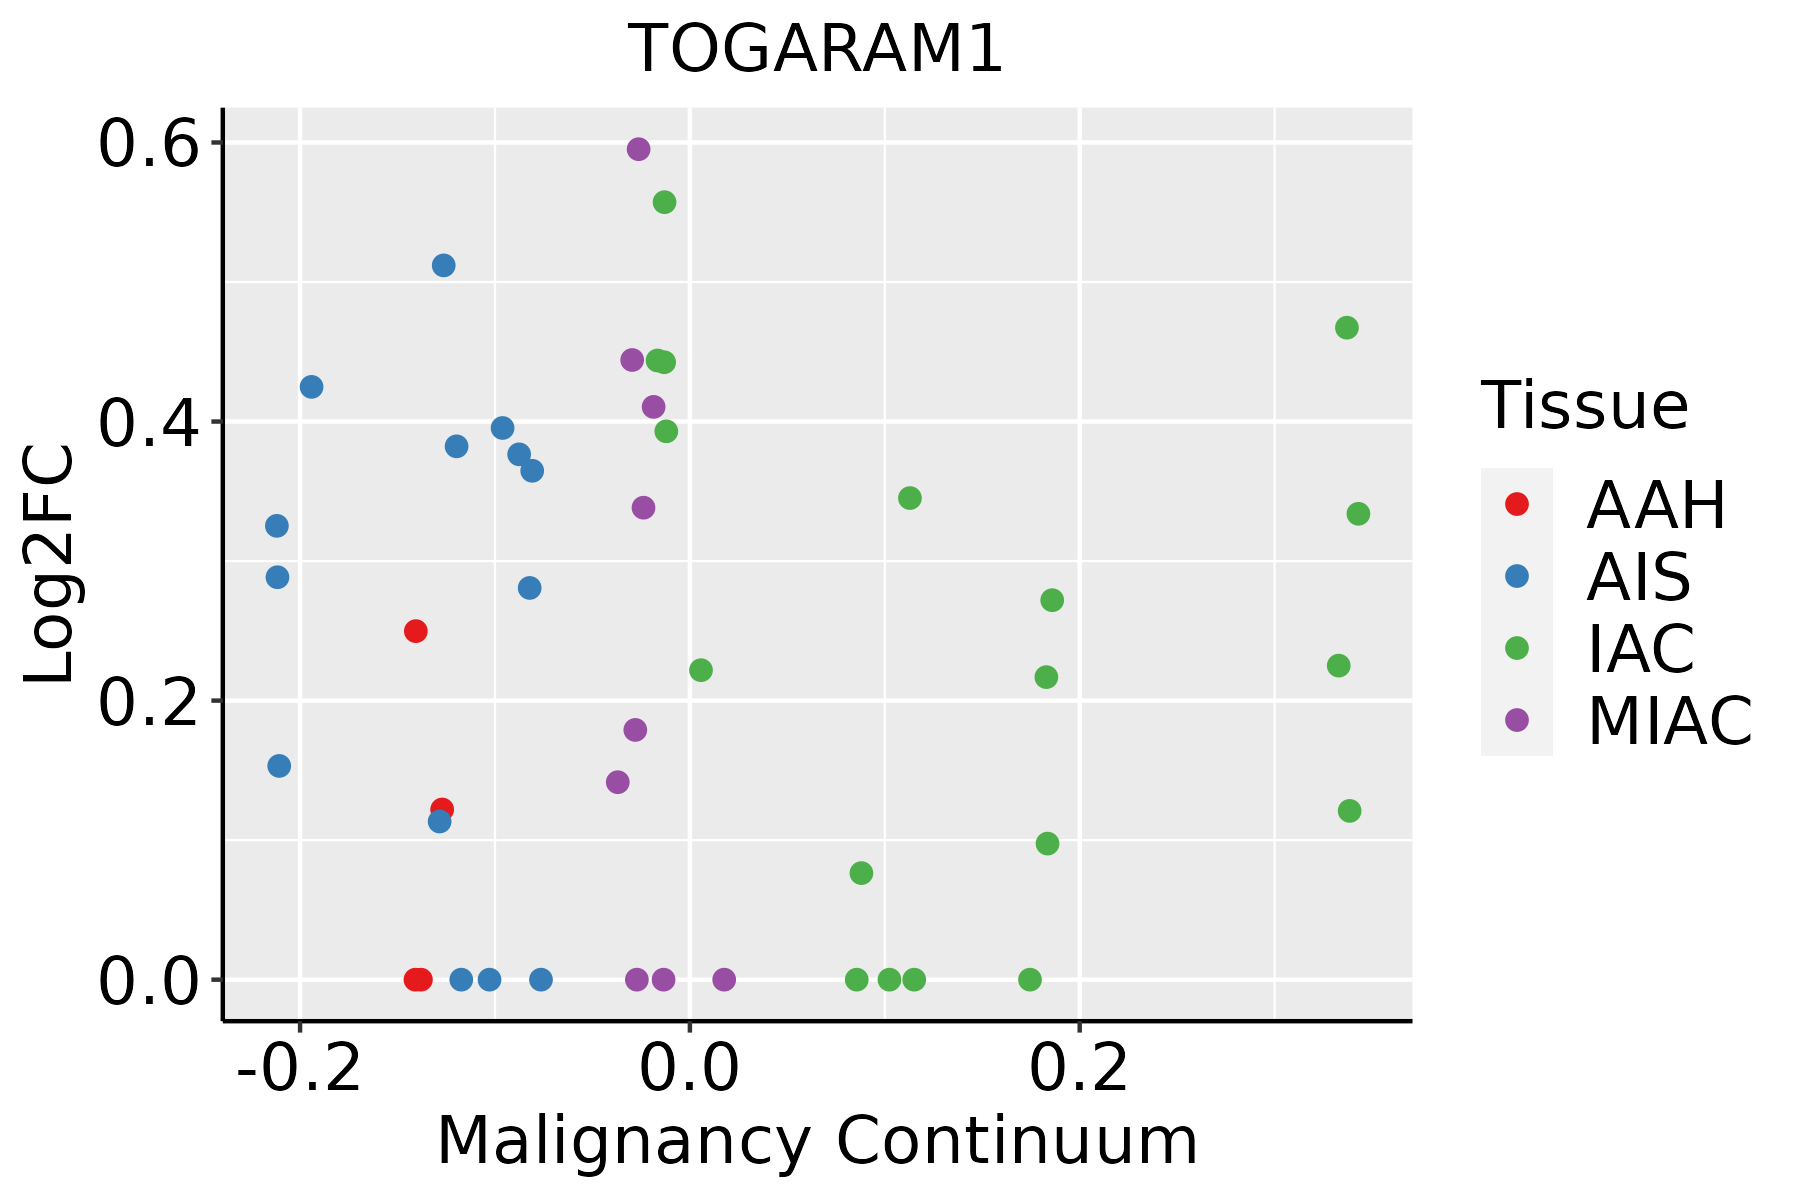 | AAH: Atypical adenomatous hyperplasia |
| AIS: Adenocarcinoma in situ | ||
| IAC: Invasive lung adenocarcinoma | ||
| MIA: Minimally invasive adenocarcinoma | ||
| Thyroid | 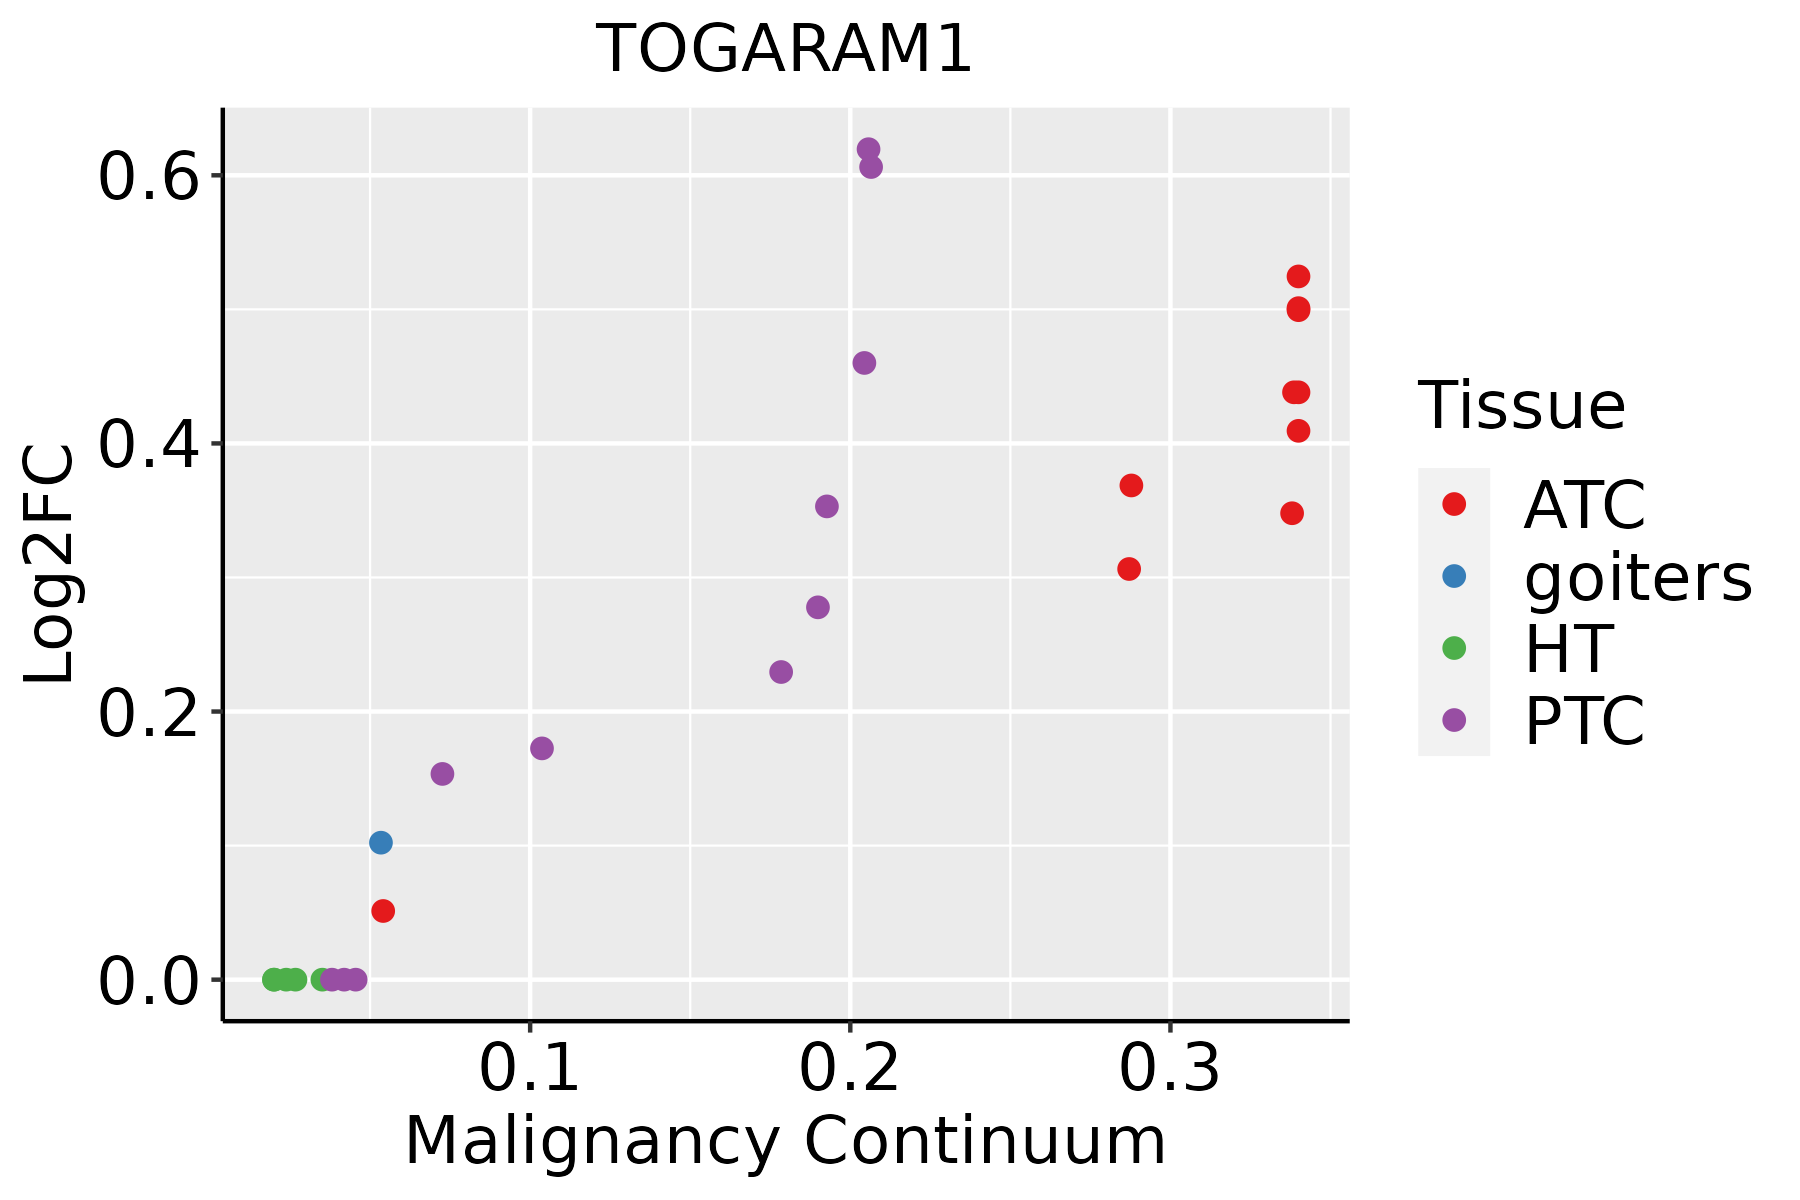 | ATC: Anaplastic thyroid cancer |
| HT: Hashimoto's thyroiditis | ||
| PTC: Papillary thyroid cancer |
| ∗log2FC in expression of this searched gene in stem-like cells from each diseased tissue sample relative to stem-like cells in normal samples in each tissue plotted against the malignancy continuum. Samples are colored based on if they are from different disease stage. |
Top |
Malignant transformation related pathway analysis |
| Find out the enriched GO biological processes and KEGG pathways involved in transition from healthy to precancer to cancer |
| Tissue | Disease Stage | Enriched GO biological Processes |
| Colorectum | AD |  |
| Colorectum | SER |  |
| Colorectum | MSS |  |
| Colorectum | MSI-H |  |
| Colorectum | FAP |  |
| ∗Top 15 enriched GO BP terms are showed in the bar plot of each disease state in each tissue. Each row represents a significant GO biological process which is colored according to the -log10(p.adjust). |
| Page: 1 2 3 4 5 6 7 8 9 |
| GO ID | Tissue | Disease Stage | Description | Gene Ratio | Bg Ratio | pvalue | p.adjust | Count |
| GO:1902903 | Colorectum | AD | regulation of supramolecular fiber organization | 139/3918 | 383/18723 | 2.01e-12 | 3.19e-10 | 139 |
| GO:0032271 | Colorectum | AD | regulation of protein polymerization | 94/3918 | 233/18723 | 1.01e-11 | 1.29e-09 | 94 |
| GO:0051258 | Colorectum | AD | protein polymerization | 112/3918 | 297/18723 | 1.85e-11 | 2.27e-09 | 112 |
| GO:0043254 | Colorectum | AD | regulation of protein-containing complex assembly | 148/3918 | 428/18723 | 2.64e-11 | 3.18e-09 | 148 |
| GO:1902905 | Colorectum | AD | positive regulation of supramolecular fiber organization | 85/3918 | 209/18723 | 5.95e-11 | 6.33e-09 | 85 |
| GO:0051495 | Colorectum | AD | positive regulation of cytoskeleton organization | 89/3918 | 226/18723 | 1.61e-10 | 1.56e-08 | 89 |
| GO:0032273 | Colorectum | AD | positive regulation of protein polymerization | 62/3918 | 138/18723 | 1.94e-10 | 1.76e-08 | 62 |
| GO:0031334 | Colorectum | AD | positive regulation of protein-containing complex assembly | 91/3918 | 237/18723 | 4.78e-10 | 3.99e-08 | 91 |
| GO:0007051 | Colorectum | AD | spindle organization | 58/3918 | 184/18723 | 4.71e-04 | 5.20e-03 | 58 |
| GO:1902850 | Colorectum | AD | microtubule cytoskeleton organization involved in mitosis | 48/3918 | 147/18723 | 5.87e-04 | 6.21e-03 | 48 |
| GO:0090307 | Colorectum | AD | mitotic spindle assembly | 25/3918 | 65/18723 | 9.12e-04 | 8.71e-03 | 25 |
| GO:0007052 | Colorectum | AD | mitotic spindle organization | 40/3918 | 120/18723 | 1.03e-03 | 9.61e-03 | 40 |
| GO:0051225 | Colorectum | AD | spindle assembly | 37/3918 | 117/18723 | 4.32e-03 | 2.96e-02 | 37 |
| GO:0140014 | Colorectum | AD | mitotic nuclear division | 78/3918 | 287/18723 | 6.48e-03 | 4.05e-02 | 78 |
| GO:0070507 | Colorectum | AD | regulation of microtubule cytoskeleton organization | 44/3918 | 148/18723 | 7.05e-03 | 4.31e-02 | 44 |
| GO:19029031 | Colorectum | SER | regulation of supramolecular fiber organization | 114/2897 | 383/18723 | 7.32e-13 | 1.95e-10 | 114 |
| GO:00322711 | Colorectum | SER | regulation of protein polymerization | 78/2897 | 233/18723 | 5.71e-12 | 1.17e-09 | 78 |
| GO:00512581 | Colorectum | SER | protein polymerization | 91/2897 | 297/18723 | 2.72e-11 | 5.06e-09 | 91 |
| GO:00432541 | Colorectum | SER | regulation of protein-containing complex assembly | 119/2897 | 428/18723 | 3.34e-11 | 5.86e-09 | 119 |
| GO:19029051 | Colorectum | SER | positive regulation of supramolecular fiber organization | 68/2897 | 209/18723 | 5.17e-10 | 5.98e-08 | 68 |
| Page: 1 2 3 4 5 6 7 8 |
| Pathway ID | Tissue | Disease Stage | Description | Gene Ratio | Bg Ratio | pvalue | p.adjust | qvalue | Count |
| Page: 1 |
Top |
Cell-cell communication analysis |
| Identification of potential cell-cell interactions between two cell types and their ligand-receptor pairs for different disease states |
| Ligand | Receptor | LRpair | Pathway | Tissue | Disease Stage |
| Page: 1 |
Top |
Single-cell gene regulatory network inference analysis |
| Find out the significant the regulons (TFs) and the target genes of each regulon across cell types for different disease states |
| TF | Cell Type | Tissue | Disease Stage | Target Gene | RSS | Regulon Activity |
| ∗The dot plots of a searched regulon are shown for all cell subpopulations in each disease state of each tissue based on the regulon specific score inferred using pySCENIC and by calculating the average expression. |
| Page: 1 |
Top |
Somatic mutation of malignant transformation related genes |
| Annotation of somatic variants for genes involved in malignant transformation |
| Hugo Symbol | Variant Class | Variant Classification | dbSNP RS | HGVSc | HGVSp | HGVSp Short | SWISSPROT | BIOTYPE | SIFT | PolyPhen | Tumor Sample Barcode | Tissue | Histology | Sex | Age | Stage | Therapy Types | Drugs | Outcome |
| TOGARAM1 | SNV | Missense_Mutation | novel | c.3521C>T | p.Ser1174Phe | p.S1174F | protein_coding | deleterious(0) | possibly_damaging(0.701) | TCGA-5L-AAT1-01 | Breast | breast invasive carcinoma | Female | <65 | III/IV | Hormone Therapy | letrozol | SD | |
| TOGARAM1 | SNV | Missense_Mutation | novel | c.2167G>T | p.Asp723Tyr | p.D723Y | protein_coding | deleterious(0) | possibly_damaging(0.643) | TCGA-A2-A1FZ-01 | Breast | breast invasive carcinoma | Female | <65 | I/II | Unspecific | Arimidex | SD | |
| TOGARAM1 | SNV | Missense_Mutation | novel | c.3484N>C | p.Asp1162His | p.D1162H | protein_coding | tolerated(0.25) | benign(0.018) | TCGA-A2-A4RW-01 | Breast | breast invasive carcinoma | Female | <65 | III/IV | Unknown | Unknown | SD | |
| TOGARAM1 | SNV | Missense_Mutation | c.3970N>A | p.Asp1324Asn | p.D1324N | protein_coding | deleterious(0.01) | probably_damaging(0.924) | TCGA-A7-A26E-01 | Breast | breast invasive carcinoma | Female | >=65 | III/IV | Chemotherapy | cytoxan | SD | ||
| TOGARAM1 | SNV | Missense_Mutation | rs757020173 | c.3118C>T | p.Pro1040Ser | p.P1040S | protein_coding | tolerated(0.05) | probably_damaging(0.973) | TCGA-A8-A08C-01 | Breast | breast invasive carcinoma | Female | >=65 | I/II | Chemotherapy | 5-fluorouracil | CR | |
| TOGARAM1 | SNV | Missense_Mutation | c.3868N>A | p.Glu1290Lys | p.E1290K | protein_coding | deleterious(0.02) | benign(0.012) | TCGA-AC-A23H-01 | Breast | breast invasive carcinoma | Female | >=65 | I/II | Unknown | Unknown | PD | ||
| TOGARAM1 | SNV | Missense_Mutation | novel | c.2389N>A | p.Gln797Lys | p.Q797K | protein_coding | tolerated(0.1) | benign(0.08) | TCGA-AC-A6IW-01 | Breast | breast invasive carcinoma | Female | >=65 | I/II | Unknown | Unknown | SD | |
| TOGARAM1 | SNV | Missense_Mutation | novel | c.2513N>C | p.Lys838Thr | p.K838T | protein_coding | tolerated(0.06) | possibly_damaging(0.871) | TCGA-AN-A046-01 | Breast | breast invasive carcinoma | Female | >=65 | I/II | Unknown | Unknown | SD | |
| TOGARAM1 | SNV | Missense_Mutation | novel | c.3564N>T | p.Glu1188Asp | p.E1188D | protein_coding | tolerated(0.09) | benign(0.132) | TCGA-AN-A046-01 | Breast | breast invasive carcinoma | Female | >=65 | I/II | Unknown | Unknown | SD | |
| TOGARAM1 | SNV | Missense_Mutation | novel | c.4114N>T | p.Pro1372Ser | p.P1372S | protein_coding | deleterious(0) | possibly_damaging(0.483) | TCGA-AO-A0J3-01 | Breast | breast invasive carcinoma | Female | >=65 | I/II | Chemotherapy | cyclophosphamide | SD |
| Page: 1 2 3 4 5 6 7 8 9 10 11 12 13 14 15 16 17 18 19 20 21 22 23 |
Top |
Related drugs of malignant transformation related genes |
| Identification of chemicals and drugs interact with genes involved in malignant transfromation |
| (DGIdb 4.0) |
| Entrez ID | Symbol | Category | Interaction Types | Drug Claim Name | Drug Name | PMIDs |
| Page: 1 |

Copyright 2023-Present -The University of Texas Health Science Center at Houston |