
|
|||||
|
 | |
| |
| |
| |
| |
| |
|
Gene: TNS3 |
Gene summary for TNS3 |
| Gene information | Species | Human | Gene symbol | TNS3 | Gene ID | 64759 |
| Gene name | tensin 3 | |
| Gene Alias | TEM6 | |
| Cytomap | 7p12.3 | |
| Gene Type | protein-coding | GO ID | GO:0006793 | UniProtAcc | Q68CZ2 |
Top |
Malignant transformation analysis |
| Identification of the aberrant gene expression in precancerous and cancerous lesions by comparing the gene expression of stem-like cells in diseased tissues with normal stem cells |
| Entrez ID | Symbol | Replicates | Species | Organ | Tissue | Adj P-value | Log2FC | Malignancy |
| 64759 | TNS3 | HTA11_347_2000001011 | Human | Colorectum | AD | 8.95e-03 | 4.28e-01 | -0.1954 |
| 64759 | TNS3 | HTA11_696_2000001011 | Human | Colorectum | AD | 3.53e-05 | 4.66e-01 | -0.1464 |
| 64759 | TNS3 | HTA11_99999970781_79442 | Human | Colorectum | MSS | 3.67e-02 | -2.89e-01 | 0.294 |
| 64759 | TNS3 | HTA11_99999965062_69753 | Human | Colorectum | MSI-H | 1.81e-07 | 1.11e+00 | 0.3487 |
| 64759 | TNS3 | HTA11_99999965104_69814 | Human | Colorectum | MSS | 3.89e-14 | 1.02e+00 | 0.281 |
| 64759 | TNS3 | F007 | Human | Colorectum | FAP | 3.77e-06 | 3.91e-01 | 0.1176 |
| 64759 | TNS3 | A002-C-010 | Human | Colorectum | FAP | 2.91e-04 | 1.66e-01 | 0.242 |
| 64759 | TNS3 | A001-C-207 | Human | Colorectum | FAP | 1.01e-03 | -1.05e-01 | 0.1278 |
| 64759 | TNS3 | A015-C-203 | Human | Colorectum | FAP | 5.74e-29 | -3.06e-02 | -0.1294 |
| 64759 | TNS3 | A015-C-204 | Human | Colorectum | FAP | 4.48e-05 | -6.53e-02 | -0.0228 |
| 64759 | TNS3 | A014-C-040 | Human | Colorectum | FAP | 9.01e-03 | 5.14e-03 | -0.1184 |
| 64759 | TNS3 | A002-C-201 | Human | Colorectum | FAP | 1.03e-11 | -1.94e-01 | 0.0324 |
| 64759 | TNS3 | A001-C-119 | Human | Colorectum | FAP | 1.83e-06 | -4.31e-02 | -0.1557 |
| 64759 | TNS3 | A001-C-108 | Human | Colorectum | FAP | 2.80e-17 | -2.33e-02 | -0.0272 |
| 64759 | TNS3 | A002-C-021 | Human | Colorectum | FAP | 2.33e-06 | 3.85e-01 | 0.1171 |
| 64759 | TNS3 | A002-C-205 | Human | Colorectum | FAP | 4.32e-23 | 3.25e-02 | -0.1236 |
| 64759 | TNS3 | A001-C-104 | Human | Colorectum | FAP | 8.02e-04 | 1.15e-01 | 0.0184 |
| 64759 | TNS3 | A015-C-005 | Human | Colorectum | FAP | 1.40e-03 | 2.58e-01 | -0.0336 |
| 64759 | TNS3 | A015-C-006 | Human | Colorectum | FAP | 3.87e-15 | -1.68e-01 | -0.0994 |
| 64759 | TNS3 | A015-C-106 | Human | Colorectum | FAP | 4.37e-13 | 7.37e-02 | -0.0511 |
| Page: 1 2 3 4 5 6 7 |
| Tissue | Expression Dynamics | Abbreviation |
| Colorectum (GSE201348) |  | FAP: Familial adenomatous polyposis |
| CRC: Colorectal cancer | ||
| Colorectum (HTA11) |  | AD: Adenomas |
| SER: Sessile serrated lesions | ||
| MSI-H: Microsatellite-high colorectal cancer | ||
| MSS: Microsatellite stable colorectal cancer | ||
| Endometrium |  | AEH: Atypical endometrial hyperplasia |
| EEC: Endometrioid Cancer | ||
| Esophagus |  | ESCC: Esophageal squamous cell carcinoma |
| HGIN: High-grade intraepithelial neoplasias | ||
| LGIN: Low-grade intraepithelial neoplasias | ||
| Liver | 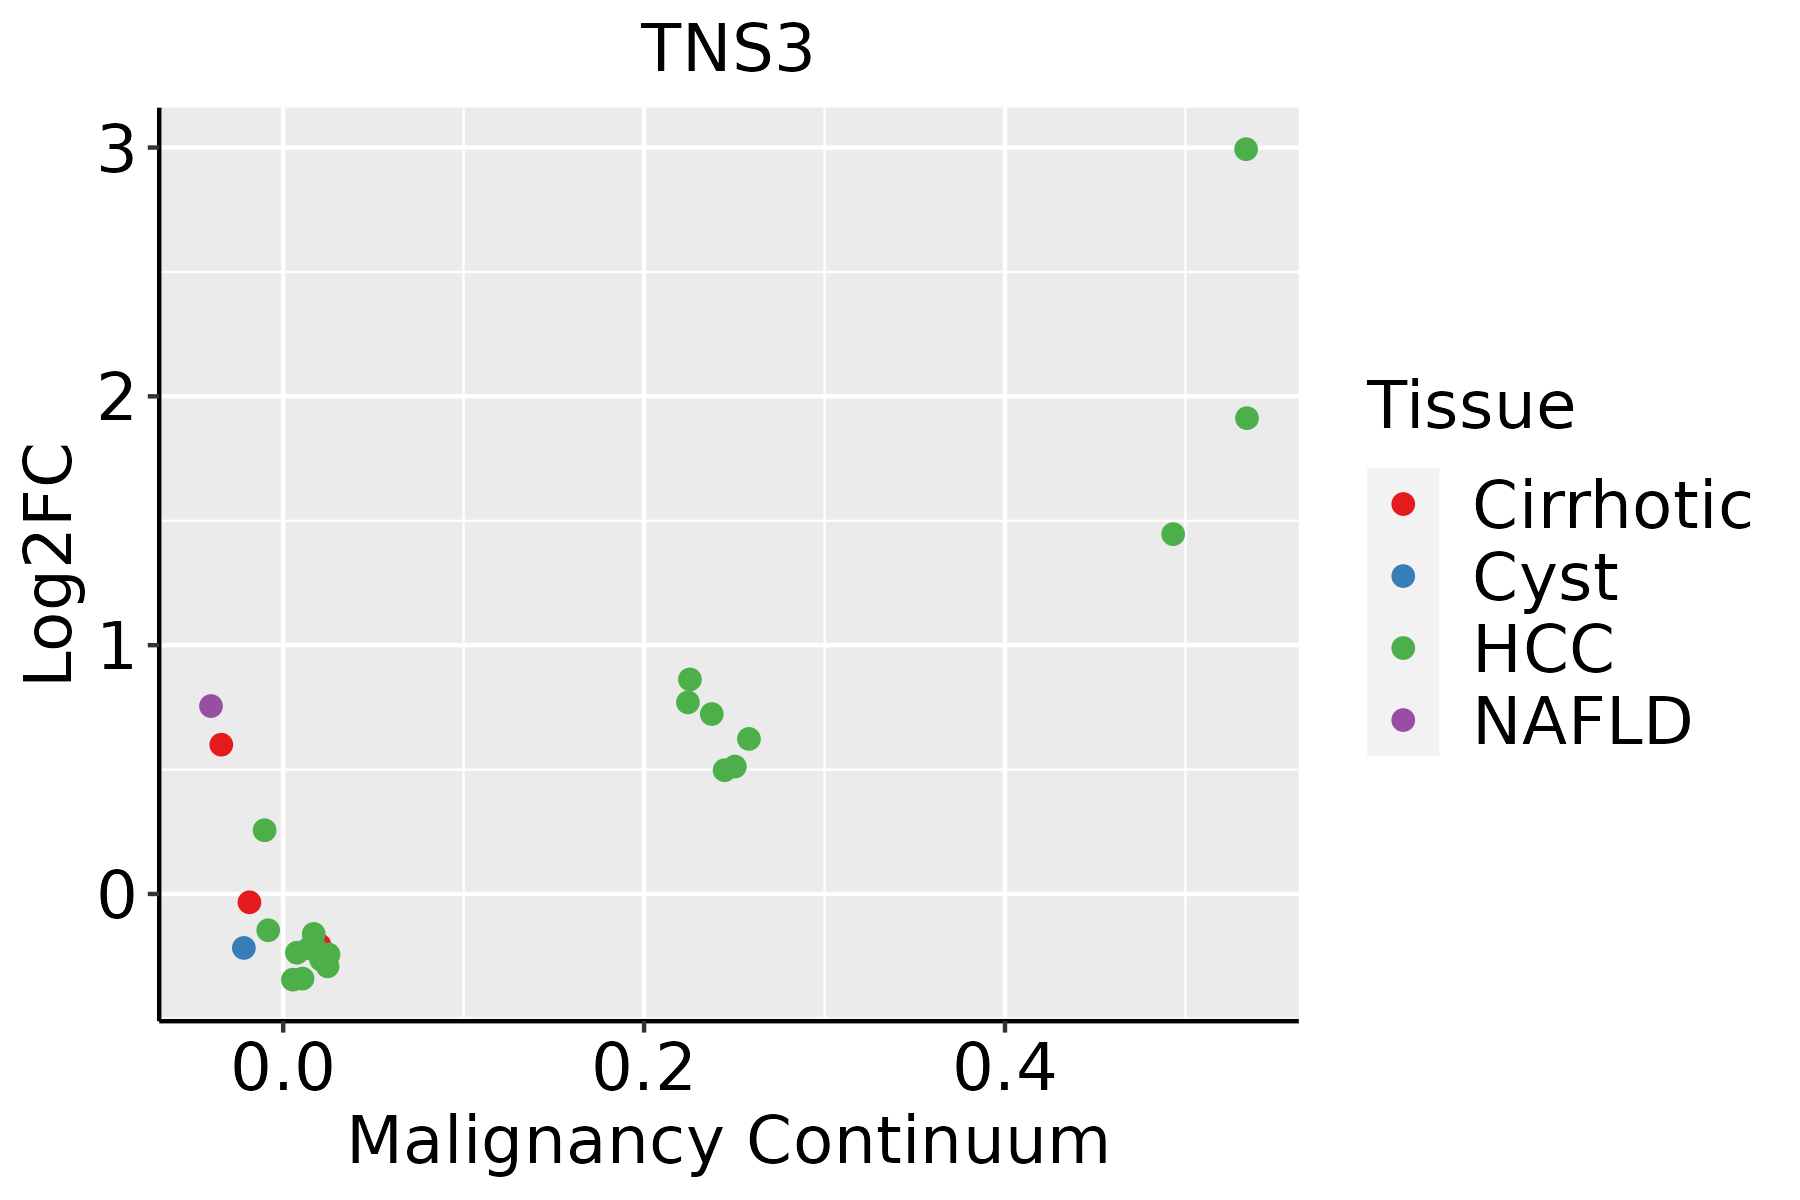 | HCC: Hepatocellular carcinoma |
| NAFLD: Non-alcoholic fatty liver disease | ||
| Prostate | 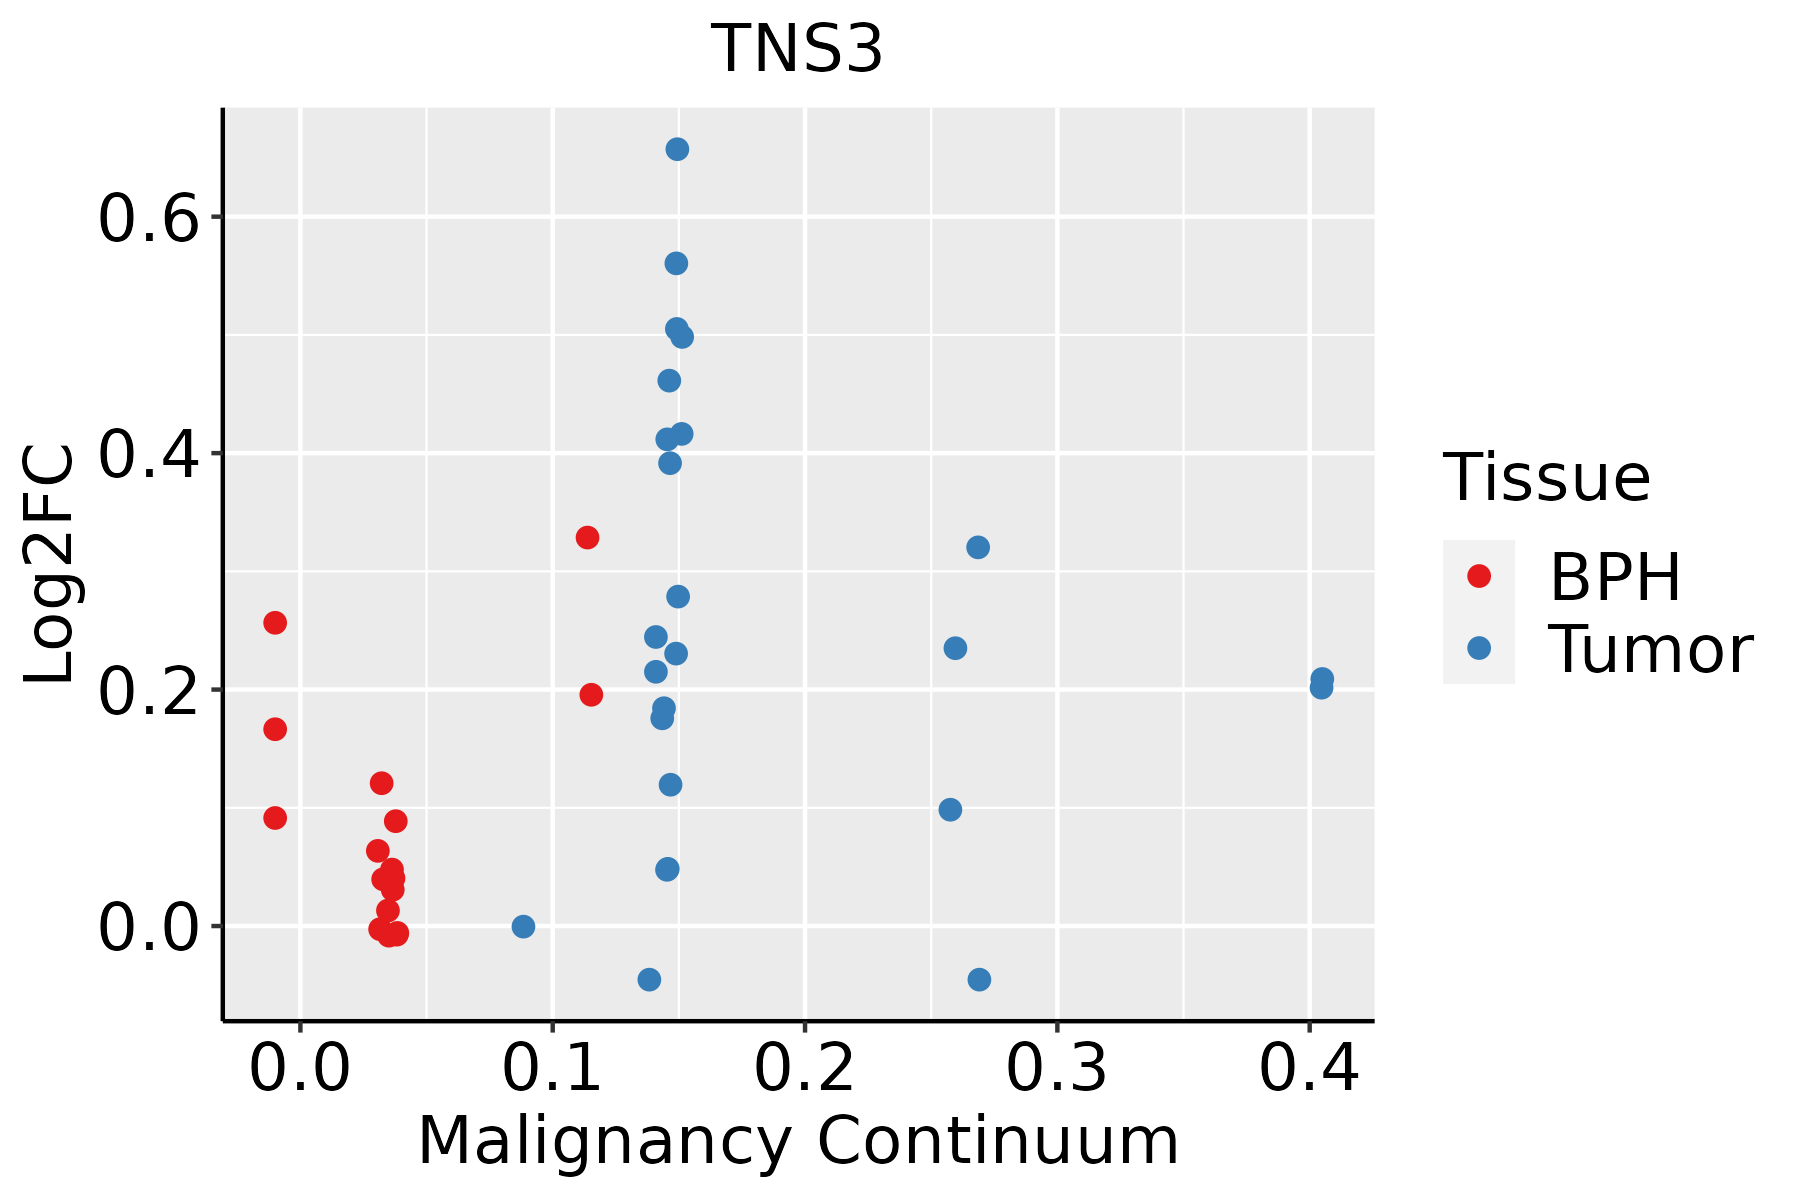 | BPH: Benign Prostatic Hyperplasia |
| Thyroid |  | ATC: Anaplastic thyroid cancer |
| HT: Hashimoto's thyroiditis | ||
| PTC: Papillary thyroid cancer |
| ∗log2FC in expression of this searched gene in stem-like cells from each diseased tissue sample relative to stem-like cells in normal samples in each tissue plotted against the malignancy continuum. Samples are colored based on if they are from different disease stage. |
Top |
Malignant transformation related pathway analysis |
| Find out the enriched GO biological processes and KEGG pathways involved in transition from healthy to precancer to cancer |
| Tissue | Disease Stage | Enriched GO biological Processes |
| Colorectum | AD |  |
| Colorectum | SER |  |
| Colorectum | MSS |  |
| Colorectum | MSI-H |  |
| Colorectum | FAP |  |
| ∗Top 15 enriched GO BP terms are showed in the bar plot of each disease state in each tissue. Each row represents a significant GO biological process which is colored according to the -log10(p.adjust). |
| Page: 1 2 3 4 5 6 7 8 9 |
| GO ID | Tissue | Disease Stage | Description | Gene Ratio | Bg Ratio | pvalue | p.adjust | Count |
| GO:0016311 | Colorectum | AD | dephosphorylation | 123/3918 | 417/18723 | 1.84e-05 | 3.82e-04 | 123 |
| GO:00163112 | Colorectum | MSS | dephosphorylation | 101/3467 | 417/18723 | 1.98e-03 | 1.70e-02 | 101 |
| GO:00163113 | Colorectum | FAP | dephosphorylation | 95/2622 | 417/18723 | 7.07e-07 | 3.32e-05 | 95 |
| GO:00163114 | Colorectum | CRC | dephosphorylation | 79/2078 | 417/18723 | 1.27e-06 | 7.21e-05 | 79 |
| GO:001631110 | Esophagus | ESCC | dephosphorylation | 251/8552 | 417/18723 | 1.26e-09 | 2.99e-08 | 251 |
| GO:00163115 | Liver | NAFLD | dephosphorylation | 69/1882 | 417/18723 | 2.27e-05 | 6.23e-04 | 69 |
| GO:001631111 | Liver | Cirrhotic | dephosphorylation | 130/4634 | 417/18723 | 1.58e-03 | 1.03e-02 | 130 |
| GO:001631121 | Liver | HCC | dephosphorylation | 230/7958 | 417/18723 | 1.00e-07 | 1.96e-06 | 230 |
| GO:00163118 | Prostate | BPH | dephosphorylation | 98/3107 | 417/18723 | 1.53e-04 | 1.35e-03 | 98 |
| GO:001631113 | Prostate | Tumor | dephosphorylation | 98/3246 | 417/18723 | 7.31e-04 | 5.08e-03 | 98 |
| GO:001631116 | Thyroid | PTC | dephosphorylation | 174/5968 | 417/18723 | 1.20e-05 | 1.31e-04 | 174 |
| GO:001631117 | Thyroid | ATC | dephosphorylation | 179/6293 | 417/18723 | 3.88e-05 | 3.15e-04 | 179 |
| Page: 1 |
| Pathway ID | Tissue | Disease Stage | Description | Gene Ratio | Bg Ratio | pvalue | p.adjust | qvalue | Count |
| Page: 1 |
Top |
Cell-cell communication analysis |
| Identification of potential cell-cell interactions between two cell types and their ligand-receptor pairs for different disease states |
| Ligand | Receptor | LRpair | Pathway | Tissue | Disease Stage |
| Page: 1 |
Top |
Single-cell gene regulatory network inference analysis |
| Find out the significant the regulons (TFs) and the target genes of each regulon across cell types for different disease states |
| TF | Cell Type | Tissue | Disease Stage | Target Gene | RSS | Regulon Activity |
| ∗The dot plots of a searched regulon are shown for all cell subpopulations in each disease state of each tissue based on the regulon specific score inferred using pySCENIC and by calculating the average expression. |
| Page: 1 |
Top |
Somatic mutation of malignant transformation related genes |
| Annotation of somatic variants for genes involved in malignant transformation |
| Hugo Symbol | Variant Class | Variant Classification | dbSNP RS | HGVSc | HGVSp | HGVSp Short | SWISSPROT | BIOTYPE | SIFT | PolyPhen | Tumor Sample Barcode | Tissue | Histology | Sex | Age | Stage | Therapy Types | Drugs | Outcome |
| TNS3 | SNV | Missense_Mutation | c.3706N>T | p.His1236Tyr | p.H1236Y | Q68CZ2 | protein_coding | deleterious(0) | probably_damaging(0.985) | TCGA-A8-A06Z-01 | Breast | breast invasive carcinoma | Female | >=65 | I/II | Unknown | Unknown | SD | |
| TNS3 | SNV | Missense_Mutation | novel | c.3300G>T | p.Glu1100Asp | p.E1100D | Q68CZ2 | protein_coding | deleterious(0.01) | probably_damaging(0.937) | TCGA-AN-A046-01 | Breast | breast invasive carcinoma | Female | >=65 | I/II | Unknown | Unknown | SD |
| TNS3 | SNV | Missense_Mutation | c.925G>A | p.Glu309Lys | p.E309K | Q68CZ2 | protein_coding | deleterious(0.02) | benign(0.122) | TCGA-AN-A046-01 | Breast | breast invasive carcinoma | Female | >=65 | I/II | Unknown | Unknown | SD | |
| TNS3 | SNV | Missense_Mutation | novel | c.394G>A | p.Asp132Asn | p.D132N | Q68CZ2 | protein_coding | deleterious(0.01) | probably_damaging(0.996) | TCGA-AN-A046-01 | Breast | breast invasive carcinoma | Female | >=65 | I/II | Unknown | Unknown | SD |
| TNS3 | SNV | Missense_Mutation | rs777401189 | c.2221N>T | p.Arg741Trp | p.R741W | Q68CZ2 | protein_coding | deleterious(0.01) | benign(0.001) | TCGA-AN-A0AK-01 | Breast | breast invasive carcinoma | Female | >=65 | I/II | Unknown | Unknown | SD |
| TNS3 | SNV | Missense_Mutation | c.2197C>G | p.Pro733Ala | p.P733A | Q68CZ2 | protein_coding | tolerated(0.66) | benign(0.039) | TCGA-AQ-A0Y5-01 | Breast | breast invasive carcinoma | Female | >=65 | III/IV | Chemotherapy | cytoxan | SD | |
| TNS3 | SNV | Missense_Mutation | c.880N>T | p.Val294Phe | p.V294F | Q68CZ2 | protein_coding | deleterious(0) | possibly_damaging(0.543) | TCGA-AR-A0TP-01 | Breast | breast invasive carcinoma | Female | <65 | I/II | Chemotherapy | doxorubicin | SD | |
| TNS3 | SNV | Missense_Mutation | c.1385N>C | p.Val462Ala | p.V462A | Q68CZ2 | protein_coding | deleterious(0) | probably_damaging(0.991) | TCGA-BH-A18G-01 | Breast | breast invasive carcinoma | Female | >=65 | I/II | Unknown | Unknown | SD | |
| TNS3 | SNV | Missense_Mutation | rs771976581 | c.1517A>C | p.His506Pro | p.H506P | Q68CZ2 | protein_coding | tolerated(0.16) | benign(0.003) | TCGA-D8-A1JB-01 | Breast | breast invasive carcinoma | Female | <65 | I/II | Chemotherapy | adriamycin | SD |
| TNS3 | SNV | Missense_Mutation | novel | c.3503C>G | p.Thr1168Ser | p.T1168S | Q68CZ2 | protein_coding | deleterious(0) | probably_damaging(0.991) | TCGA-E2-A9RU-01 | Breast | breast invasive carcinoma | Female | >=65 | III/IV | Hormone Therapy | arimidex | SD |
| Page: 1 2 3 4 5 6 7 8 9 10 11 12 13 14 15 16 17 18 19 |
Top |
Related drugs of malignant transformation related genes |
| Identification of chemicals and drugs interact with genes involved in malignant transfromation |
| (DGIdb 4.0) |
| Entrez ID | Symbol | Category | Interaction Types | Drug Claim Name | Drug Name | PMIDs |
| Page: 1 |

Copyright 2023-Present -The University of Texas Health Science Center at Houston |