
|
|||||
|
 | |
| |
| |
| |
| |
| |
|
Gene: TNS2 |
Gene summary for TNS2 |
| Gene information | Species | Human | Gene symbol | TNS2 | Gene ID | 23371 |
| Gene name | tensin 2 | |
| Gene Alias | C1-TEN | |
| Cytomap | 12q13.13 | |
| Gene Type | protein-coding | GO ID | GO:0001655 | UniProtAcc | Q63HR2 |
Top |
Malignant transformation analysis |
| Identification of the aberrant gene expression in precancerous and cancerous lesions by comparing the gene expression of stem-like cells in diseased tissues with normal stem cells |
| Entrez ID | Symbol | Replicates | Species | Organ | Tissue | Adj P-value | Log2FC | Malignancy |
| 23371 | TNS2 | male-WTA | Human | Thyroid | PTC | 4.03e-08 | 1.12e-01 | 0.1037 |
| 23371 | TNS2 | PTC01 | Human | Thyroid | PTC | 5.84e-08 | 1.30e-01 | 0.1899 |
| 23371 | TNS2 | PTC03 | Human | Thyroid | PTC | 6.20e-04 | 2.84e-01 | 0.1784 |
| 23371 | TNS2 | PTC04 | Human | Thyroid | PTC | 1.00e-14 | 3.35e-01 | 0.1927 |
| 23371 | TNS2 | PTC05 | Human | Thyroid | PTC | 5.30e-10 | 3.37e-01 | 0.2065 |
| 23371 | TNS2 | PTC06 | Human | Thyroid | PTC | 4.88e-16 | 3.51e-01 | 0.2057 |
| 23371 | TNS2 | PTC07 | Human | Thyroid | PTC | 5.31e-16 | 3.48e-01 | 0.2044 |
| 23371 | TNS2 | ATC11 | Human | Thyroid | ATC | 1.05e-07 | 5.28e-01 | 0.3386 |
| 23371 | TNS2 | ATC12 | Human | Thyroid | ATC | 2.19e-28 | 6.39e-01 | 0.34 |
| 23371 | TNS2 | ATC13 | Human | Thyroid | ATC | 4.22e-44 | 8.16e-01 | 0.34 |
| 23371 | TNS2 | ATC2 | Human | Thyroid | ATC | 1.68e-10 | 6.19e-01 | 0.34 |
| 23371 | TNS2 | ATC3 | Human | Thyroid | ATC | 2.50e-03 | 2.54e-01 | 0.338 |
| 23371 | TNS2 | ATC4 | Human | Thyroid | ATC | 4.26e-40 | 7.79e-01 | 0.34 |
| 23371 | TNS2 | ATC5 | Human | Thyroid | ATC | 6.96e-46 | 8.79e-01 | 0.34 |
| Page: 1 |
| Tissue | Expression Dynamics | Abbreviation |
| Thyroid | 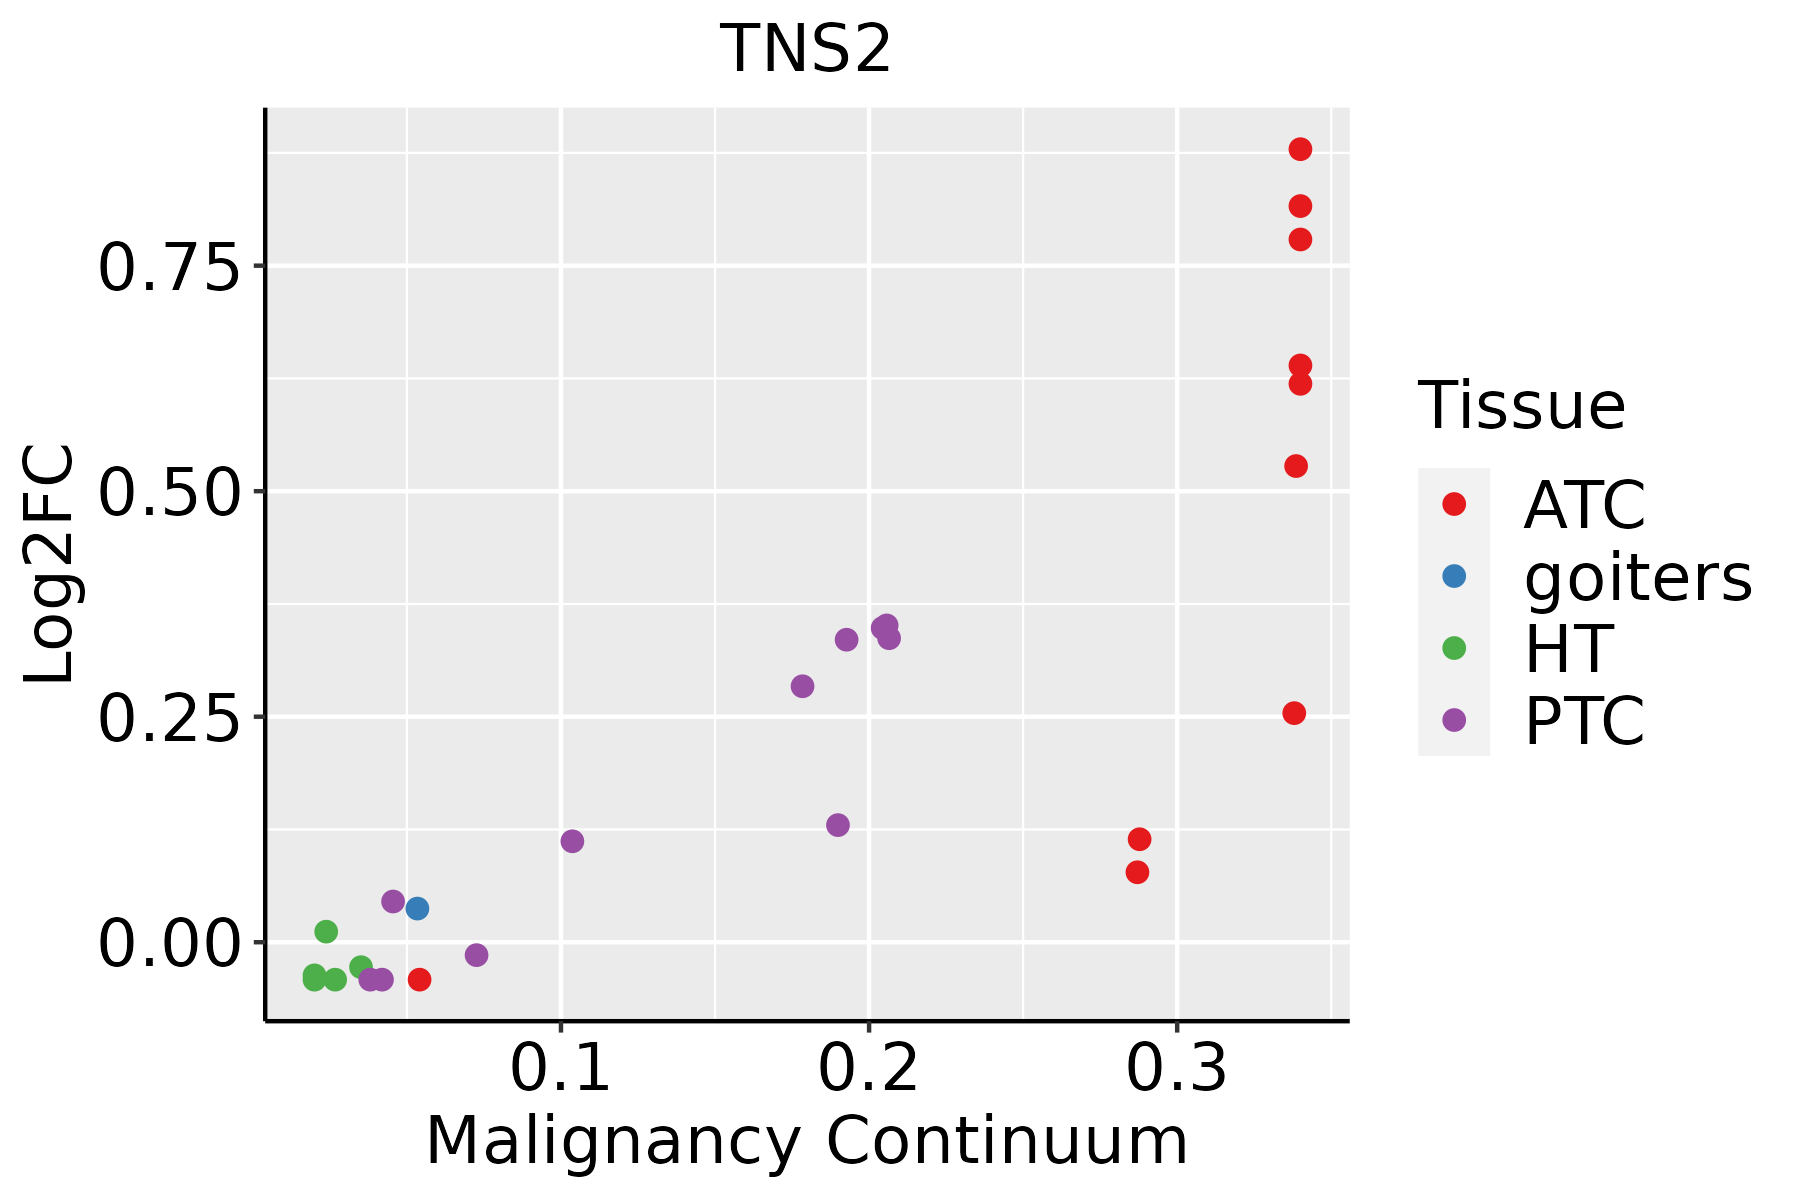 | ATC: Anaplastic thyroid cancer |
| HT: Hashimoto's thyroiditis | ||
| PTC: Papillary thyroid cancer |
| ∗log2FC in expression of this searched gene in stem-like cells from each diseased tissue sample relative to stem-like cells in normal samples in each tissue plotted against the malignancy continuum. Samples are colored based on if they are from different disease stage. |
Top |
Malignant transformation related pathway analysis |
| Find out the enriched GO biological processes and KEGG pathways involved in transition from healthy to precancer to cancer |
| Tissue | Disease Stage | Enriched GO biological Processes |
| Colorectum | AD |  |
| Colorectum | SER |  |
| Colorectum | MSS |  |
| Colorectum | MSI-H |  |
| Colorectum | FAP |  |
| ∗Top 15 enriched GO BP terms are showed in the bar plot of each disease state in each tissue. Each row represents a significant GO biological process which is colored according to the -log10(p.adjust). |
| Page: 1 2 3 4 5 6 7 8 9 |
| GO ID | Tissue | Disease Stage | Description | Gene Ratio | Bg Ratio | pvalue | p.adjust | Count |
| GO:1901653111 | Thyroid | PTC | cellular response to peptide | 169/5968 | 359/18723 | 9.81e-10 | 2.89e-08 | 169 |
| GO:0043434113 | Thyroid | PTC | response to peptide hormone | 188/5968 | 414/18723 | 4.13e-09 | 1.09e-07 | 188 |
| GO:0071375110 | Thyroid | PTC | cellular response to peptide hormone stimulus | 136/5968 | 290/18723 | 5.49e-08 | 1.17e-06 | 136 |
| GO:0032869111 | Thyroid | PTC | cellular response to insulin stimulus | 100/5968 | 203/18723 | 1.70e-07 | 3.19e-06 | 100 |
| GO:0032868111 | Thyroid | PTC | response to insulin | 124/5968 | 264/18723 | 1.87e-07 | 3.47e-06 | 124 |
| GO:000182215 | Thyroid | PTC | kidney development | 133/5968 | 293/18723 | 7.57e-07 | 1.18e-05 | 133 |
| GO:000165517 | Thyroid | PTC | urogenital system development | 149/5968 | 338/18723 | 1.41e-06 | 2.01e-05 | 149 |
| GO:007200114 | Thyroid | PTC | renal system development | 135/5968 | 302/18723 | 1.76e-06 | 2.43e-05 | 135 |
| GO:001631116 | Thyroid | PTC | dephosphorylation | 174/5968 | 417/18723 | 1.20e-05 | 1.31e-04 | 174 |
| GO:000647020 | Thyroid | PTC | protein dephosphorylation | 123/5968 | 281/18723 | 1.69e-05 | 1.77e-04 | 123 |
| GO:000828617 | Thyroid | PTC | insulin receptor signaling pathway | 58/5968 | 116/18723 | 3.59e-05 | 3.36e-04 | 58 |
| GO:00352648 | Thyroid | PTC | multicellular organism growth | 56/5968 | 132/18723 | 6.79e-03 | 2.92e-02 | 56 |
| GO:19000764 | Thyroid | PTC | regulation of cellular response to insulin stimulus | 30/5968 | 64/18723 | 8.53e-03 | 3.58e-02 | 30 |
| GO:000182222 | Thyroid | ATC | kidney development | 146/6293 | 293/18723 | 5.81e-09 | 1.28e-07 | 146 |
| GO:190165325 | Thyroid | ATC | cellular response to peptide | 173/6293 | 359/18723 | 5.87e-09 | 1.28e-07 | 173 |
| GO:000165522 | Thyroid | ATC | urogenital system development | 164/6293 | 338/18723 | 7.92e-09 | 1.70e-07 | 164 |
| GO:007200122 | Thyroid | ATC | renal system development | 149/6293 | 302/18723 | 9.48e-09 | 1.99e-07 | 149 |
| GO:004343428 | Thyroid | ATC | response to peptide hormone | 192/6293 | 414/18723 | 3.63e-08 | 6.70e-07 | 192 |
| GO:007137524 | Thyroid | ATC | cellular response to peptide hormone stimulus | 138/6293 | 290/18723 | 4.90e-07 | 7.05e-06 | 138 |
| GO:003286824 | Thyroid | ATC | response to insulin | 126/6293 | 264/18723 | 1.24e-06 | 1.59e-05 | 126 |
| Page: 1 2 |
| Pathway ID | Tissue | Disease Stage | Description | Gene Ratio | Bg Ratio | pvalue | p.adjust | qvalue | Count |
| Page: 1 |
Top |
Cell-cell communication analysis |
| Identification of potential cell-cell interactions between two cell types and their ligand-receptor pairs for different disease states |
| Ligand | Receptor | LRpair | Pathway | Tissue | Disease Stage |
| Page: 1 |
Top |
Single-cell gene regulatory network inference analysis |
| Find out the significant the regulons (TFs) and the target genes of each regulon across cell types for different disease states |
| TF | Cell Type | Tissue | Disease Stage | Target Gene | RSS | Regulon Activity |
| ∗The dot plots of a searched regulon are shown for all cell subpopulations in each disease state of each tissue based on the regulon specific score inferred using pySCENIC and by calculating the average expression. |
| Page: 1 |
Top |
Somatic mutation of malignant transformation related genes |
| Annotation of somatic variants for genes involved in malignant transformation |
| Hugo Symbol | Variant Class | Variant Classification | dbSNP RS | HGVSc | HGVSp | HGVSp Short | SWISSPROT | BIOTYPE | SIFT | PolyPhen | Tumor Sample Barcode | Tissue | Histology | Sex | Age | Stage | Therapy Types | Drugs | Outcome |
| TNS2 | SNV | Missense_Mutation | c.2309N>T | p.Ala770Val | p.A770V | Q63HR2 | protein_coding | tolerated(0.55) | benign(0.003) | TCGA-C8-A12L-01 | Breast | breast invasive carcinoma | Female | >=65 | I/II | Unknown | Unknown | SD | |
| TNS2 | SNV | Missense_Mutation | novel | c.387N>A | p.Phe129Leu | p.F129L | Q63HR2 | protein_coding | tolerated(0.18) | probably_damaging(0.915) | TCGA-E9-A54Y-01 | Breast | breast invasive carcinoma | Female | <65 | III/IV | Unknown | Unknown | SD |
| TNS2 | SNV | Missense_Mutation | c.976N>C | p.Glu326Gln | p.E326Q | Q63HR2 | protein_coding | tolerated(0.39) | benign(0.135) | TCGA-GM-A2DO-01 | Breast | breast invasive carcinoma | Female | <65 | I/II | Hormone Therapy | tamoxiphen | CR | |
| TNS2 | SNV | Missense_Mutation | novel | c.1082G>C | p.Cys361Ser | p.C361S | Q63HR2 | protein_coding | deleterious(0) | benign(0.35) | TCGA-PE-A5DC-01 | Breast | breast invasive carcinoma | Female | >=65 | III/IV | Unknown | Unknown | SD |
| TNS2 | SNV | Missense_Mutation | rs771164737 | c.2704C>T | p.Arg902Trp | p.R902W | Q63HR2 | protein_coding | deleterious(0.01) | possibly_damaging(0.863) | TCGA-C5-A1MJ-01 | Cervix | cervical & endocervical cancer | Female | <65 | I/II | Unknown | Unknown | SD |
| TNS2 | SNV | Missense_Mutation | rs151178618 | c.2860N>A | p.Glu954Lys | p.E954K | Q63HR2 | protein_coding | tolerated(0.29) | benign(0.411) | TCGA-C5-A7UH-01 | Cervix | cervical & endocervical cancer | Female | <65 | III/IV | Chemotherapy | cisplatin | SD |
| TNS2 | SNV | Missense_Mutation | novel | c.236N>A | p.Arg79Lys | p.R79K | Q63HR2 | protein_coding | tolerated(0.93) | benign(0.028) | TCGA-UC-A7PG-06 | Cervix | cervical & endocervical cancer | Female | <65 | III/IV | Chemotherapy | cisplatin | PD |
| TNS2 | SNV | Missense_Mutation | rs778756703 | c.4253G>A | p.Arg1418Lys | p.R1418K | Q63HR2 | protein_coding | tolerated(0.45) | benign(0.033) | TCGA-VS-A94X-01 | Cervix | cervical & endocervical cancer | Female | <65 | I/II | Chemotherapy | cisplatin | PD |
| TNS2 | SNV | Missense_Mutation | novel | c.1603N>A | p.Ala535Thr | p.A535T | Q63HR2 | protein_coding | tolerated(0.63) | benign(0.001) | TCGA-5M-AAT6-01 | Colorectum | colon adenocarcinoma | Female | <65 | III/IV | Unknown | Unknown | PD |
| TNS2 | SNV | Missense_Mutation | novel | c.3821N>A | p.Ser1274Asn | p.S1274N | Q63HR2 | protein_coding | tolerated(0.06) | benign(0.022) | TCGA-AA-3950-01 | Colorectum | colon adenocarcinoma | Female | >=65 | I/II | Unknown | Unknown | SD |
| Page: 1 2 3 4 5 6 7 8 9 10 11 12 |
Top |
Related drugs of malignant transformation related genes |
| Identification of chemicals and drugs interact with genes involved in malignant transfromation |
| (DGIdb 4.0) |
| Entrez ID | Symbol | Category | Interaction Types | Drug Claim Name | Drug Name | PMIDs |
| Page: 1 |

Copyright 2023-Present -The University of Texas Health Science Center at Houston |