
|
|||||
|
 | |
| |
| |
| |
| |
| |
|
Gene: TNS1 |
Gene summary for TNS1 |
| Gene information | Species | Human | Gene symbol | TNS1 | Gene ID | 7145 |
| Gene name | tensin 1 | |
| Gene Alias | MST091 | |
| Cytomap | 2q35 | |
| Gene Type | protein-coding | GO ID | GO:0005575 | UniProtAcc | B7Z6H8 |
Top |
Malignant transformation analysis |
| Identification of the aberrant gene expression in precancerous and cancerous lesions by comparing the gene expression of stem-like cells in diseased tissues with normal stem cells |
| Entrez ID | Symbol | Replicates | Species | Organ | Tissue | Adj P-value | Log2FC | Malignancy |
| 7145 | TNS1 | NAFLD1 | Human | Liver | NAFLD | 2.41e-08 | 8.91e-01 | -0.04 |
| 7145 | TNS1 | S43 | Human | Liver | Cirrhotic | 3.07e-17 | 2.12e-01 | -0.0187 |
| 7145 | TNS1 | HCC1_Meng | Human | Liver | HCC | 4.43e-13 | -2.65e-01 | 0.0246 |
| 7145 | TNS1 | HCC2_Meng | Human | Liver | HCC | 1.76e-06 | -2.50e-01 | 0.0107 |
| 7145 | TNS1 | cirrhotic3 | Human | Liver | Cirrhotic | 1.86e-02 | 7.84e-04 | 0.0215 |
| 7145 | TNS1 | HCC2 | Human | Liver | HCC | 6.71e-06 | 2.72e+00 | 0.5341 |
| 7145 | TNS1 | HCC5 | Human | Liver | HCC | 1.15e-05 | -2.14e-01 | 0.4932 |
| 7145 | TNS1 | Pt13.b | Human | Liver | HCC | 8.86e-06 | 5.27e-02 | 0.0251 |
| 7145 | TNS1 | 047563_1562-all-cells | Human | Prostate | BPH | 6.34e-07 | 1.47e-01 | 0.0791 |
| 7145 | TNS1 | 048752_1579-all-cells | Human | Prostate | BPH | 1.20e-02 | 2.03e-01 | 0.1008 |
| 7145 | TNS1 | 052095_1628-all-cells | Human | Prostate | BPH | 2.20e-10 | 4.58e-01 | 0.1032 |
| 7145 | TNS1 | 052097_1595-all-cells | Human | Prostate | BPH | 5.92e-09 | 4.10e-01 | 0.0972 |
| 7145 | TNS1 | 052099_1652-all-cells | Human | Prostate | BPH | 3.54e-04 | 2.65e-01 | 0.1038 |
| 7145 | TNS1 | Dong_P1 | Human | Prostate | Tumor | 1.59e-14 | 4.98e-02 | 0.035 |
| 7145 | TNS1 | Dong_P3 | Human | Prostate | Tumor | 1.24e-17 | 1.19e-01 | 0.0278 |
| 7145 | TNS1 | Dong_P4 | Human | Prostate | Tumor | 1.39e-06 | 1.27e-01 | 0.0292 |
| 7145 | TNS1 | P7 | Human | Prostate | Tumor | 3.80e-03 | 5.79e-01 | -0.1025 |
| 7145 | TNS1 | GSM5353221_PA_PB2A_Pool_1_3_S25_L001 | Human | Prostate | Tumor | 1.38e-15 | 8.42e-01 | 0.1633 |
| 7145 | TNS1 | GSM5353222_PA_PB2B_Pool_1_3_S52_L002 | Human | Prostate | Tumor | 2.21e-21 | 9.19e-01 | 0.1608 |
| 7145 | TNS1 | GSM5353223_PA_PB2B_Pool_2_S26_L001 | Human | Prostate | Tumor | 1.15e-10 | 8.16e-01 | 0.1604 |
| Page: 1 2 3 |
| Tissue | Expression Dynamics | Abbreviation |
| Liver | 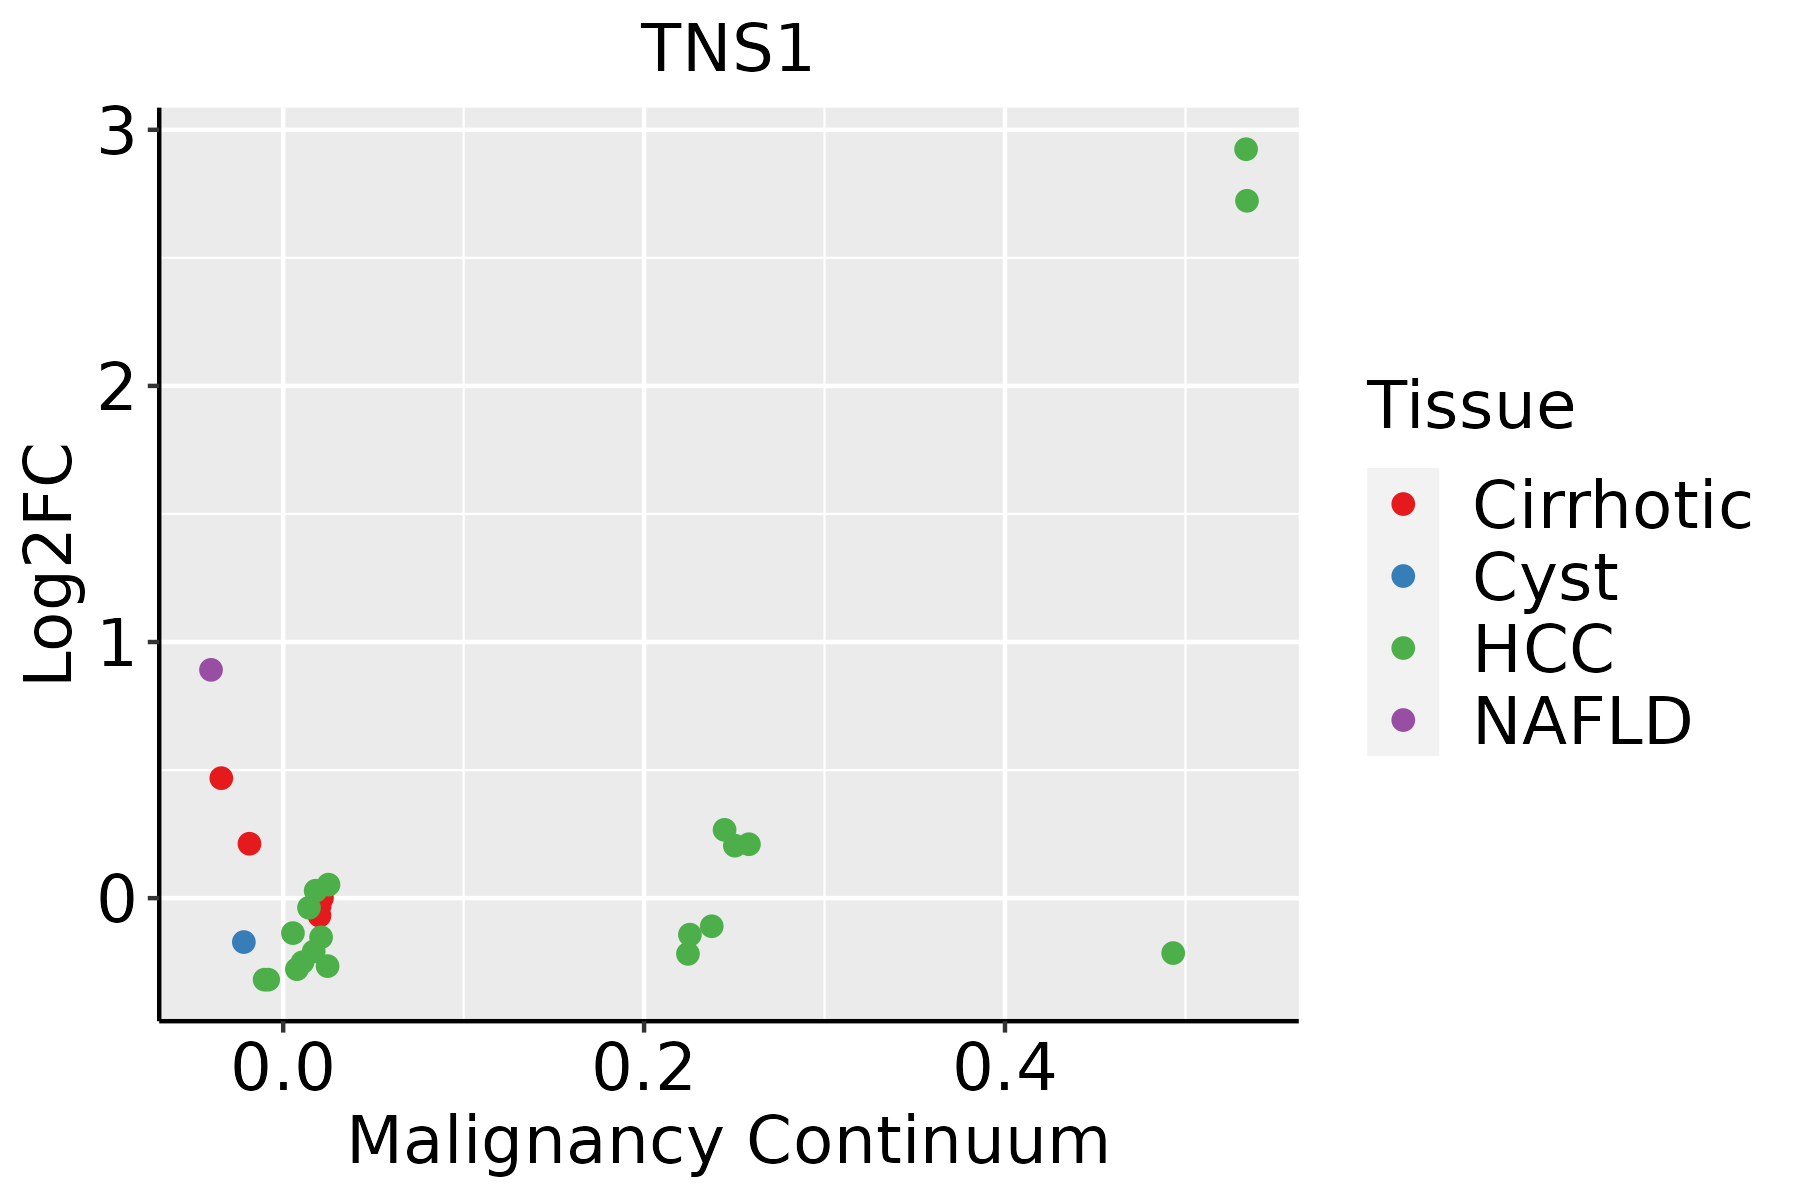 | HCC: Hepatocellular carcinoma |
| NAFLD: Non-alcoholic fatty liver disease | ||
| Prostate | 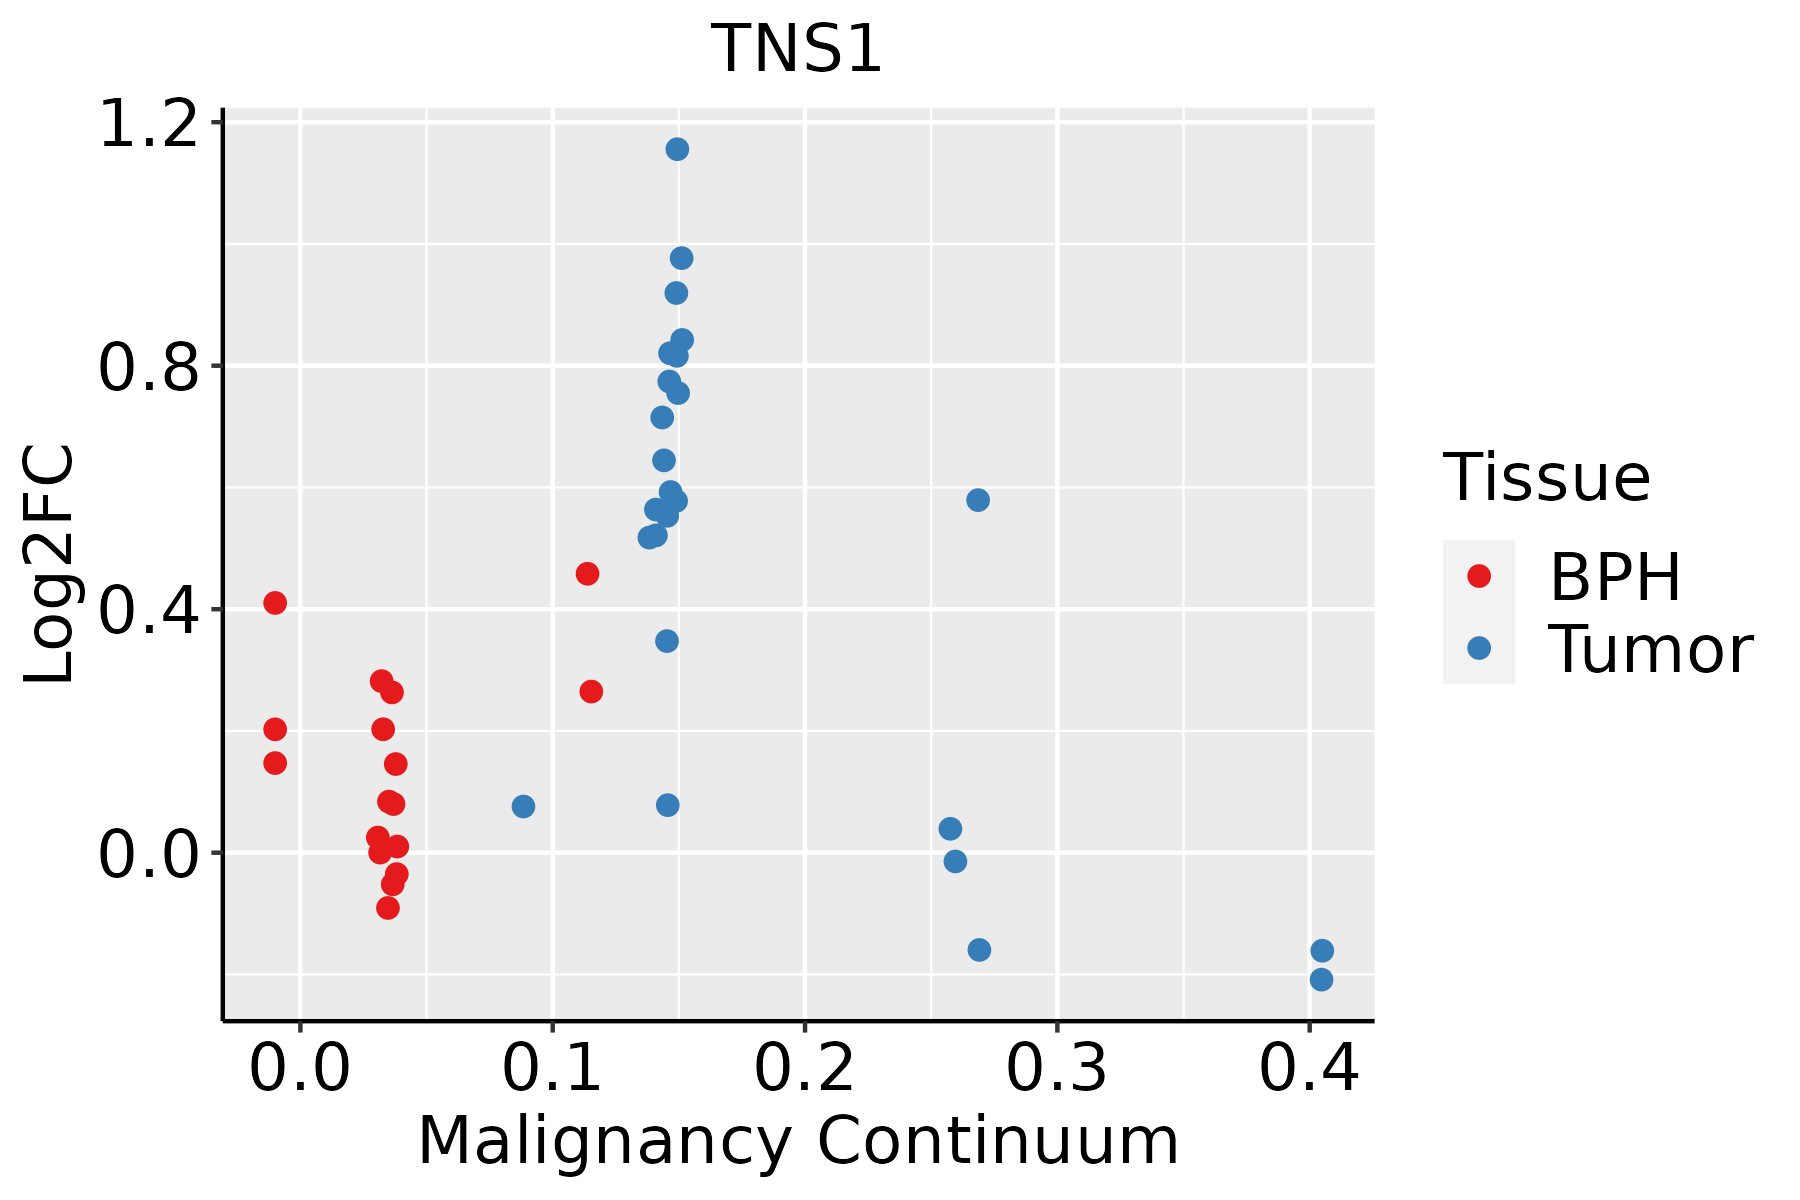 | BPH: Benign Prostatic Hyperplasia |
| Thyroid | 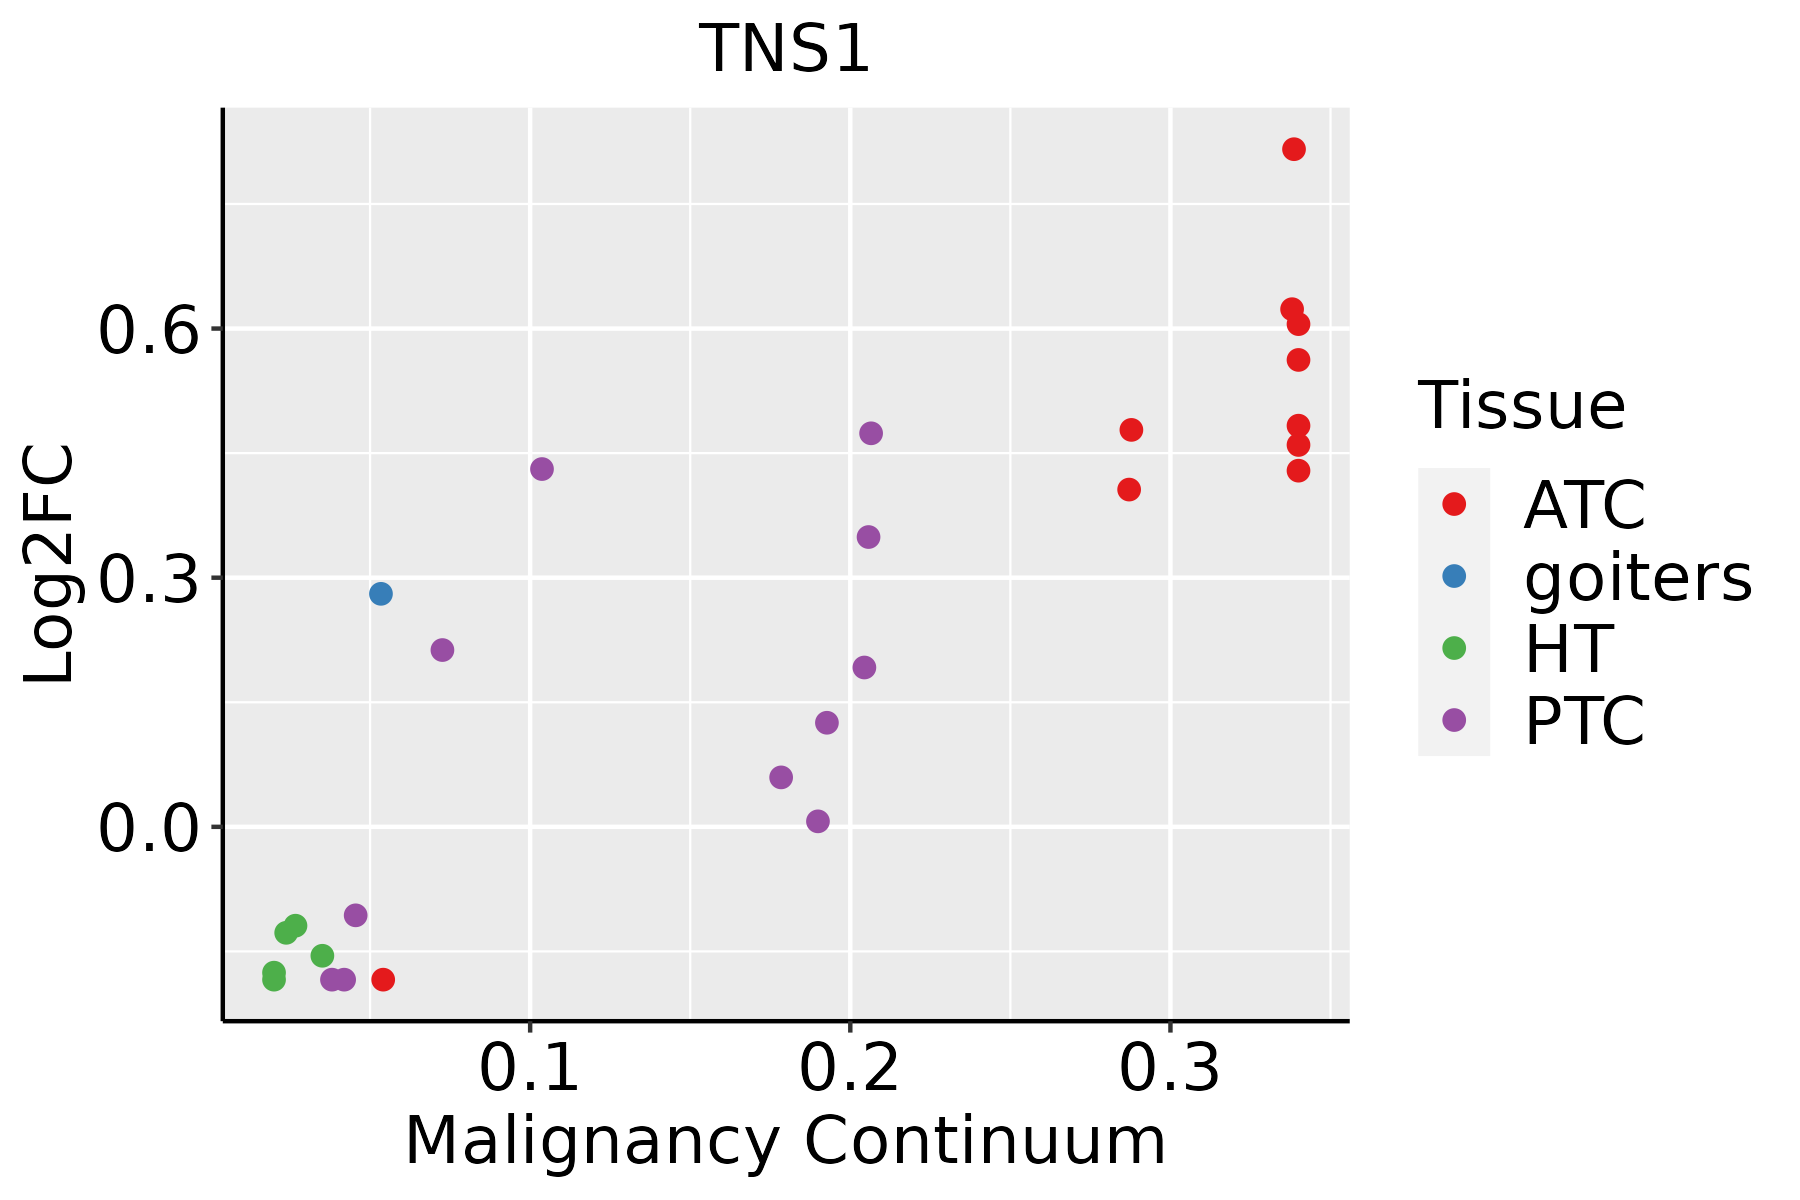 | ATC: Anaplastic thyroid cancer |
| HT: Hashimoto's thyroiditis | ||
| PTC: Papillary thyroid cancer |
| ∗log2FC in expression of this searched gene in stem-like cells from each diseased tissue sample relative to stem-like cells in normal samples in each tissue plotted against the malignancy continuum. Samples are colored based on if they are from different disease stage. |
Top |
Malignant transformation related pathway analysis |
| Find out the enriched GO biological processes and KEGG pathways involved in transition from healthy to precancer to cancer |
| Tissue | Disease Stage | Enriched GO biological Processes |
| Colorectum | AD |  |
| Colorectum | SER |  |
| Colorectum | MSS |  |
| Colorectum | MSI-H |  |
| Colorectum | FAP |  |
| ∗Top 15 enriched GO BP terms are showed in the bar plot of each disease state in each tissue. Each row represents a significant GO biological process which is colored according to the -log10(p.adjust). |
| Page: 1 2 3 4 5 6 7 8 9 |
| GO ID | Tissue | Disease Stage | Description | Gene Ratio | Bg Ratio | pvalue | p.adjust | Count |
| Page: 1 |
| Pathway ID | Tissue | Disease Stage | Description | Gene Ratio | Bg Ratio | pvalue | p.adjust | qvalue | Count |
| Page: 1 |
Top |
Cell-cell communication analysis |
| Identification of potential cell-cell interactions between two cell types and their ligand-receptor pairs for different disease states |
| Ligand | Receptor | LRpair | Pathway | Tissue | Disease Stage |
| Page: 1 |
Top |
Single-cell gene regulatory network inference analysis |
| Find out the significant the regulons (TFs) and the target genes of each regulon across cell types for different disease states |
| TF | Cell Type | Tissue | Disease Stage | Target Gene | RSS | Regulon Activity |
| ∗The dot plots of a searched regulon are shown for all cell subpopulations in each disease state of each tissue based on the regulon specific score inferred using pySCENIC and by calculating the average expression. |
| Page: 1 |
Top |
Somatic mutation of malignant transformation related genes |
| Annotation of somatic variants for genes involved in malignant transformation |
| Hugo Symbol | Variant Class | Variant Classification | dbSNP RS | HGVSc | HGVSp | HGVSp Short | SWISSPROT | BIOTYPE | SIFT | PolyPhen | Tumor Sample Barcode | Tissue | Histology | Sex | Age | Stage | Therapy Types | Drugs | Outcome |
| TNS1 | SNV | Missense_Mutation | c.2866A>T | p.Met956Leu | p.M956L | Q9HBL0 | protein_coding | tolerated(0.29) | benign(0.003) | TCGA-A7-A0CJ-01 | Breast | breast invasive carcinoma | Female | <65 | I/II | Chemotherapy | cytoxan | SD | |
| TNS1 | SNV | Missense_Mutation | c.5195G>T | p.Gly1732Val | p.G1732V | Q9HBL0 | protein_coding | deleterious(0.02) | probably_damaging(0.974) | TCGA-A8-A085-01 | Breast | breast invasive carcinoma | Male | <65 | I/II | Hormone Therapy | tamoxiphen | SD | |
| TNS1 | SNV | Missense_Mutation | c.1648A>G | p.Met550Val | p.M550V | Q9HBL0 | protein_coding | tolerated(0.3) | benign(0) | TCGA-A8-A09W-01 | Breast | breast invasive carcinoma | Female | >=65 | III/IV | Unknown | Unknown | SD | |
| TNS1 | SNV | Missense_Mutation | c.4143N>A | p.Ser1381Arg | p.S1381R | Q9HBL0 | protein_coding | deleterious(0) | probably_damaging(0.996) | TCGA-D8-A1Y1-01 | Breast | breast invasive carcinoma | Female | >=65 | III/IV | Hormone Therapy | tamoxiphen | PD | |
| TNS1 | SNV | Missense_Mutation | c.3221N>A | p.Ser1074Asn | p.S1074N | Q9HBL0 | protein_coding | tolerated(0.12) | possibly_damaging(0.763) | TCGA-E2-A14W-01 | Breast | breast invasive carcinoma | Male | >=65 | I/II | Chemotherapy | cytoxan | SD | |
| TNS1 | SNV | Missense_Mutation | rs762213864 | c.3092G>A | p.Arg1031Gln | p.R1031Q | Q9HBL0 | protein_coding | tolerated(0.09) | benign(0.233) | TCGA-S3-A6ZG-01 | Breast | breast invasive carcinoma | Female | >=65 | I/II | Chemotherapy | doxorubicin | CR |
| TNS1 | insertion | In_Frame_Ins | novel | c.4185_4186insAAG | p.Gly1395_Asp1396insLys | p.G1395_D1396insK | Q9HBL0 | protein_coding | TCGA-A7-A0CE-01 | Breast | breast invasive carcinoma | Female | <65 | I/II | Chemotherapy | adriamycin | SD | ||
| TNS1 | insertion | Frame_Shift_Ins | novel | c.4183_4184insAATCATCATCGAATGGAAAT | p.Gly1395GlufsTer66 | p.G1395Efs*66 | Q9HBL0 | protein_coding | TCGA-A7-A0CE-01 | Breast | breast invasive carcinoma | Female | <65 | I/II | Chemotherapy | adriamycin | SD | ||
| TNS1 | insertion | Nonsense_Mutation | novel | c.2586_2587insTTTTCCTGTTAGTCTTTGCTGAGGACCAGCCCTGTAT | p.Glu863PhefsTer4 | p.E863Ffs*4 | Q9HBL0 | protein_coding | TCGA-A7-A0D9-01 | Breast | breast invasive carcinoma | Female | <65 | I/II | Chemotherapy | taxotere | SD | ||
| TNS1 | insertion | Frame_Shift_Ins | novel | c.355_356insTAAGTGGTAGACCTGAGCTG | p.Arg119IlefsTer9 | p.R119Ifs*9 | Q9HBL0 | protein_coding | TCGA-AN-A04A-01 | Breast | breast invasive carcinoma | Female | <65 | III/IV | Unknown | Unknown | SD |
| Page: 1 2 3 4 5 6 7 8 9 10 11 12 13 14 15 16 17 18 19 20 21 |
Top |
Related drugs of malignant transformation related genes |
| Identification of chemicals and drugs interact with genes involved in malignant transfromation |
| (DGIdb 4.0) |
| Entrez ID | Symbol | Category | Interaction Types | Drug Claim Name | Drug Name | PMIDs |
| Page: 1 |

Copyright 2023-Present -The University of Texas Health Science Center at Houston |