Schematic overview of the cellular and molecular mechanisms involved in the cancer progression, including the proposed cellular and molecular mechanisms in cancer cells trajectory. AT1: alveolar type 1 cells; AT2: alveolar type 2 cells; AAH: atypical adenomatous hyperplasia; AIS: adenocarcinoma in situ; MIA: minimally invasive adenocarcinoma; IA: invasive adenocarcinoma; EMT: epithelial-mesenchymal transition

Home

Download

Statistics

Help

Contact

Center for Computational Systems Medicine
leaf

Gene summary

leaf

Malignant transformation analysis

leaf

Malignant transformation related pathway analysis

leaf

Cell-cell communication analysis

leaf

Single-cell gene regulatory network inference analysis

leaf

Somatic mutation of malignant transformation related genes

leaf

Related drugs of malignant transformation related genes

Gene: TNRC6A

Gene summary for TNRC6A

check button Gene summary.

Gene informationSpeciesHuman
Gene symbol

TNRC6A

Gene ID

27327

Gene nametrinucleotide repeat containing adaptor 6A
Gene AliasCAGH26
Cytomap16p12.1
Gene Typeprotein-coding
GO ID

GO:0000288

UniProtAcc

Q8NDV7


Top

Malignant transformation analysis

check button Identification of the aberrant gene expression in precancerous and cancerous lesions by comparing the gene expression of stem-like cells in diseased tissues with normal stem cells
check button Malignant transformation involving gene list.
Entrez IDSymbolReplicatesSpeciesOrganTissueAdj P-valueLog2FCMalignancy
27327TNRC6ACCI_1HumanCervixCC1.71e-047.48e-010.528
27327TNRC6ACCI_2HumanCervixCC3.83e-101.20e+000.5249
27327TNRC6ACCI_3HumanCervixCC2.73e-111.08e+000.516
27327TNRC6AHTA11_3410_2000001011HumanColorectumAD2.03e-24-6.42e-010.0155
27327TNRC6AHTA11_2487_2000001011HumanColorectumSER6.16e-10-5.43e-01-0.1808
27327TNRC6AHTA11_2951_2000001011HumanColorectumAD4.88e-02-5.76e-010.0216
27327TNRC6AHTA11_1938_2000001011HumanColorectumAD2.16e-04-4.24e-01-0.0811
27327TNRC6AHTA11_3361_2000001011HumanColorectumAD1.26e-12-7.61e-01-0.1207
27327TNRC6AHTA11_83_2000001011HumanColorectumSER1.66e-02-3.95e-01-0.1526
27327TNRC6AHTA11_696_2000001011HumanColorectumAD2.68e-05-3.64e-01-0.1464
27327TNRC6AHTA11_866_2000001011HumanColorectumAD1.91e-02-3.43e-01-0.1001
27327TNRC6AHTA11_5212_2000001011HumanColorectumAD3.09e-04-5.94e-01-0.2061
27327TNRC6AHTA11_5216_2000001011HumanColorectumSER1.94e-04-5.76e-01-0.1462
27327TNRC6AHTA11_546_2000001011HumanColorectumAD3.89e-03-4.30e-01-0.0842
27327TNRC6AHTA11_7862_2000001011HumanColorectumAD1.34e-04-5.34e-01-0.0179
27327TNRC6AHTA11_866_3004761011HumanColorectumAD5.58e-12-4.26e-010.096
27327TNRC6AHTA11_8622_2000001021HumanColorectumSER9.68e-08-7.83e-010.0528
27327TNRC6AHTA11_7696_3000711011HumanColorectumAD9.22e-06-3.36e-010.0674
27327TNRC6AHTA11_99999971662_82457HumanColorectumMSS1.91e-02-3.04e-010.3859
27327TNRC6AHTA11_99999973899_84307HumanColorectumMSS1.84e-03-5.39e-010.2585
Page: 1 2 3 4 5 6 7 8 9 10 11 

check button Transcriptomic changes along malignancy continuum.
TissueExpression DynamicsAbbreviation
CervixThe image shows the transcriptomic changes along malignancy continuum.log2FC in expression of this searched gene in stem-like cells from each diseased tissue sample relative to stem-like cells in normal samples in each tissue plotted against the malignancy continuum. Samples are colored based on if they are from different disease stage.CC: Cervix cancer
HSIL_HPV: HPV-infected high-grade squamous intraepithelial lesions
N_HPV: HPV-infected normal cervix
Colorectum (GSE201348)The image shows the transcriptomic changes along malignancy continuum.log2FC in expression of this searched gene in stem-like cells from each diseased tissue sample relative to stem-like cells in normal samples in each tissue plotted against the malignancy continuum. Samples are colored based on if they are from different disease stage.FAP: Familial adenomatous polyposis
CRC: Colorectal cancer
Colorectum (HTA11)The image shows the transcriptomic changes along malignancy continuum.log2FC in expression of this searched gene in stem-like cells from each diseased tissue sample relative to stem-like cells in normal samples in each tissue plotted against the malignancy continuum. Samples are colored based on if they are from different disease stage.AD: Adenomas
SER: Sessile serrated lesions
MSI-H: Microsatellite-high colorectal cancer
MSS: Microsatellite stable colorectal cancer
EsophagusThe image shows the transcriptomic changes along malignancy continuum.log2FC in expression of this searched gene in stem-like cells from each diseased tissue sample relative to stem-like cells in normal samples in each tissue plotted against the malignancy continuum. Samples are colored based on if they are from different disease stage.
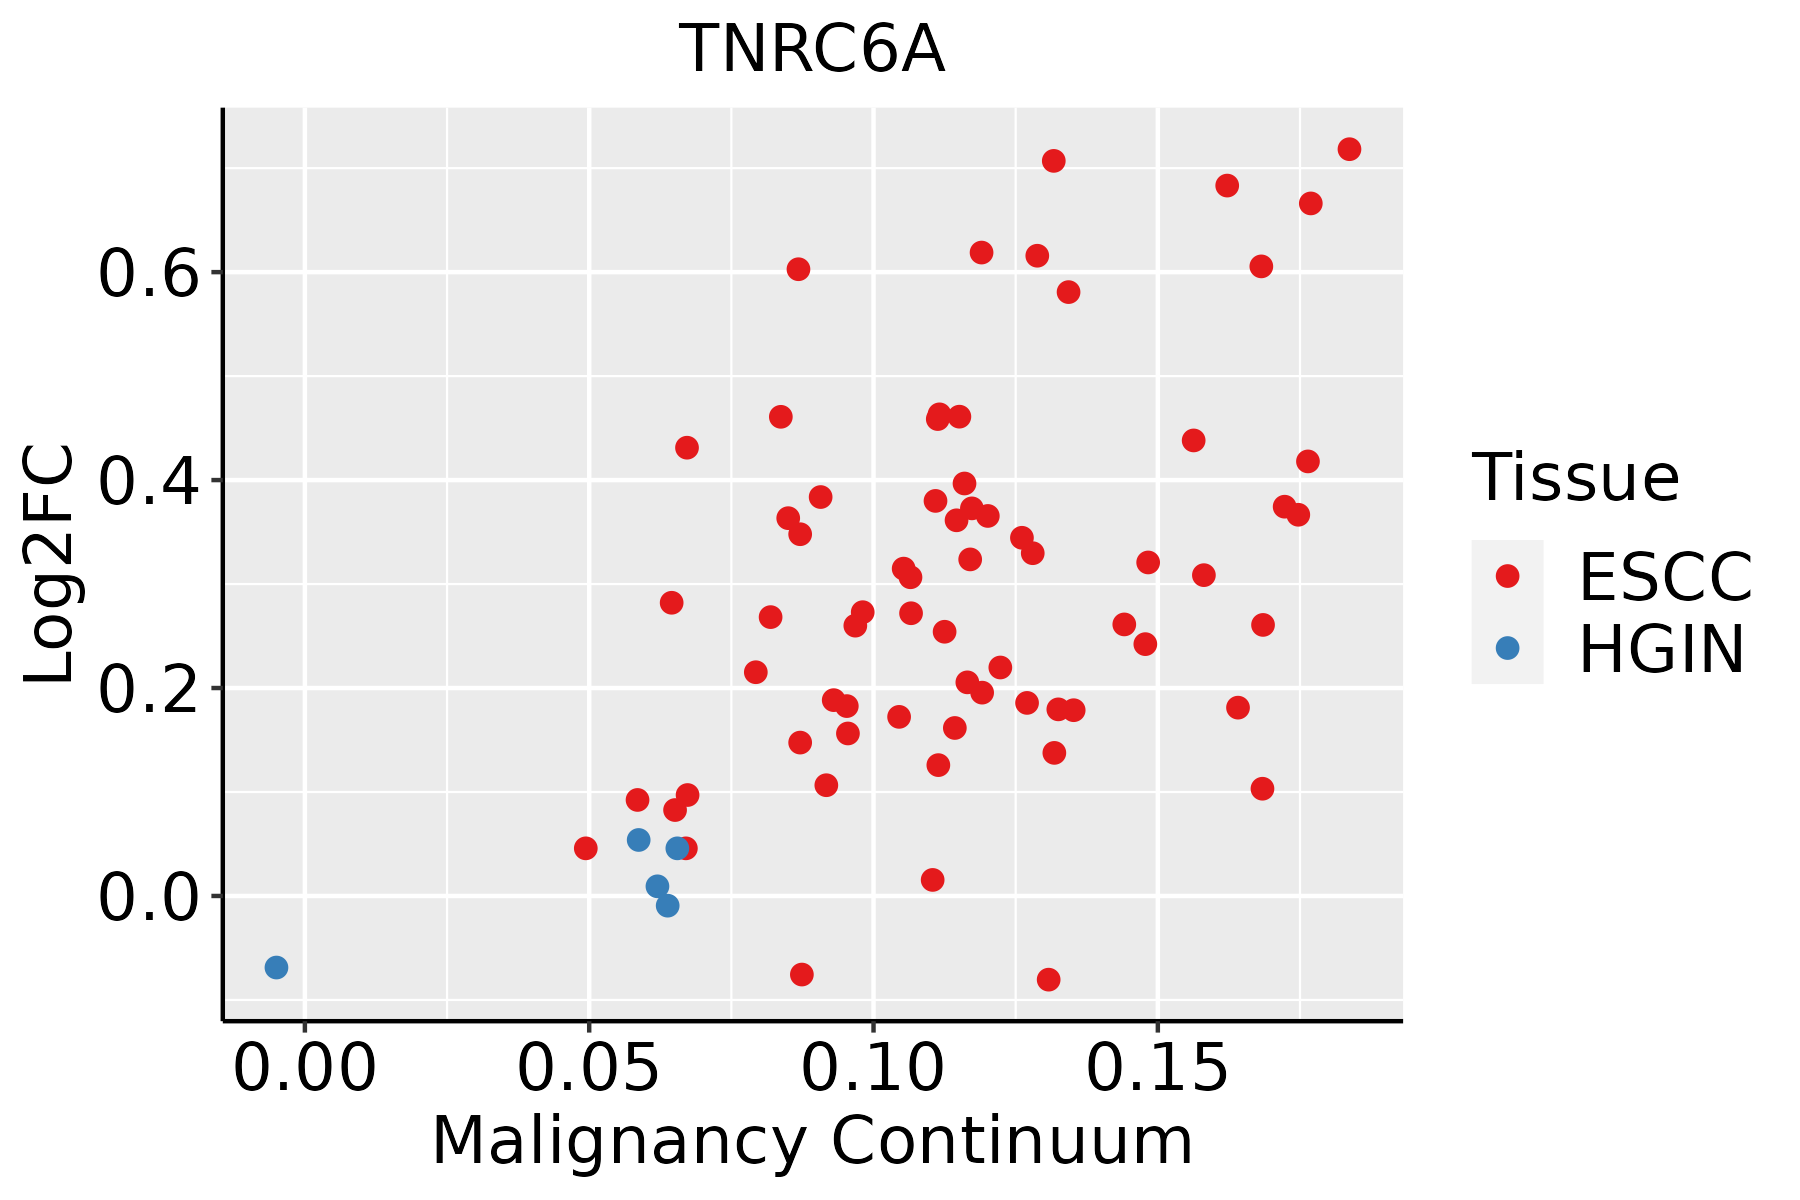
ESCC: Esophageal squamous cell carcinoma
HGIN: High-grade intraepithelial neoplasias
LGIN: Low-grade intraepithelial neoplasias
LiverThe image shows the transcriptomic changes along malignancy continuum.log2FC in expression of this searched gene in stem-like cells from each diseased tissue sample relative to stem-like cells in normal samples in each tissue plotted against the malignancy continuum. Samples are colored based on if they are from different disease stage.
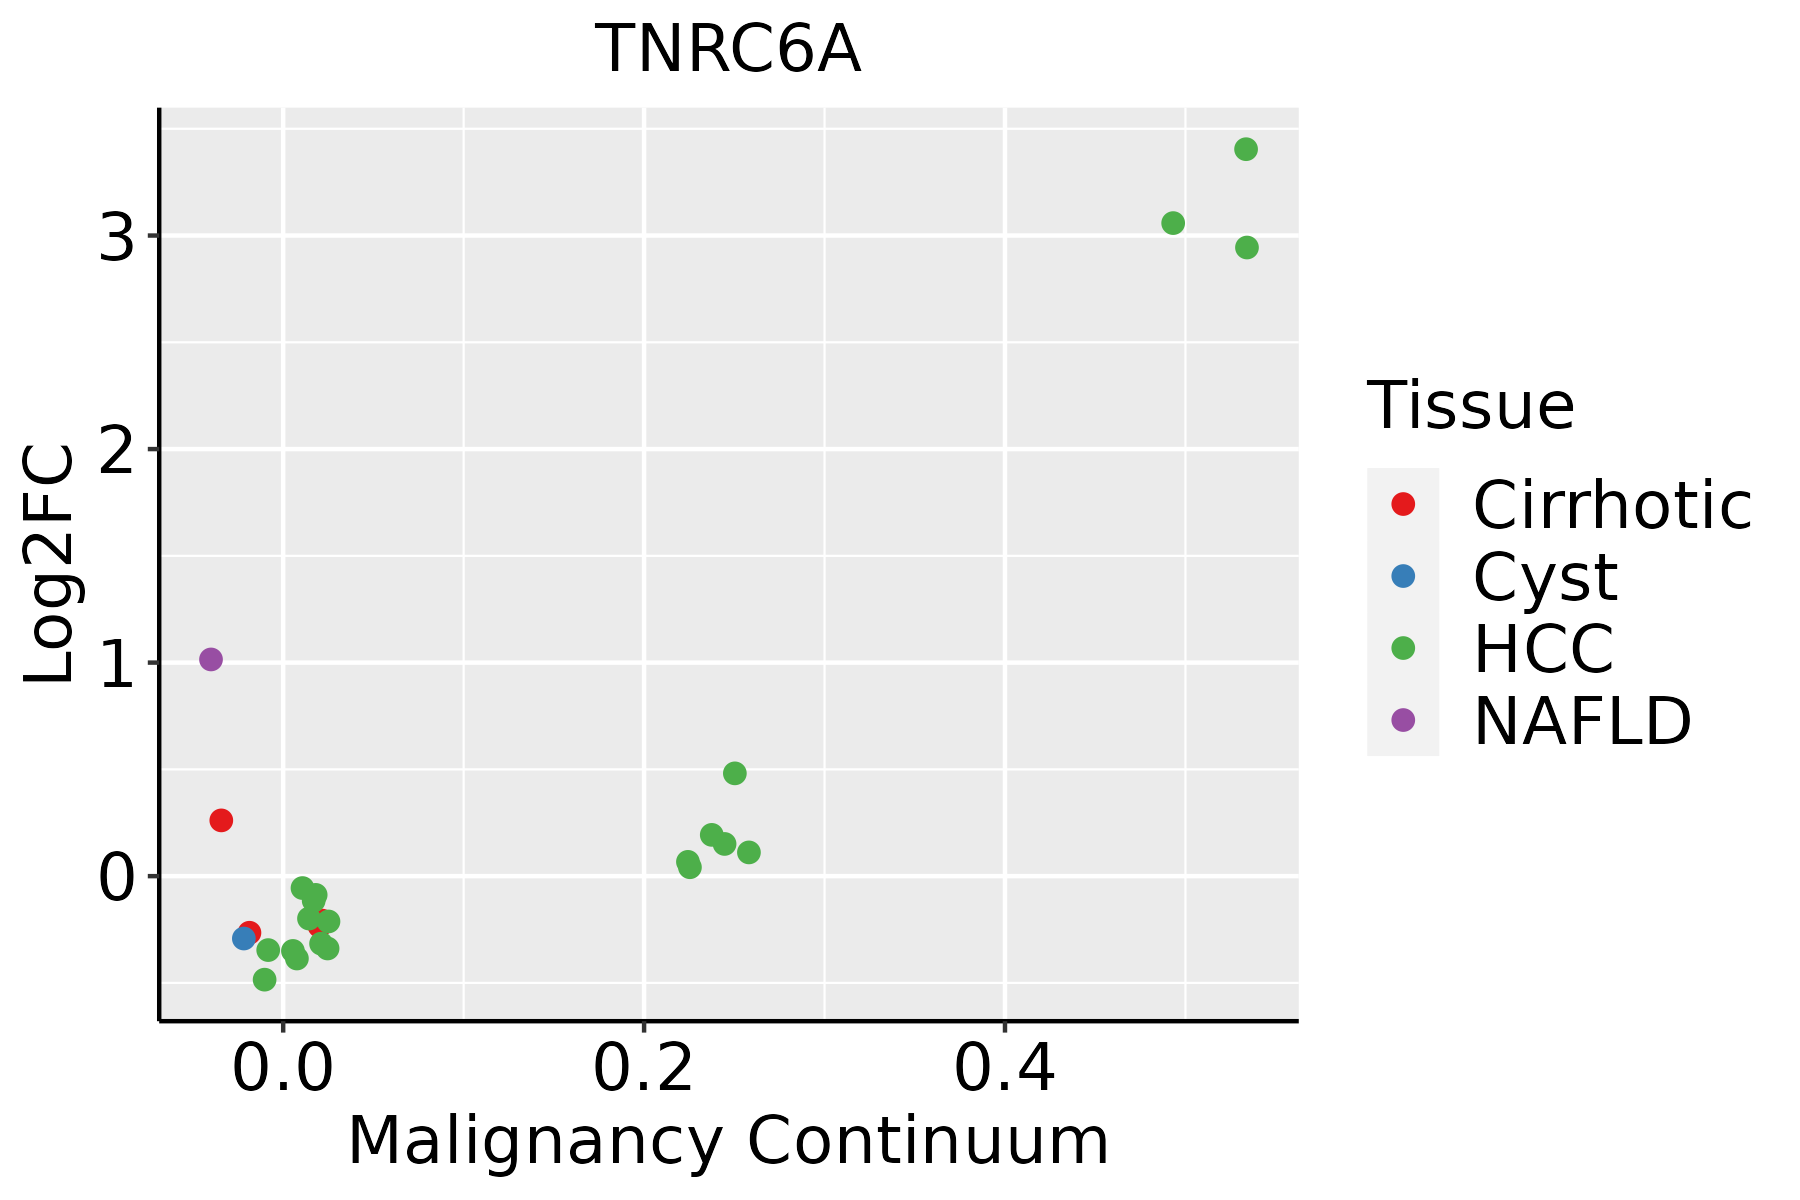
HCC: Hepatocellular carcinoma
NAFLD: Non-alcoholic fatty liver disease
LungThe image shows the transcriptomic changes along malignancy continuum.log2FC in expression of this searched gene in stem-like cells from each diseased tissue sample relative to stem-like cells in normal samples in each tissue plotted against the malignancy continuum. Samples are colored based on if they are from different disease stage.
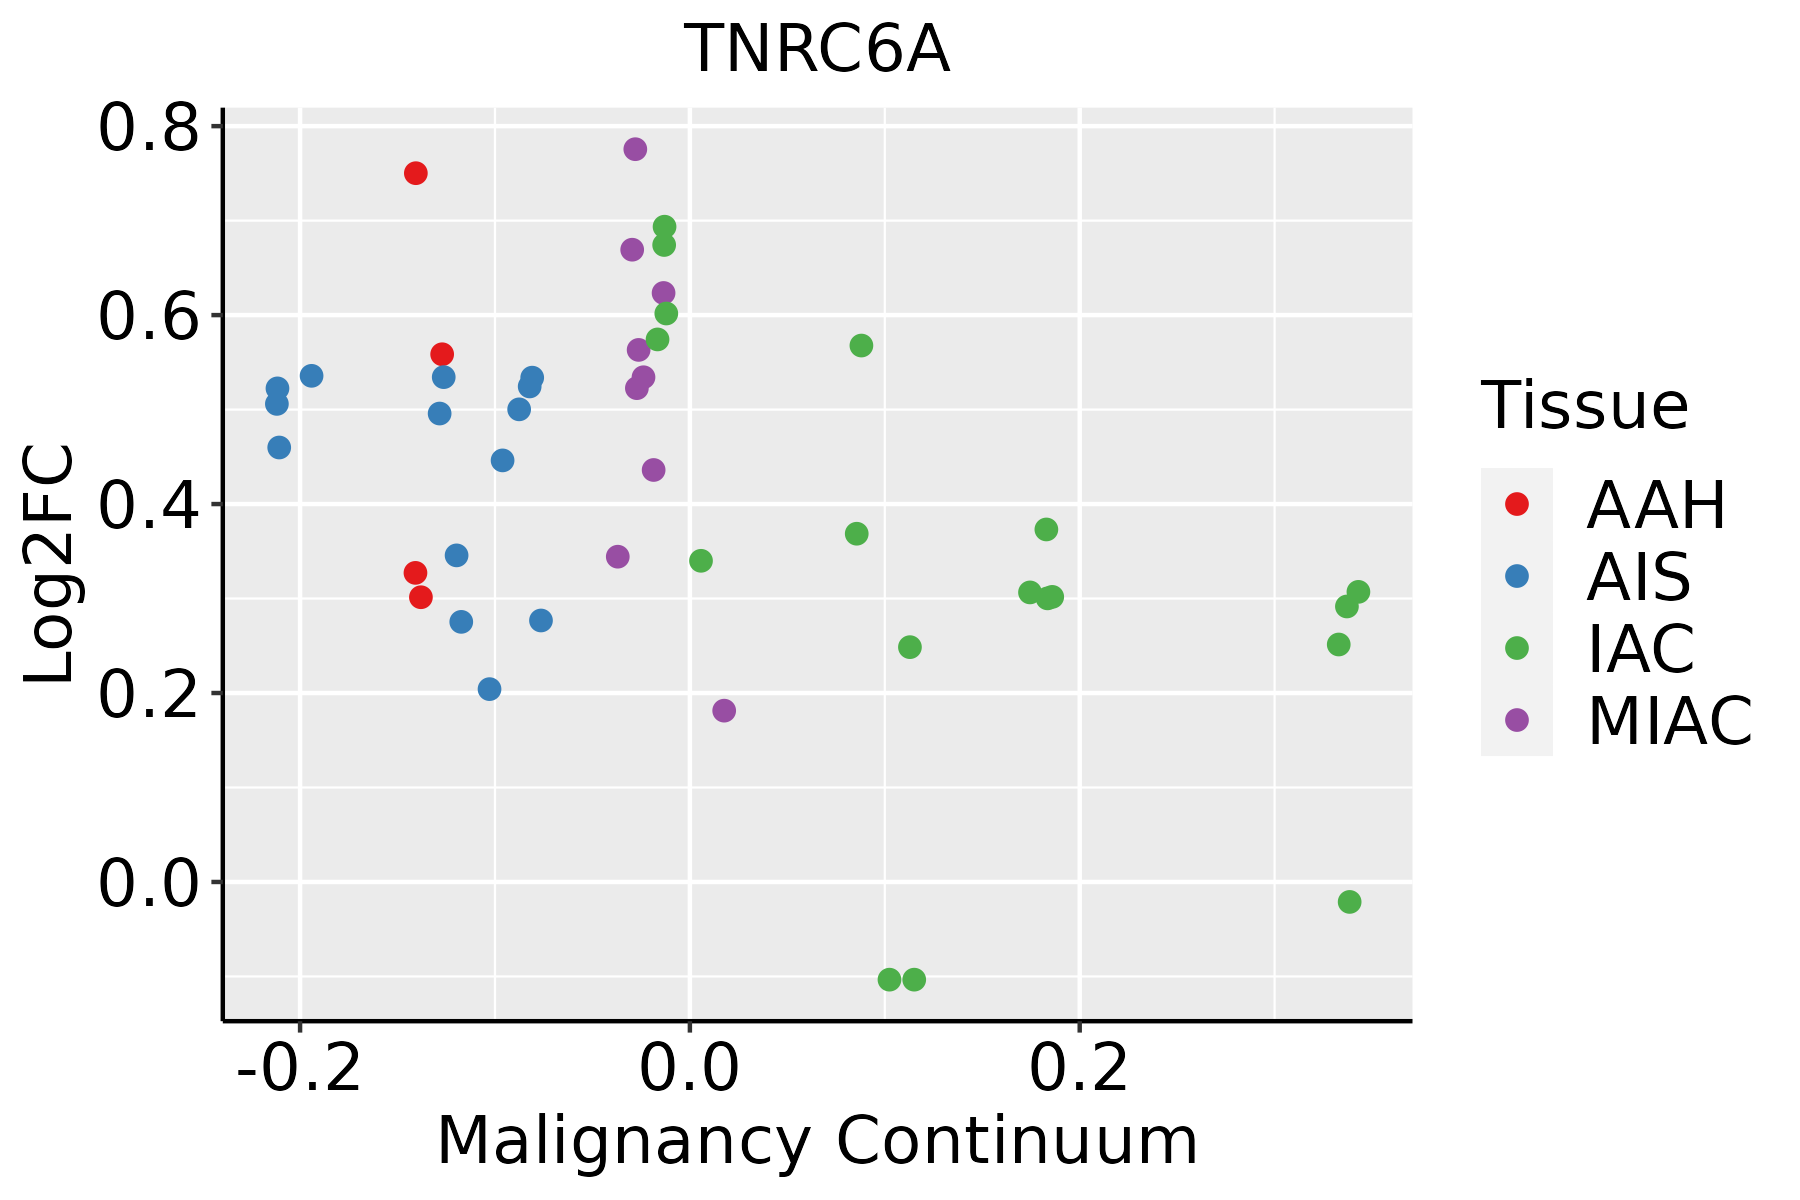
AAH: Atypical adenomatous hyperplasia
AIS: Adenocarcinoma in situ
IAC: Invasive lung adenocarcinoma
MIA: Minimally invasive adenocarcinoma
Oral CavityThe image shows the transcriptomic changes along malignancy continuum.log2FC in expression of this searched gene in stem-like cells from each diseased tissue sample relative to stem-like cells in normal samples in each tissue plotted against the malignancy continuum. Samples are colored based on if they are from different disease stage.
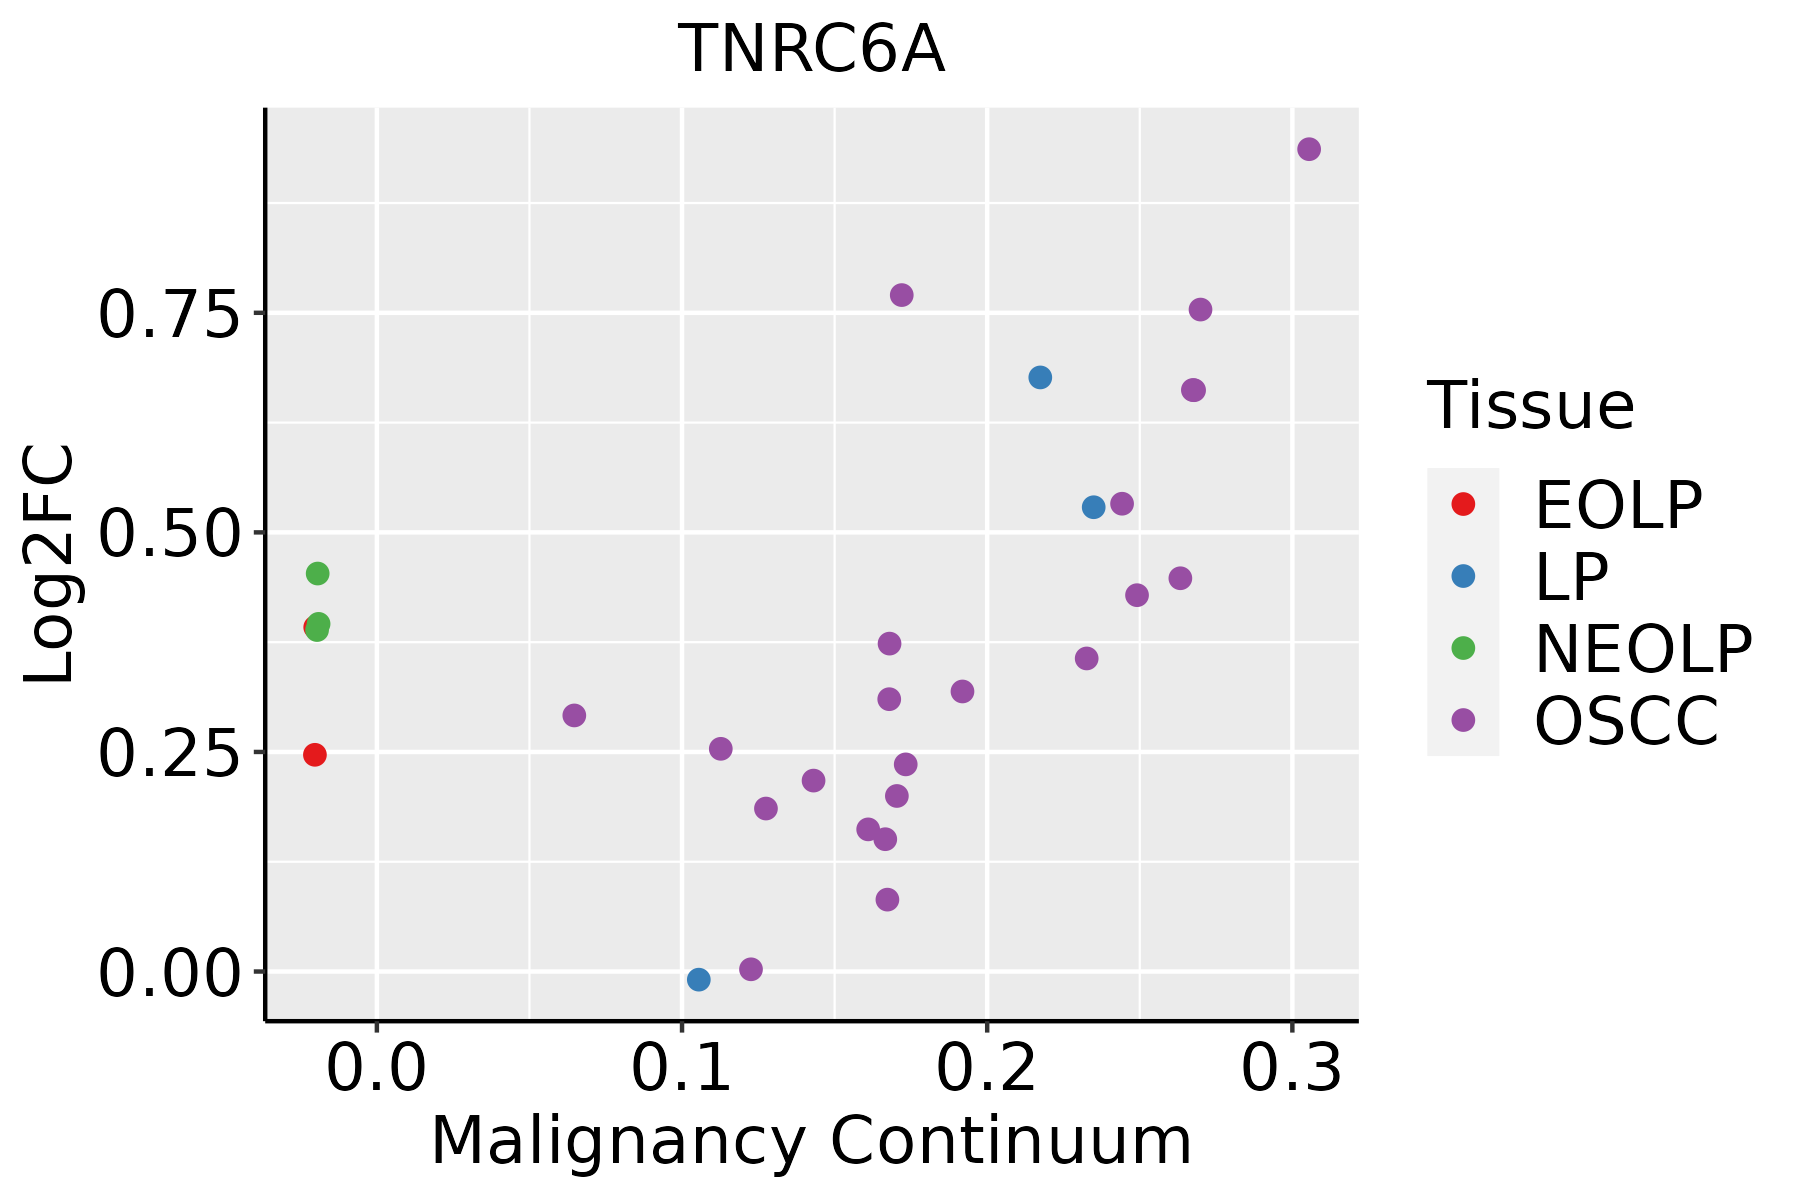
EOLP: Erosive Oral lichen planus
LP: leukoplakia
NEOLP: Non-erosive oral lichen planus
OSCC: Oral squamous cell carcinoma
ProstateThe image shows the transcriptomic changes along malignancy continuum.log2FC in expression of this searched gene in stem-like cells from each diseased tissue sample relative to stem-like cells in normal samples in each tissue plotted against the malignancy continuum. Samples are colored based on if they are from different disease stage.
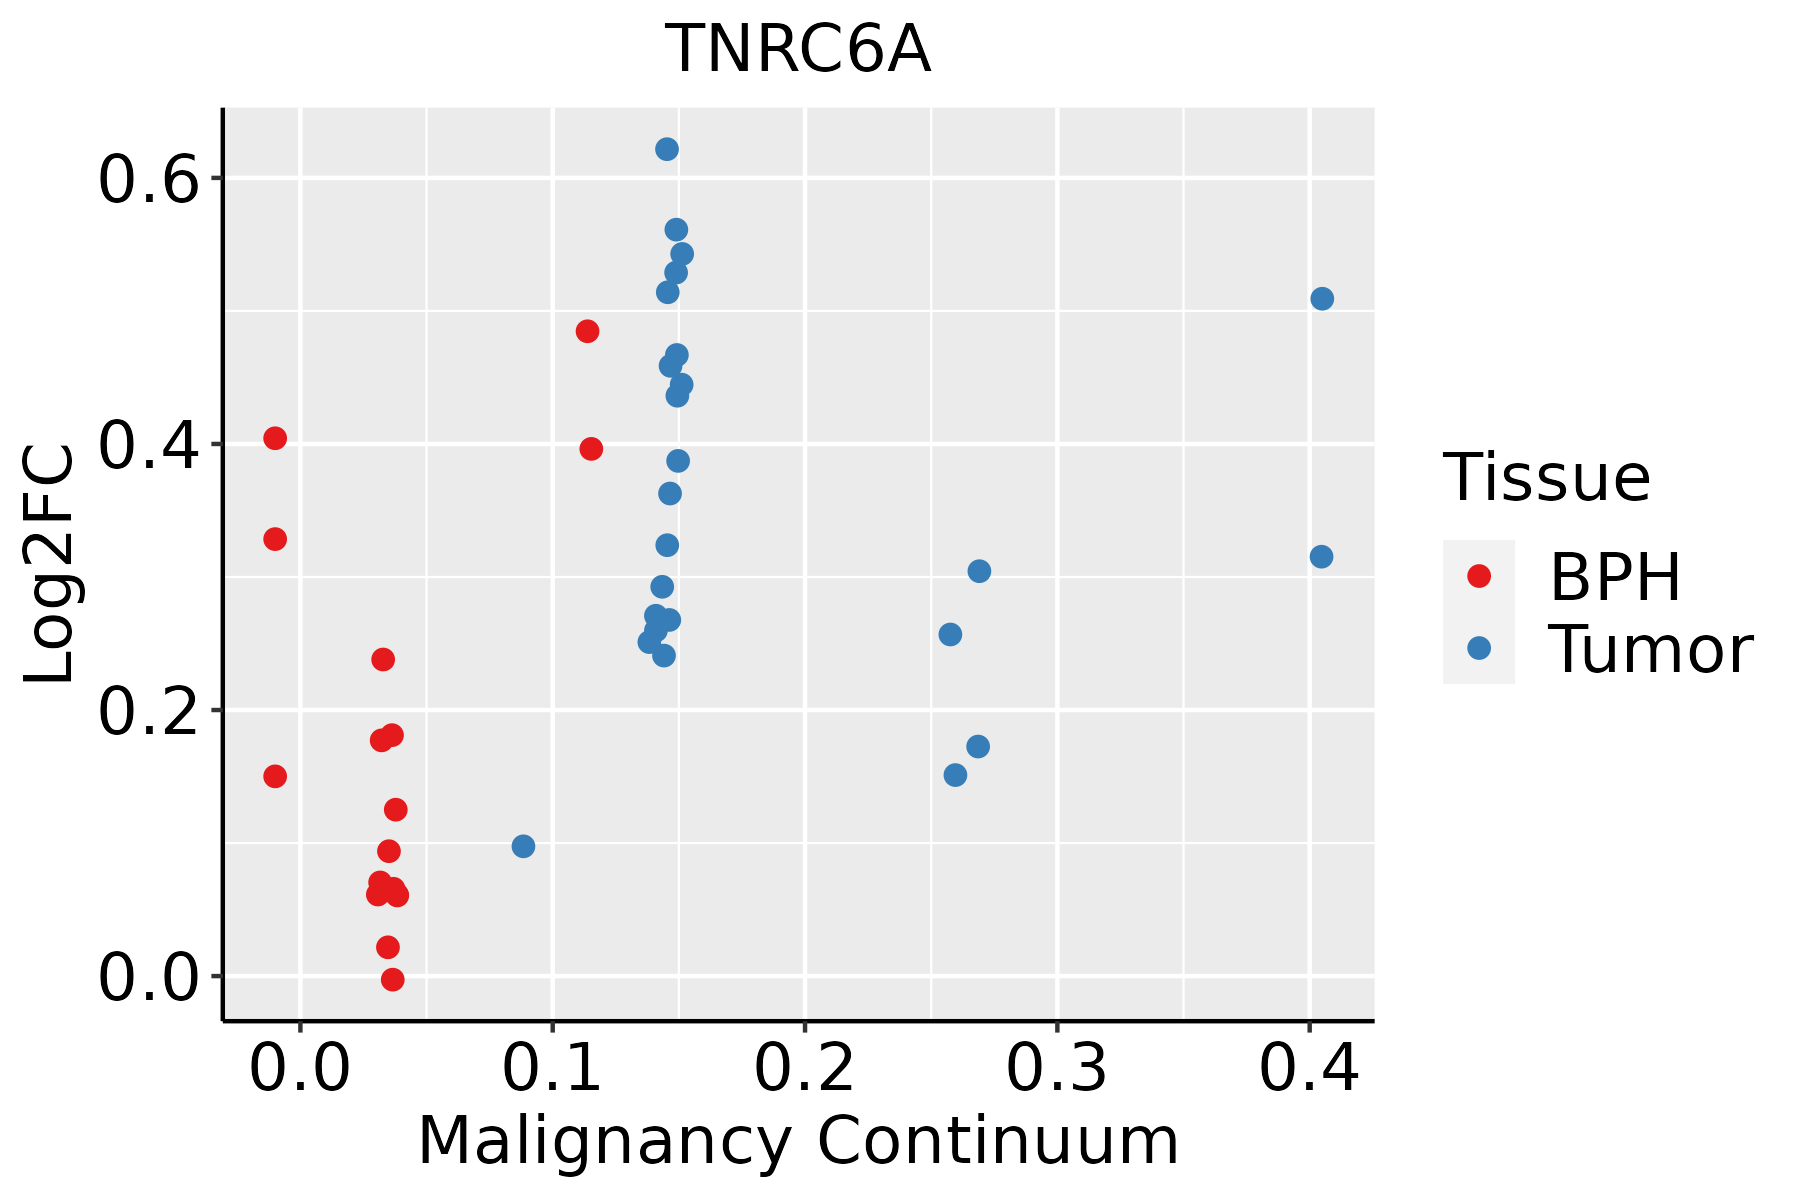
BPH: Benign Prostatic Hyperplasia
SkinThe image shows the transcriptomic changes along malignancy continuum.log2FC in expression of this searched gene in stem-like cells from each diseased tissue sample relative to stem-like cells in normal samples in each tissue plotted against the malignancy continuum. Samples are colored based on if they are from different disease stage.
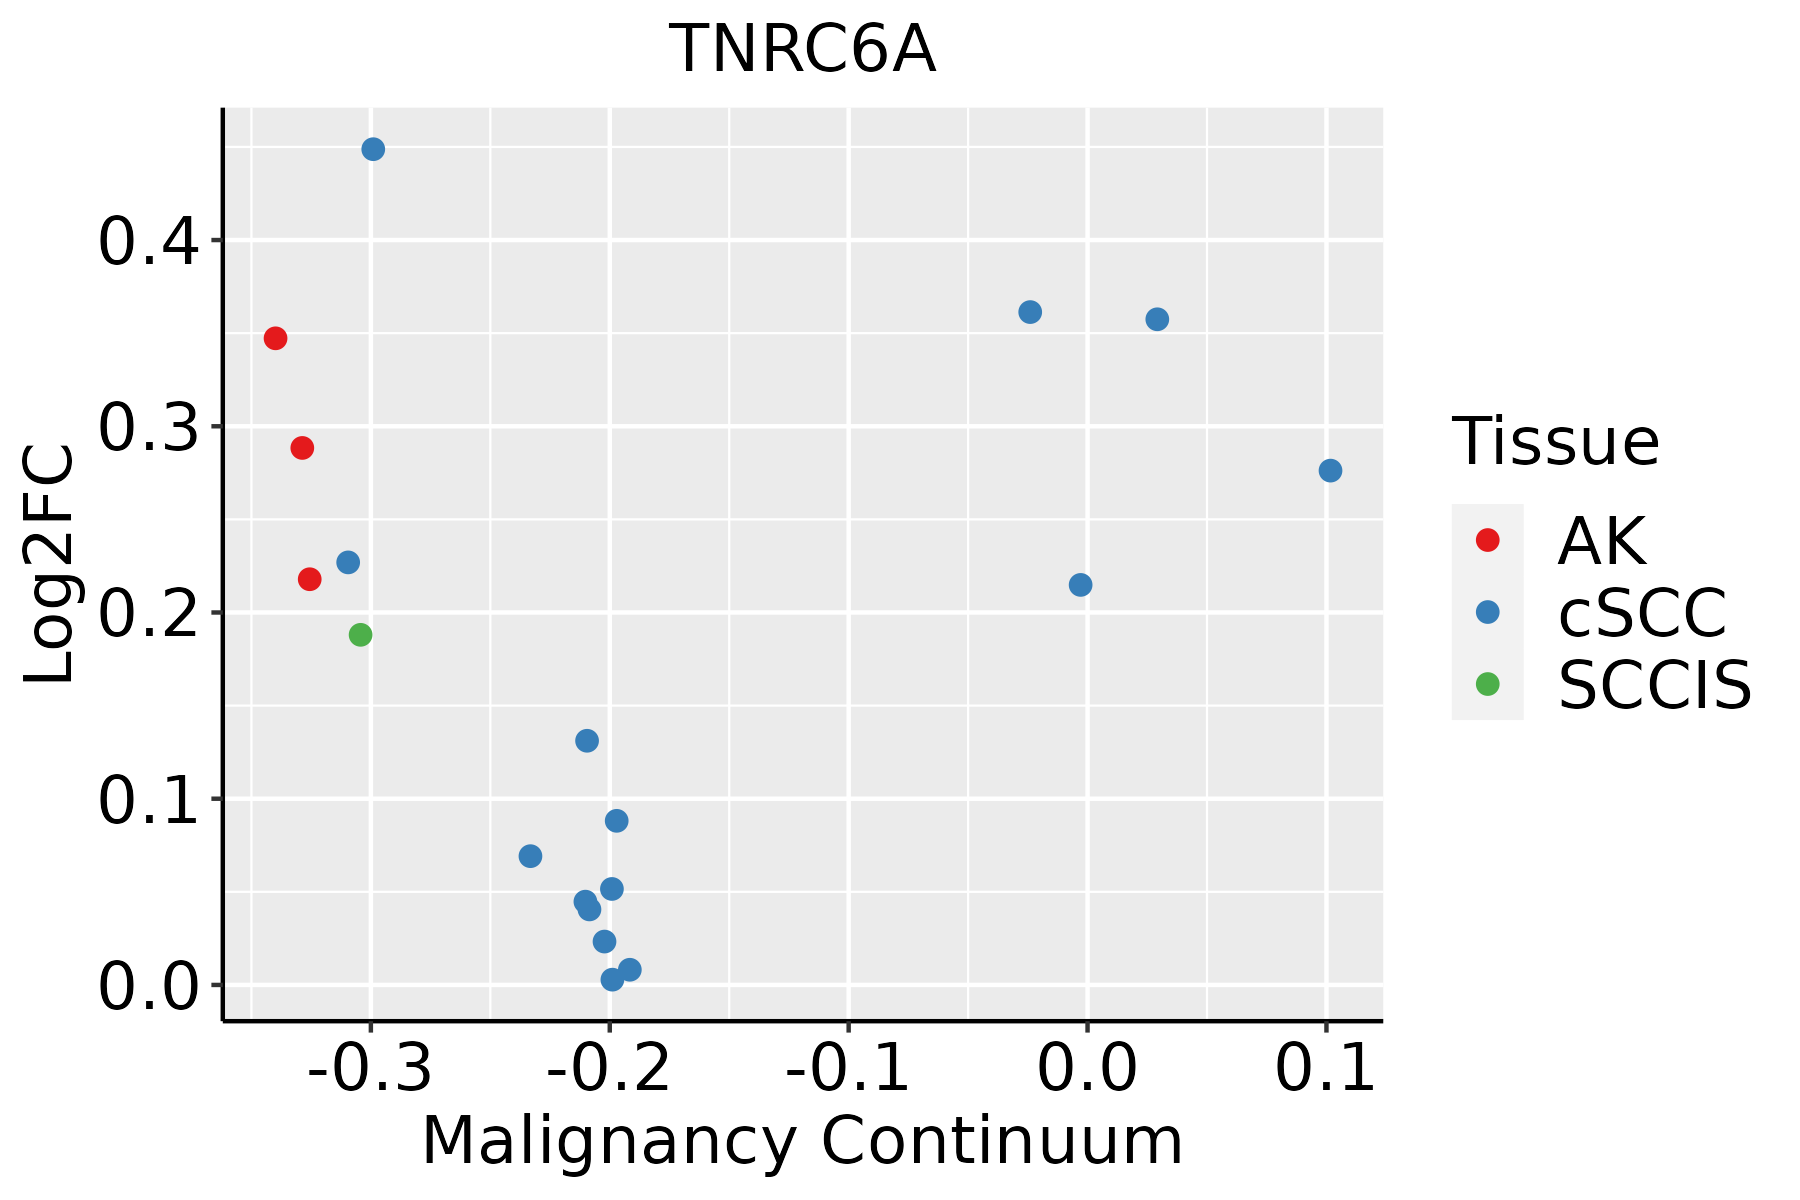
AK: Actinic keratosis
cSCC: Cutaneous squamous cell carcinoma
SCCIS:squamous cell carcinoma in situ
ThyroidThe image shows the transcriptomic changes along malignancy continuum.log2FC in expression of this searched gene in stem-like cells from each diseased tissue sample relative to stem-like cells in normal samples in each tissue plotted against the malignancy continuum. Samples are colored based on if they are from different disease stage.
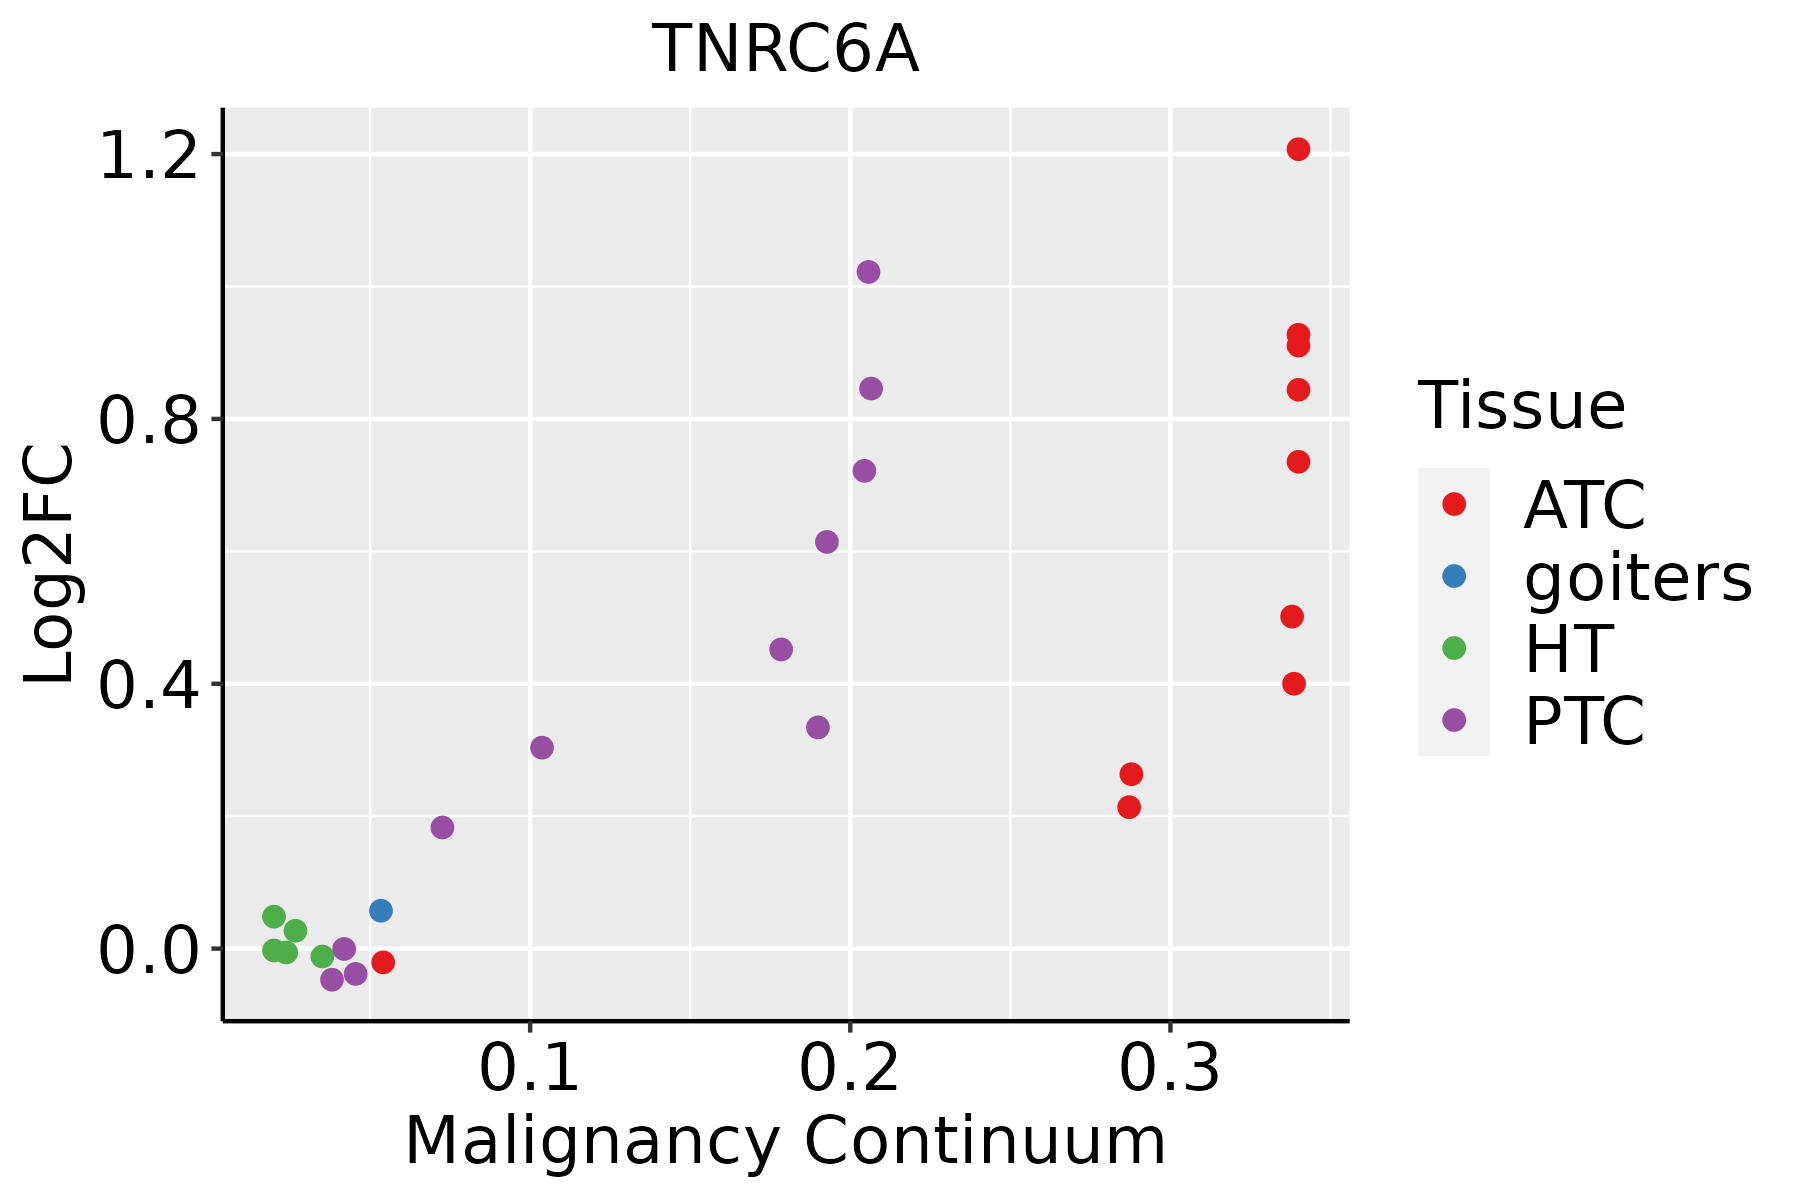
ATC: Anaplastic thyroid cancer
HT: Hashimoto's thyroiditis
PTC: Papillary thyroid cancer
∗log2FC in expression of this searched gene in stem-like cells from each diseased tissue sample relative to stem-like cells in normal samples in each tissue plotted against the malignancy continuum. Samples are colored based on if they are from different disease stage.

Top

Malignant transformation related pathway analysis

check buttonFind out the enriched GO biological processes and KEGG pathways involved in transition from healthy to precancer to cancer
check button Figure of enriched GO biological processes.
TissueDisease StageEnriched GO biological Processes
ColorectumADGO analysis - Figure of enriched GO biological processes: Top 15 enriched GO BP terms are showed in the bar plot of each disease state in each tissue. Each row represents a significant GO biological process which is colored according to the -log10(p.adjust).
ColorectumSERGO analysis - Figure of enriched GO biological processes: Top 15 enriched GO BP terms are showed in the bar plot of each disease state in each tissue. Each row represents a significant GO biological process which is colored according to the -log10(p.adjust).
ColorectumMSSGO analysis - Figure of enriched GO biological processes: Top 15 enriched GO BP terms are showed in the bar plot of each disease state in each tissue. Each row represents a significant GO biological process which is colored according to the -log10(p.adjust).
ColorectumMSI-HGO analysis - Figure of enriched GO biological processes: Top 15 enriched GO BP terms are showed in the bar plot of each disease state in each tissue. Each row represents a significant GO biological process which is colored according to the -log10(p.adjust).
ColorectumFAPGO analysis - Figure of enriched GO biological processes: Top 15 enriched GO BP terms are showed in the bar plot of each disease state in each tissue. Each row represents a significant GO biological process which is colored according to the -log10(p.adjust).
∗Top 15 enriched GO BP terms are showed in the bar plot of each disease state in each tissue. Each row represents a significant GO biological process which is colored according to the -log10(p.adjust).
Page: 1 2 3 4 5 6 7 8 9 

check button Enriched GO biological processes.
GO IDTissueDisease StageDescriptionGene RatioBg Ratiopvaluep.adjustCount
GO:000989610CervixCCpositive regulation of catabolic process109/2311492/187235.26e-106.99e-08109
GO:007149610CervixCCcellular response to external stimulus78/2311320/187231.82e-091.98e-0778
GO:003133110CervixCCpositive regulation of cellular catabolic process91/2311427/187239.64e-085.25e-0691
GO:00316689CervixCCcellular response to extracellular stimulus59/2311246/187233.03e-071.24e-0559
GO:00064029CervixCCmRNA catabolic process56/2311232/187234.81e-071.83e-0556
GO:19033119CervixCCregulation of mRNA metabolic process64/2311288/187231.71e-065.64e-0564
GO:00064019CervixCCRNA catabolic process62/2311278/187232.18e-066.56e-0562
GO:003166710CervixCCresponse to nutrient levels92/2311474/187235.80e-061.42e-0492
GO:00092678CervixCCcellular response to starvation39/2311156/187231.04e-052.32e-0439
GO:00425948CervixCCresponse to starvation46/2311197/187231.24e-052.59e-0446
GO:00316698CervixCCcellular response to nutrient levels49/2311215/187231.32e-052.68e-0449
GO:00002896CervixCCnuclear-transcribed mRNA poly(A) tail shortening13/231129/187231.48e-052.93e-0413
GO:00602119CervixCCregulation of nuclear-transcribed mRNA poly(A) tail shortening9/231115/187231.63e-053.17e-049
GO:000641710CervixCCregulation of translation89/2311468/187231.86e-053.46e-0489
GO:00009567CervixCCnuclear-transcribed mRNA catabolic process30/2311112/187232.60e-054.37e-0430
GO:00602139CervixCCpositive regulation of nuclear-transcribed mRNA poly(A) tail shortening8/231113/187233.85e-056.05e-048
GO:00002886CervixCCnuclear-transcribed mRNA catabolic process, deadenylation-dependent decay18/231156/187238.42e-051.13e-0318
GO:00610139CervixCCregulation of mRNA catabolic process38/2311166/187231.07e-041.36e-0338
GO:19033136CervixCCpositive regulation of mRNA metabolic process29/2311118/187231.86e-042.18e-0329
GO:00467008CervixCCheterocycle catabolic process80/2311445/187233.23e-043.42e-0380
Page: 1 2 3 4 5 6 7 8 9 10 11 12 13 14 15 16 17 18 19 20 21 22 23 24 25 26 27 28 29 30 31 32 33 

check button Enriched KEGG pathways.
Pathway IDTissueDisease StageDescriptionGene RatioBg Ratiopvaluep.adjustqvalueCount
Page: 1 

Top

Cell-cell communication analysis

check buttonIdentification of potential cell-cell interactions between two cell types and their ligand-receptor pairs for different disease states
LigandReceptorLRpairPathwayTissueDisease Stage
Page: 1 

Top

Single-cell gene regulatory network inference analysis

check buttonFind out the significant the regulons (TFs) and the target genes of each regulon across cell types for different disease states
TFCell TypeTissueDisease StageTarget GeneRSSRegulon Activity
∗The dot plots of a searched regulon are shown for all cell subpopulations in each disease state of each tissue based on the regulon specific score inferred using pySCENIC and by calculating the average expression.
Page: 1 

Top

Somatic mutation of malignant transformation related genes

check buttonAnnotation of somatic variants for genes involved in malignant transformation
Hugo SymbolVariant ClassVariant ClassificationdbSNP RSHGVScHGVSpHGVSp ShortSWISSPROTBIOTYPESIFTPolyPhenTumor Sample BarcodeTissueHistologySexAgeStageTherapy TypesDrugsOutcome
TNRC6ASNVMissense_Mutationnovelc.1531N>Cp.Glu511Glnp.E511QQ8NDV7protein_codingtolerated(0.13)possibly_damaging(0.837)TCGA-A1-A0SI-01Breastbreast invasive carcinomaFemale<65I/IIUnknownUnknownSD
TNRC6ASNVMissense_Mutationnovelc.3425N>Gp.Glu1142Glyp.E1142GQ8NDV7protein_codingtolerated(0.11)benign(0.038)TCGA-A8-A06R-01Breastbreast invasive carcinomaFemale>=65I/IIChemotherapy5-fluorouracilCR
TNRC6ASNVMissense_Mutationnovelc.847N>Ap.Leu283Ilep.L283IQ8NDV7protein_codingtolerated(0.55)benign(0.003)TCGA-A8-A097-01Breastbreast invasive carcinomaFemale>=65I/IIHormone TherapytamoxiphenSD
TNRC6ASNVMissense_Mutationc.3223N>Cp.Asp1075Hisp.D1075HQ8NDV7protein_codingdeleterious(0)probably_damaging(1)TCGA-AC-A23H-01Breastbreast invasive carcinomaFemale>=65I/IIUnknownUnknownPD
TNRC6ASNVMissense_Mutationc.2810C>Tp.Ser937Leup.S937LQ8NDV7protein_codingdeleterious(0.03)benign(0.101)TCGA-AN-A046-01Breastbreast invasive carcinomaFemale>=65I/IIUnknownUnknownSD
TNRC6ASNVMissense_Mutationc.5274N>Tp.Trp1758Cysp.W1758CQ8NDV7protein_codingdeleterious(0)probably_damaging(0.997)TCGA-AN-A0AK-01Breastbreast invasive carcinomaFemale>=65I/IIUnknownUnknownSD
TNRC6ASNVMissense_Mutationc.1854N>Ap.Asn618Lysp.N618KQ8NDV7protein_codingdeleterious(0.01)benign(0.036)TCGA-AR-A1AH-01Breastbreast invasive carcinomaFemale<65I/IIUnspecificPD
TNRC6ASNVMissense_Mutationc.5350N>Ap.Val1784Ilep.V1784IQ8NDV7protein_codingdeleterious(0)probably_damaging(0.978)TCGA-AR-A1AL-01Breastbreast invasive carcinomaFemale<65III/IVHormone TherapyanastrozoleSD
TNRC6ASNVMissense_Mutationc.5299N>Tp.Pro1767Serp.P1767SQ8NDV7protein_codingtolerated(0.15)benign(0.158)TCGA-B6-A0RG-01Breastbreast invasive carcinomaFemale<65I/IIUnknownUnknownSD
TNRC6ASNVMissense_Mutationc.994G>Ap.Glu332Lysp.E332KQ8NDV7protein_codingtolerated(0.14)benign(0.018)TCGA-GM-A2DH-01Breastbreast invasive carcinomaFemale<65I/IIChemotherapytaxolCR
Page: 1 2 3 4 5 6 7 8 9 10 11 12 13 14 15 16 17 18 19 20 21 22 23 

Top

Related drugs of malignant transformation related genes

check buttonIdentification of chemicals and drugs interact with genes involved in malignant transfromation
(DGIdb 4.0)
Entrez IDSymbolCategoryInteraction TypesDrug Claim NameDrug NamePMIDs
27327TNRC6ANAethanolALCOHOL32451486
Page: 1