
|
|||||
|
 | |
| |
| |
| |
| |
| |
|
Gene: TNRC18 |
Gene summary for TNRC18 |
| Gene information | Species | Human | Gene symbol | TNRC18 | Gene ID | 84629 |
| Gene name | trinucleotide repeat containing 18 | |
| Gene Alias | CAGL79 | |
| Cytomap | 7p22.1 | |
| Gene Type | protein-coding | GO ID | GO:0005575 | UniProtAcc | A3KMH2 |
Top |
Malignant transformation analysis |
| Identification of the aberrant gene expression in precancerous and cancerous lesions by comparing the gene expression of stem-like cells in diseased tissues with normal stem cells |
| Entrez ID | Symbol | Replicates | Species | Organ | Tissue | Adj P-value | Log2FC | Malignancy |
| 84629 | TNRC18 | CCI_1 | Human | Cervix | CC | 6.73e-07 | 8.53e-01 | 0.528 |
| 84629 | TNRC18 | CCI_2 | Human | Cervix | CC | 8.20e-06 | 7.24e-01 | 0.5249 |
| 84629 | TNRC18 | CCI_3 | Human | Cervix | CC | 6.72e-09 | 6.94e-01 | 0.516 |
| 84629 | TNRC18 | T3 | Human | Cervix | CC | 8.92e-04 | 2.04e-01 | 0.1389 |
| 84629 | TNRC18 | HTA11_3410_2000001011 | Human | Colorectum | AD | 4.66e-07 | -3.48e-01 | 0.0155 |
| 84629 | TNRC18 | HTA11_696_2000001011 | Human | Colorectum | AD | 9.60e-04 | 4.62e-01 | -0.1464 |
| 84629 | TNRC18 | HTA11_6818_2000001011 | Human | Colorectum | AD | 1.02e-04 | 7.26e-01 | 0.0112 |
| 84629 | TNRC18 | HTA11_99999970781_79442 | Human | Colorectum | MSS | 5.44e-05 | -4.03e-01 | 0.294 |
| 84629 | TNRC18 | HTA11_99999965062_69753 | Human | Colorectum | MSI-H | 1.79e-05 | 9.20e-01 | 0.3487 |
| 84629 | TNRC18 | A001-C-207 | Human | Colorectum | FAP | 1.30e-02 | -1.77e-01 | 0.1278 |
| 84629 | TNRC18 | A015-C-203 | Human | Colorectum | FAP | 3.50e-23 | -2.58e-01 | -0.1294 |
| 84629 | TNRC18 | A015-C-204 | Human | Colorectum | FAP | 4.75e-03 | -1.24e-01 | -0.0228 |
| 84629 | TNRC18 | A014-C-040 | Human | Colorectum | FAP | 2.17e-03 | -8.02e-02 | -0.1184 |
| 84629 | TNRC18 | A002-C-201 | Human | Colorectum | FAP | 8.79e-08 | -4.22e-02 | 0.0324 |
| 84629 | TNRC18 | A002-C-203 | Human | Colorectum | FAP | 3.49e-06 | 2.26e-01 | 0.2786 |
| 84629 | TNRC18 | A001-C-119 | Human | Colorectum | FAP | 9.06e-05 | 5.63e-02 | -0.1557 |
| 84629 | TNRC18 | A001-C-108 | Human | Colorectum | FAP | 4.13e-14 | 8.75e-03 | -0.0272 |
| 84629 | TNRC18 | A002-C-205 | Human | Colorectum | FAP | 2.70e-21 | 6.65e-03 | -0.1236 |
| 84629 | TNRC18 | A001-C-104 | Human | Colorectum | FAP | 4.87e-03 | 8.89e-02 | 0.0184 |
| 84629 | TNRC18 | A015-C-006 | Human | Colorectum | FAP | 1.73e-12 | 1.42e-02 | -0.0994 |
| Page: 1 2 3 4 5 6 7 8 |
| Tissue | Expression Dynamics | Abbreviation |
| Cervix | 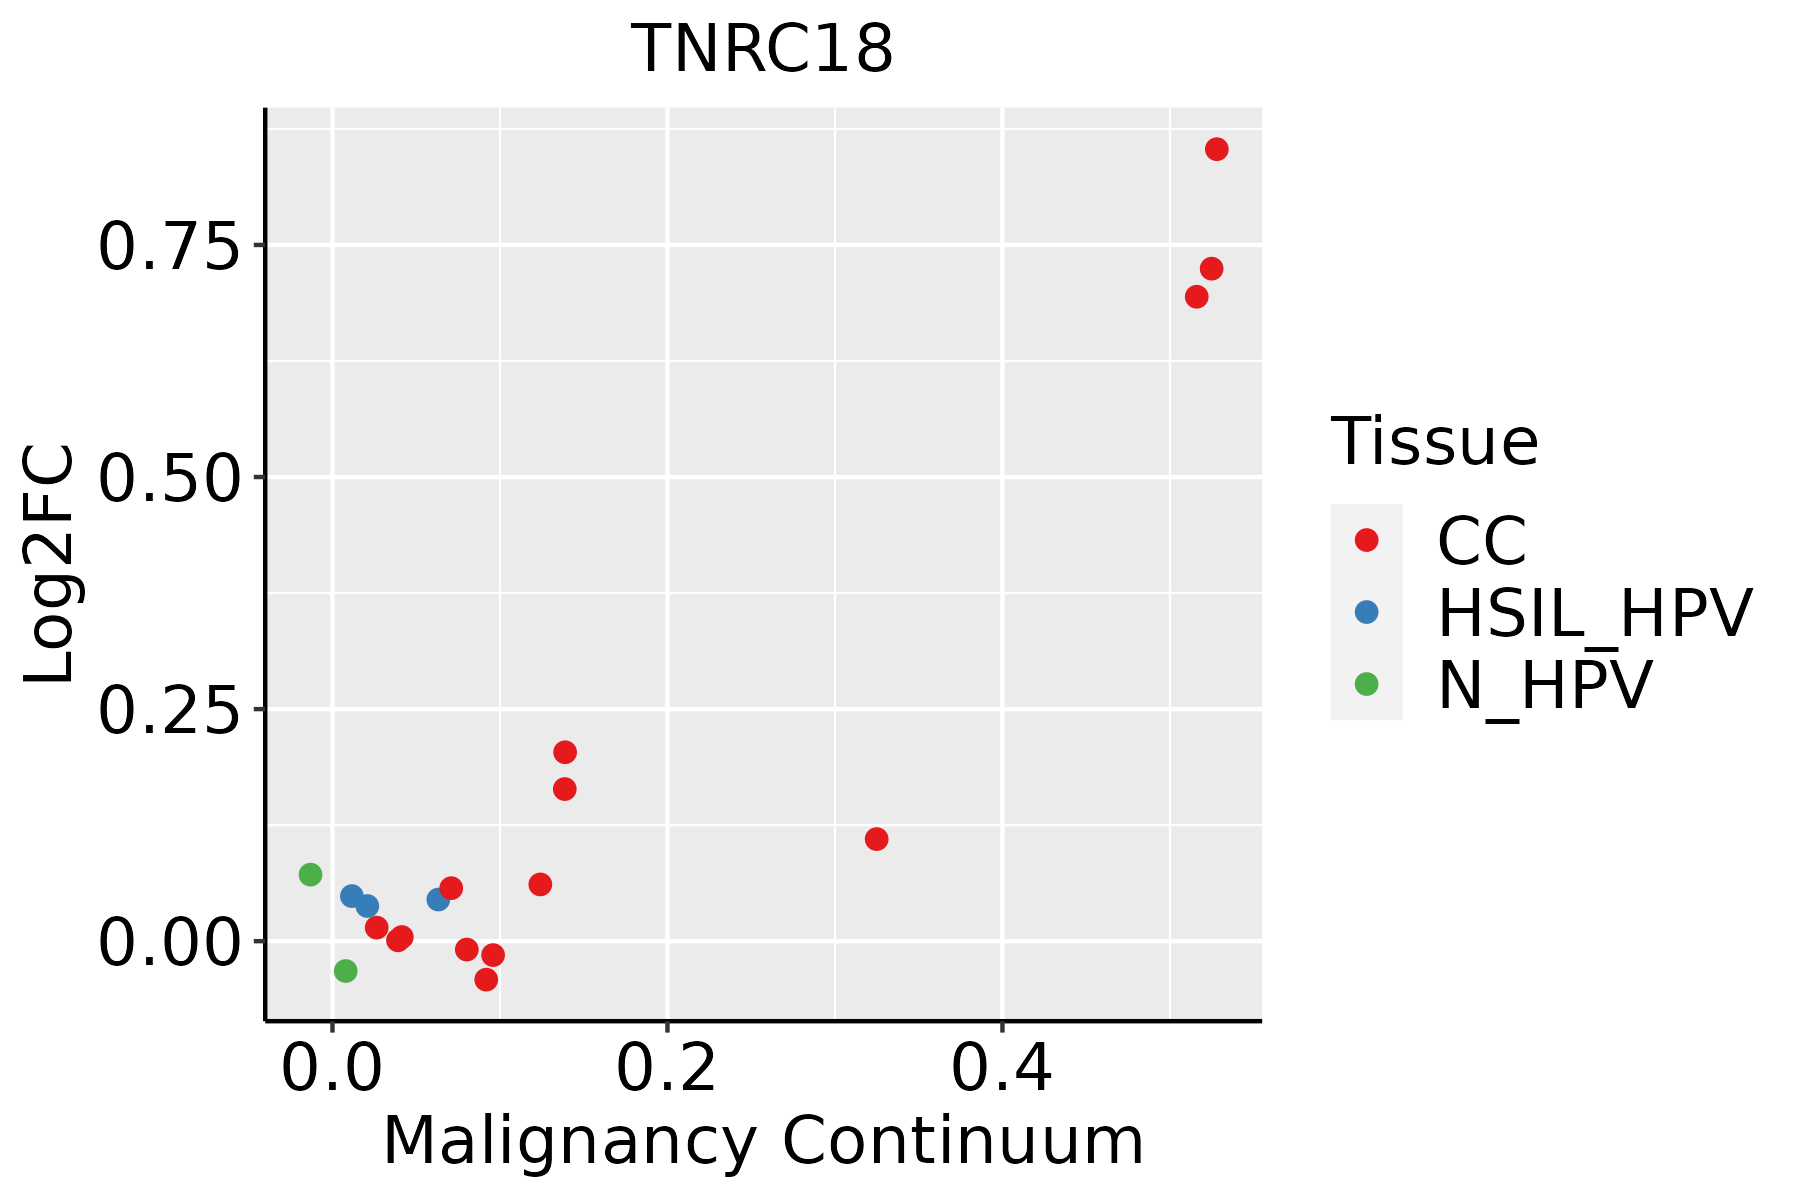 | CC: Cervix cancer |
| HSIL_HPV: HPV-infected high-grade squamous intraepithelial lesions | ||
| N_HPV: HPV-infected normal cervix | ||
| Colorectum (GSE201348) | 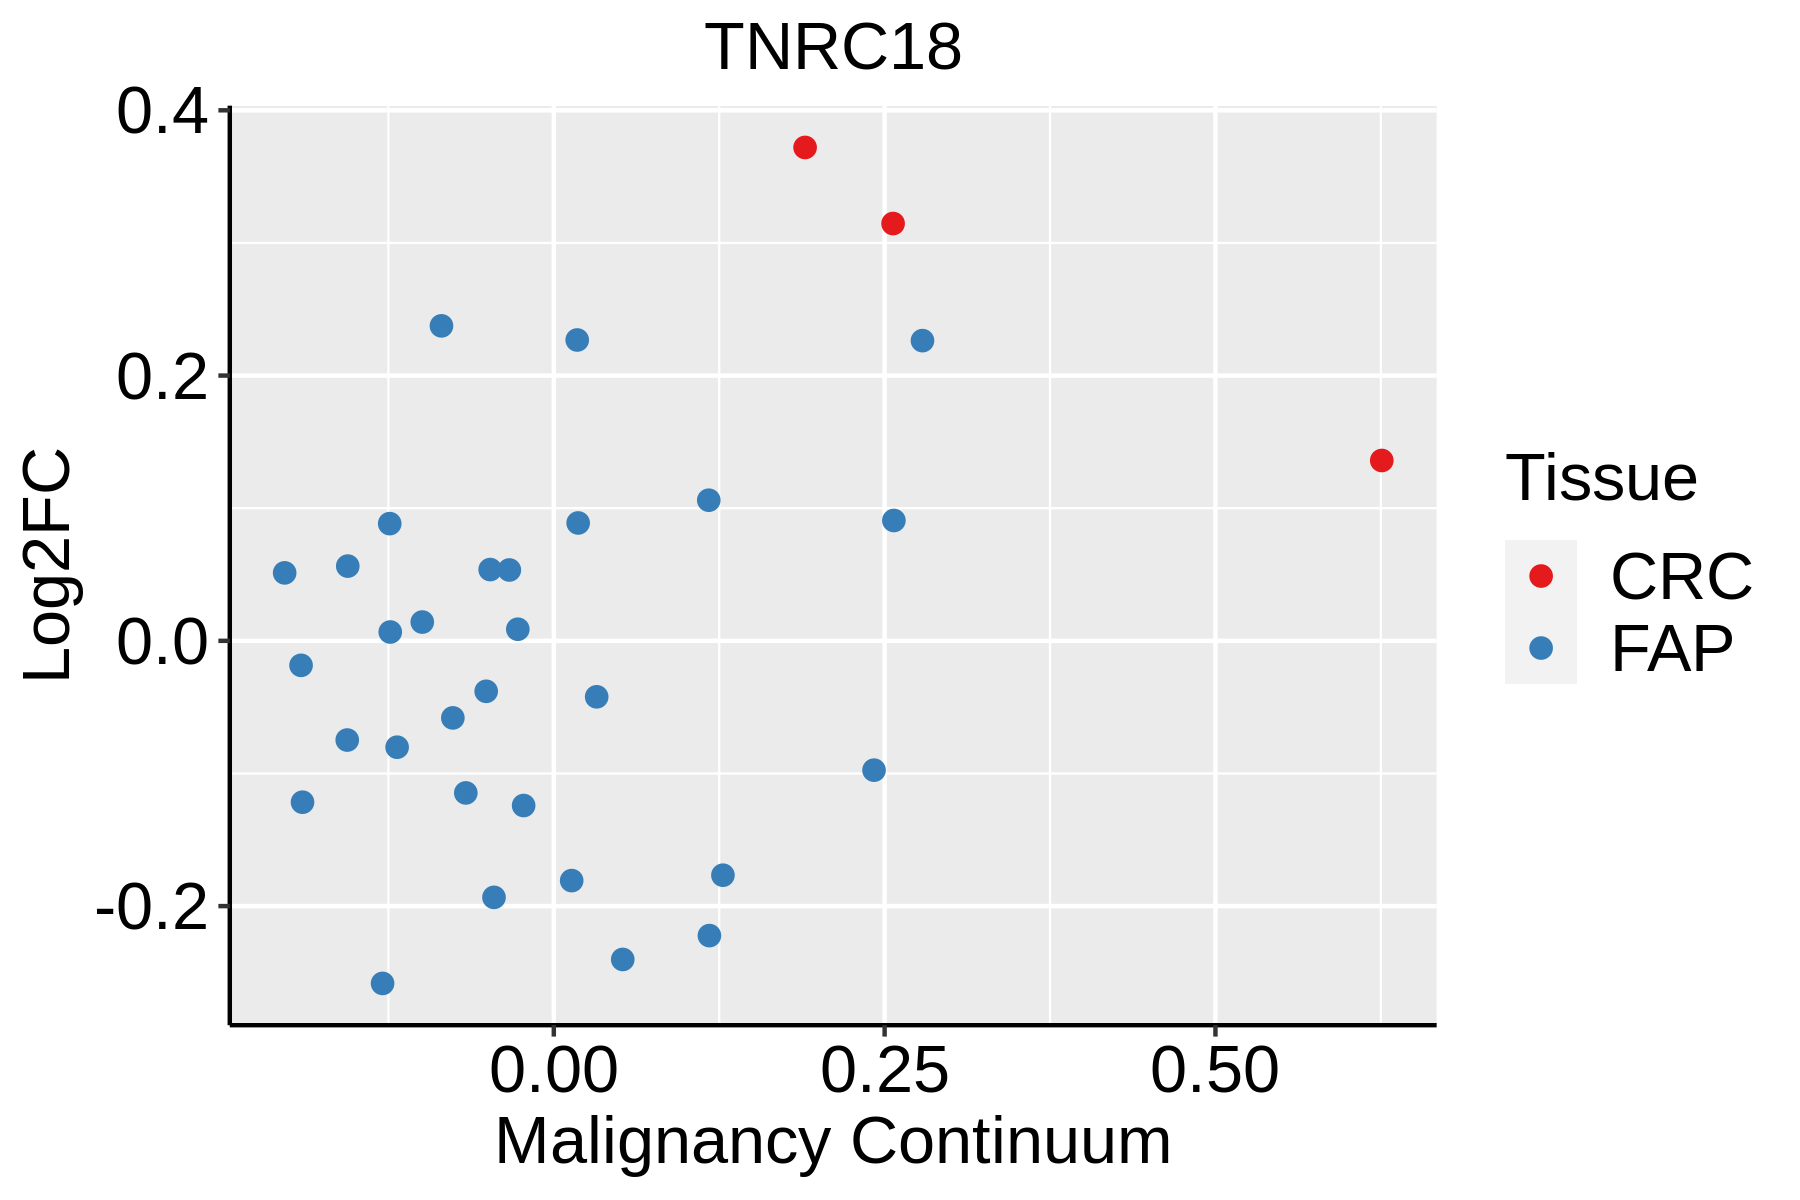 | FAP: Familial adenomatous polyposis |
| CRC: Colorectal cancer | ||
| Colorectum (HTA11) |  | AD: Adenomas |
| SER: Sessile serrated lesions | ||
| MSI-H: Microsatellite-high colorectal cancer | ||
| MSS: Microsatellite stable colorectal cancer | ||
| Endometrium | 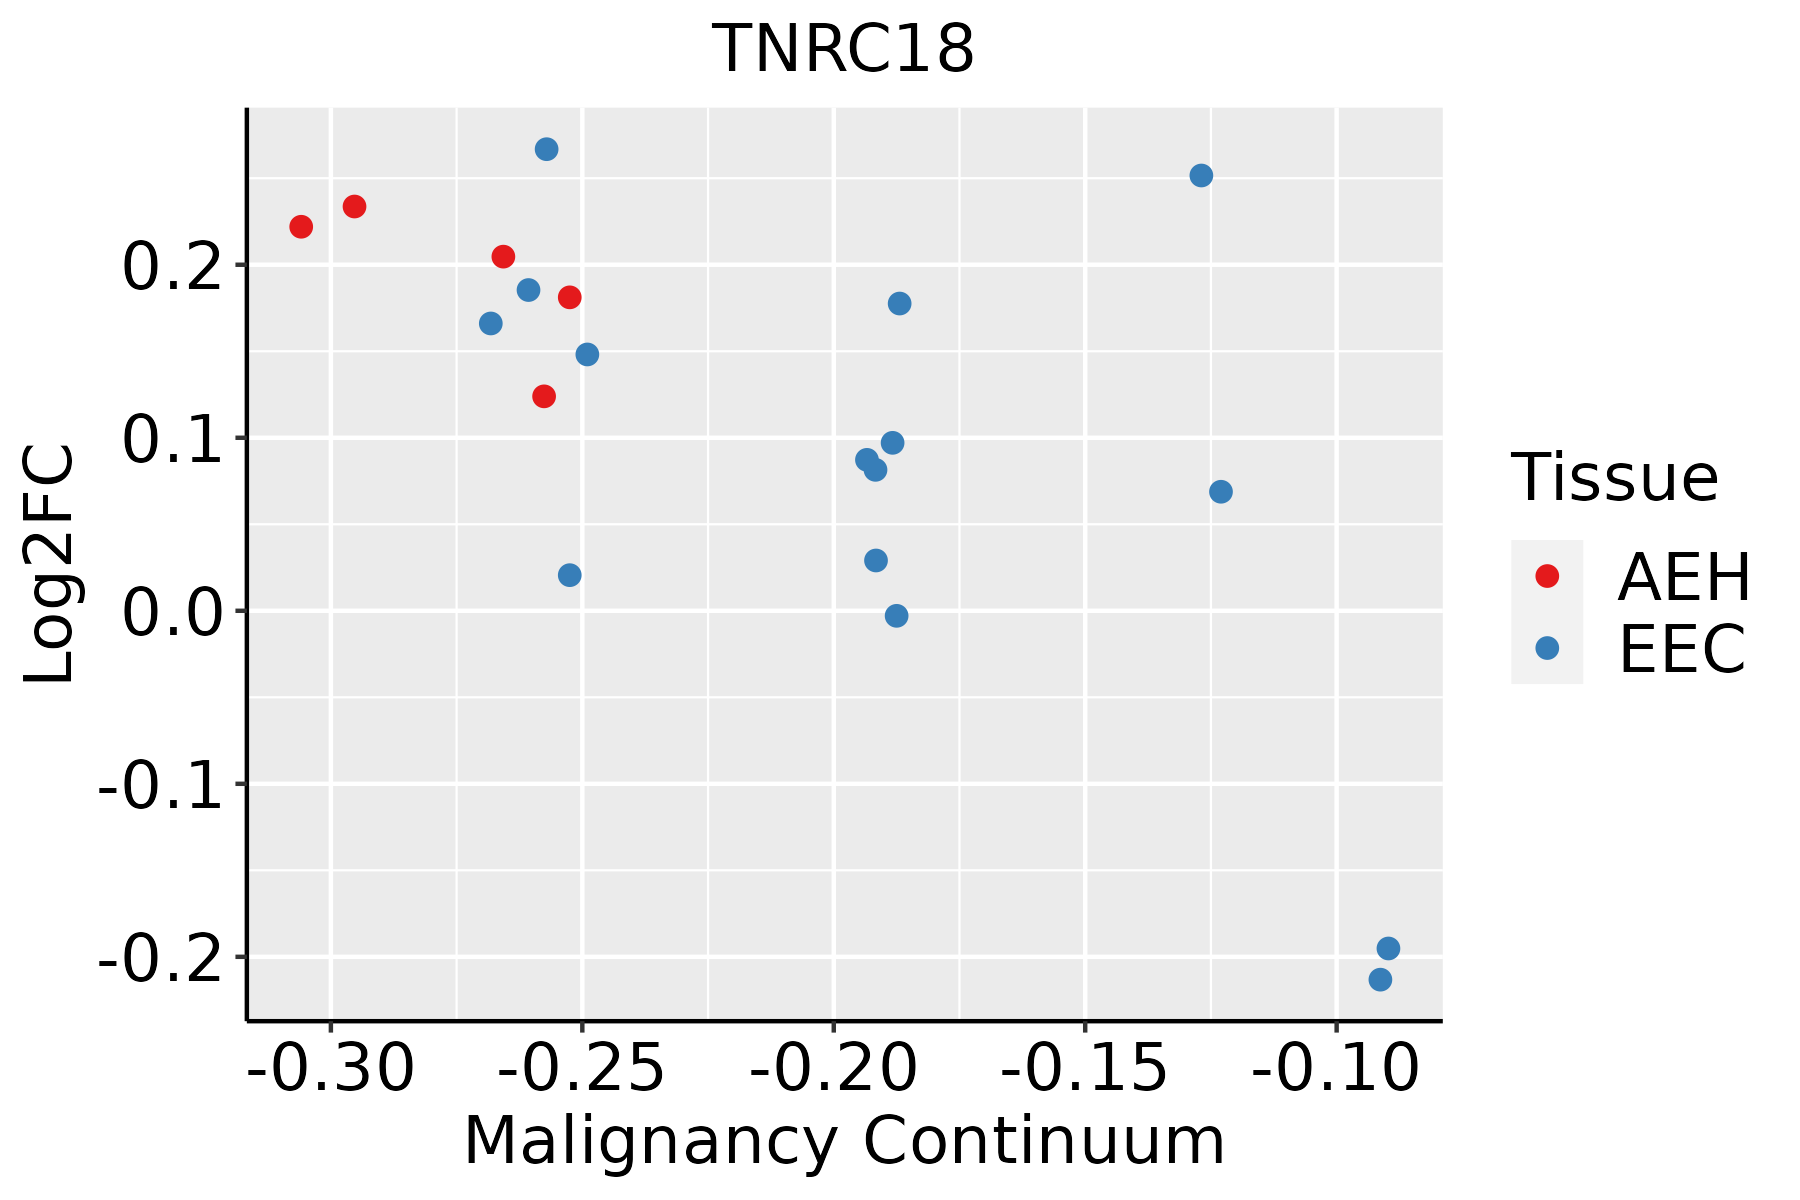 | AEH: Atypical endometrial hyperplasia |
| EEC: Endometrioid Cancer | ||
| Esophagus | 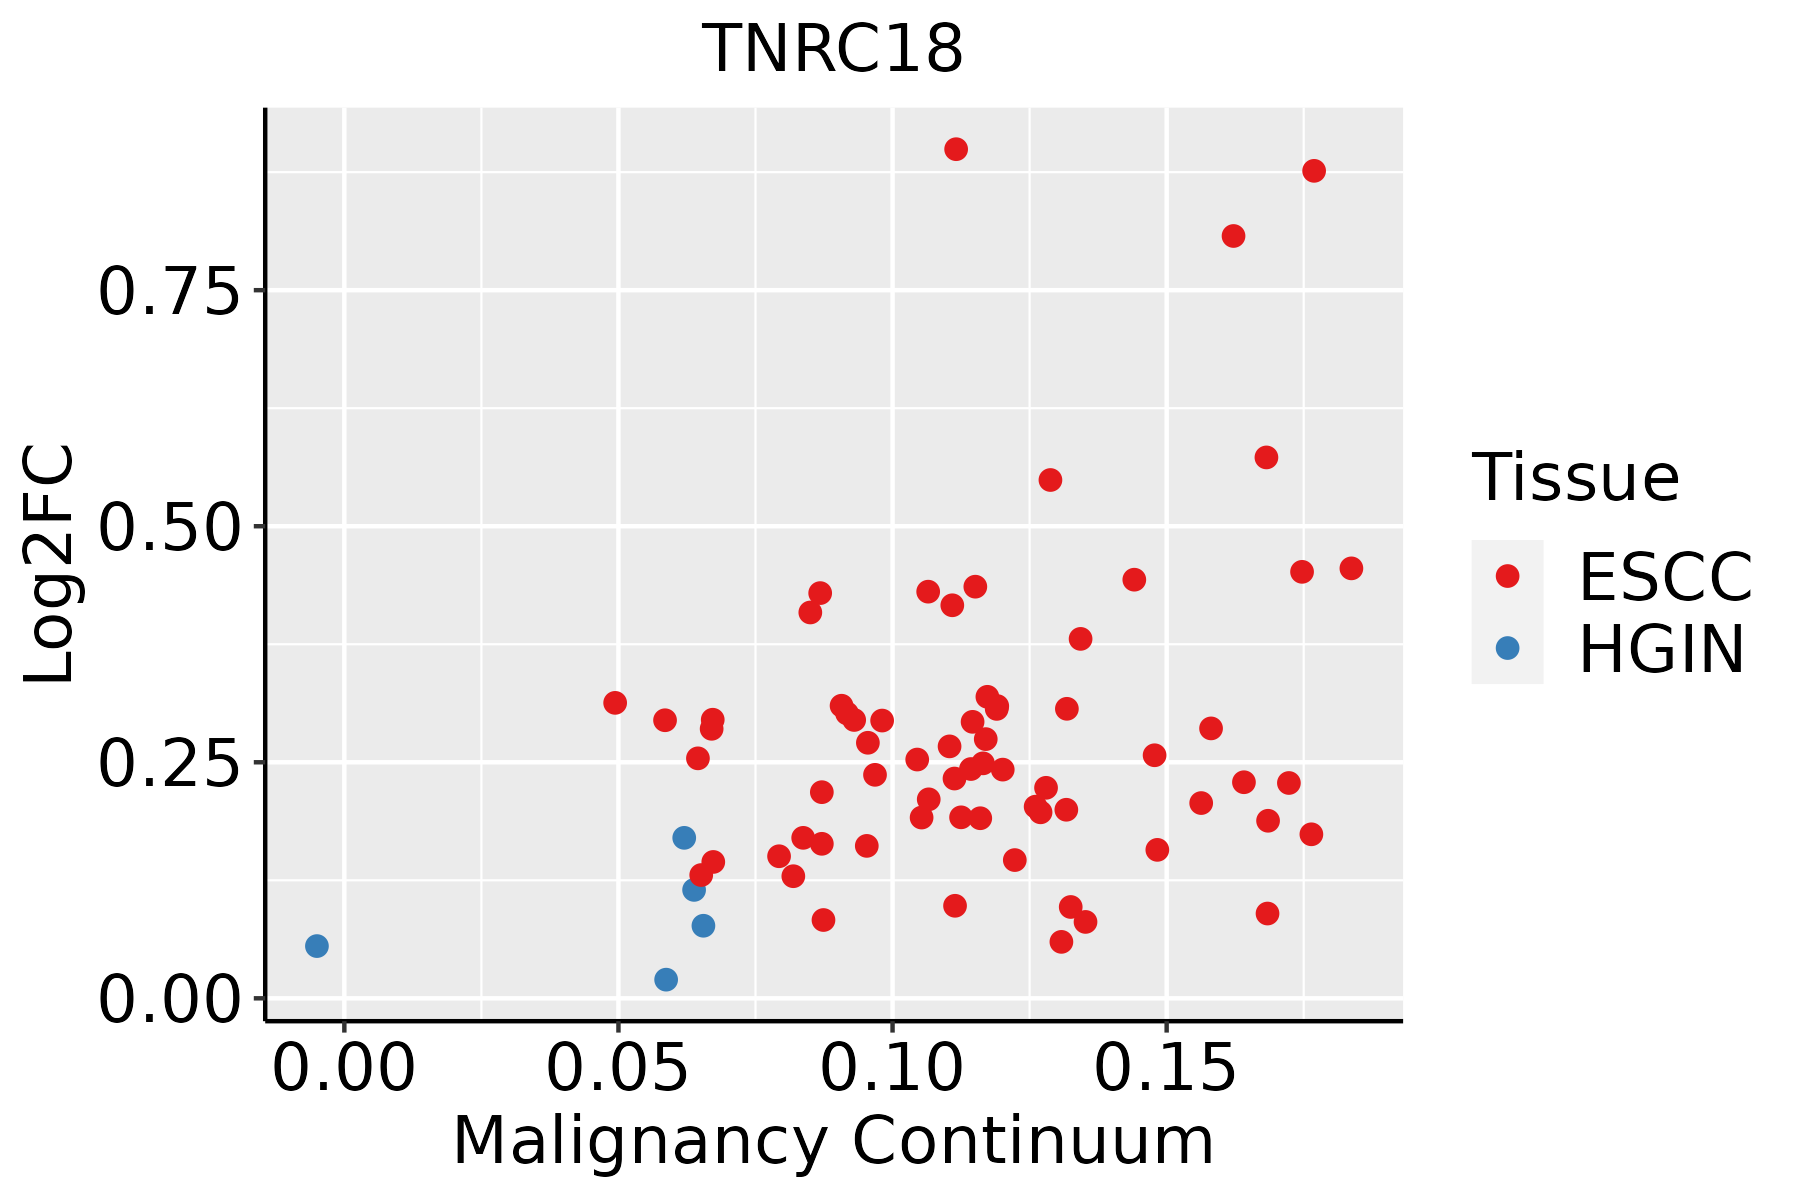 | ESCC: Esophageal squamous cell carcinoma |
| HGIN: High-grade intraepithelial neoplasias | ||
| LGIN: Low-grade intraepithelial neoplasias | ||
| Liver | 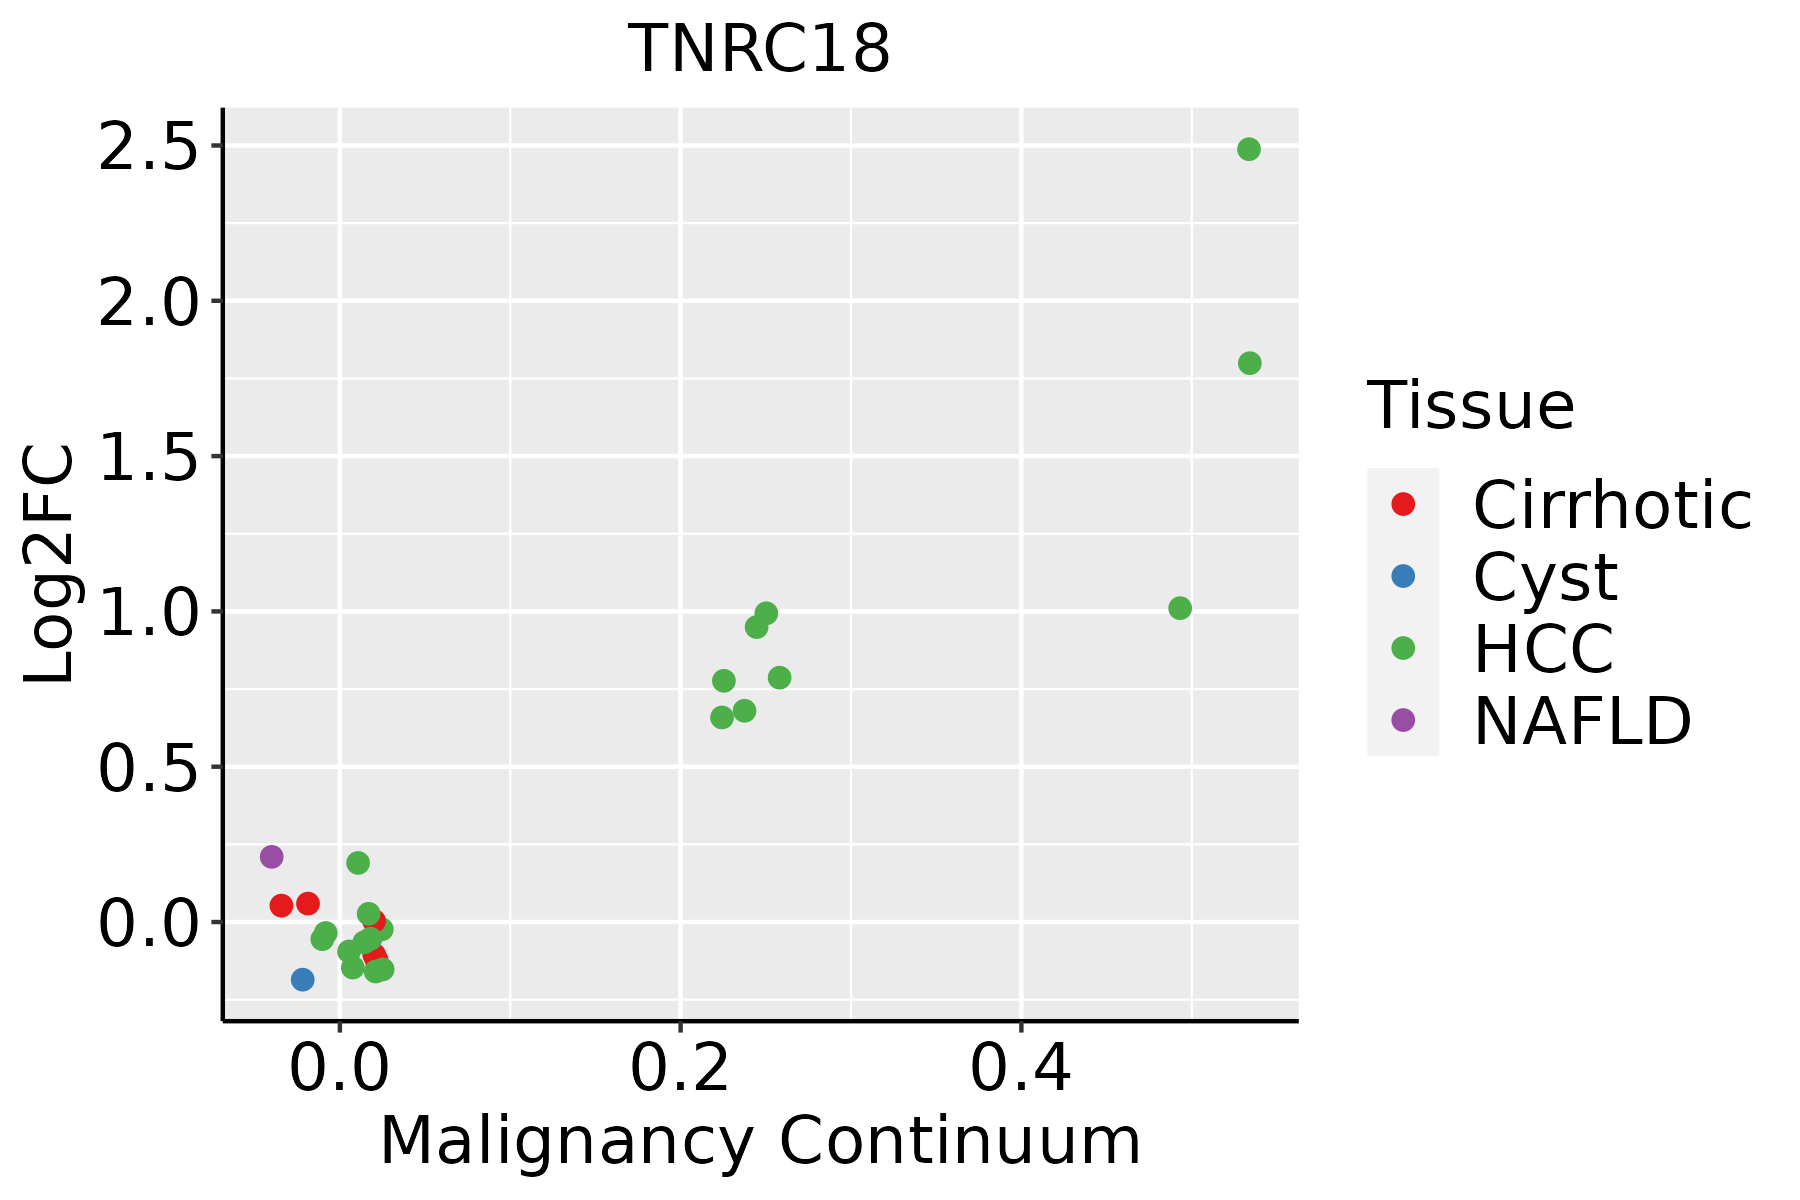 | HCC: Hepatocellular carcinoma |
| NAFLD: Non-alcoholic fatty liver disease | ||
| Lung | 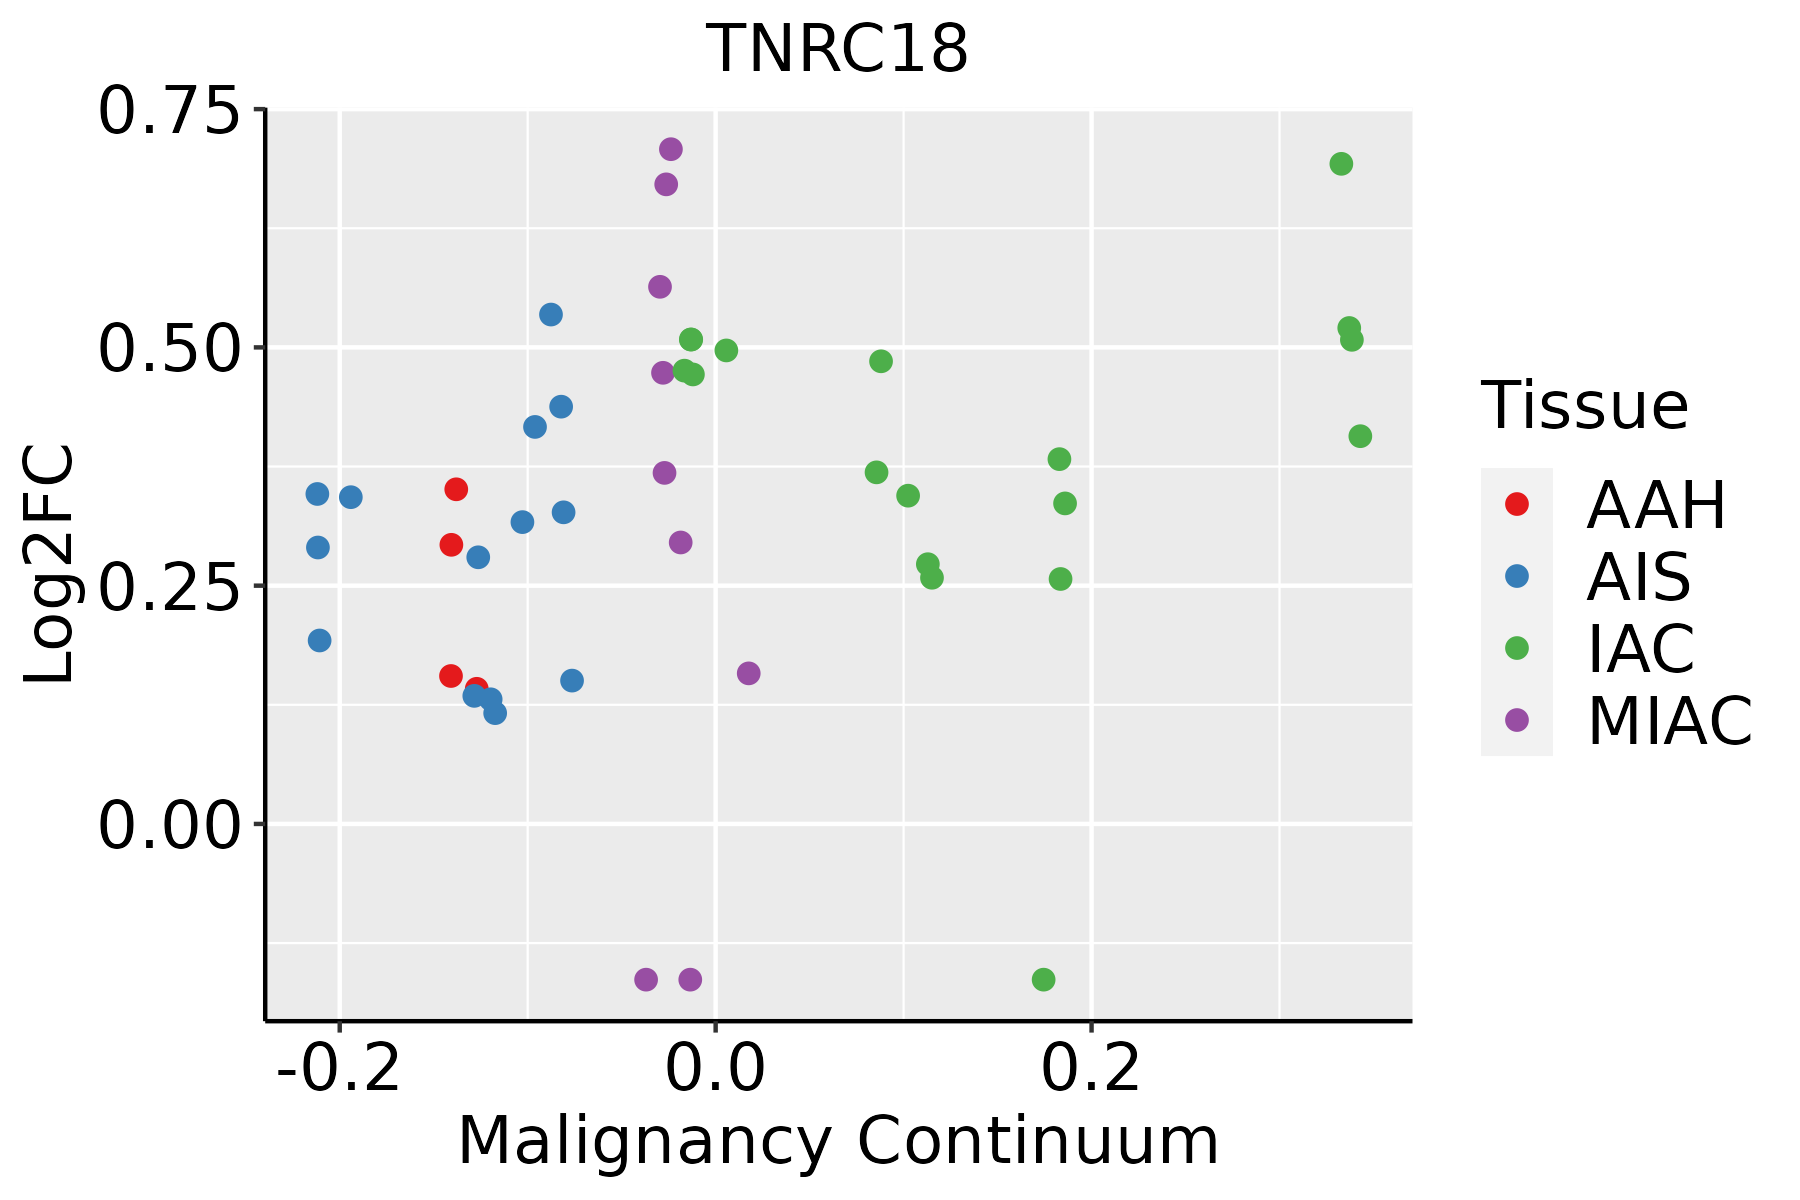 | AAH: Atypical adenomatous hyperplasia |
| AIS: Adenocarcinoma in situ | ||
| IAC: Invasive lung adenocarcinoma | ||
| MIA: Minimally invasive adenocarcinoma | ||
| Oral Cavity | 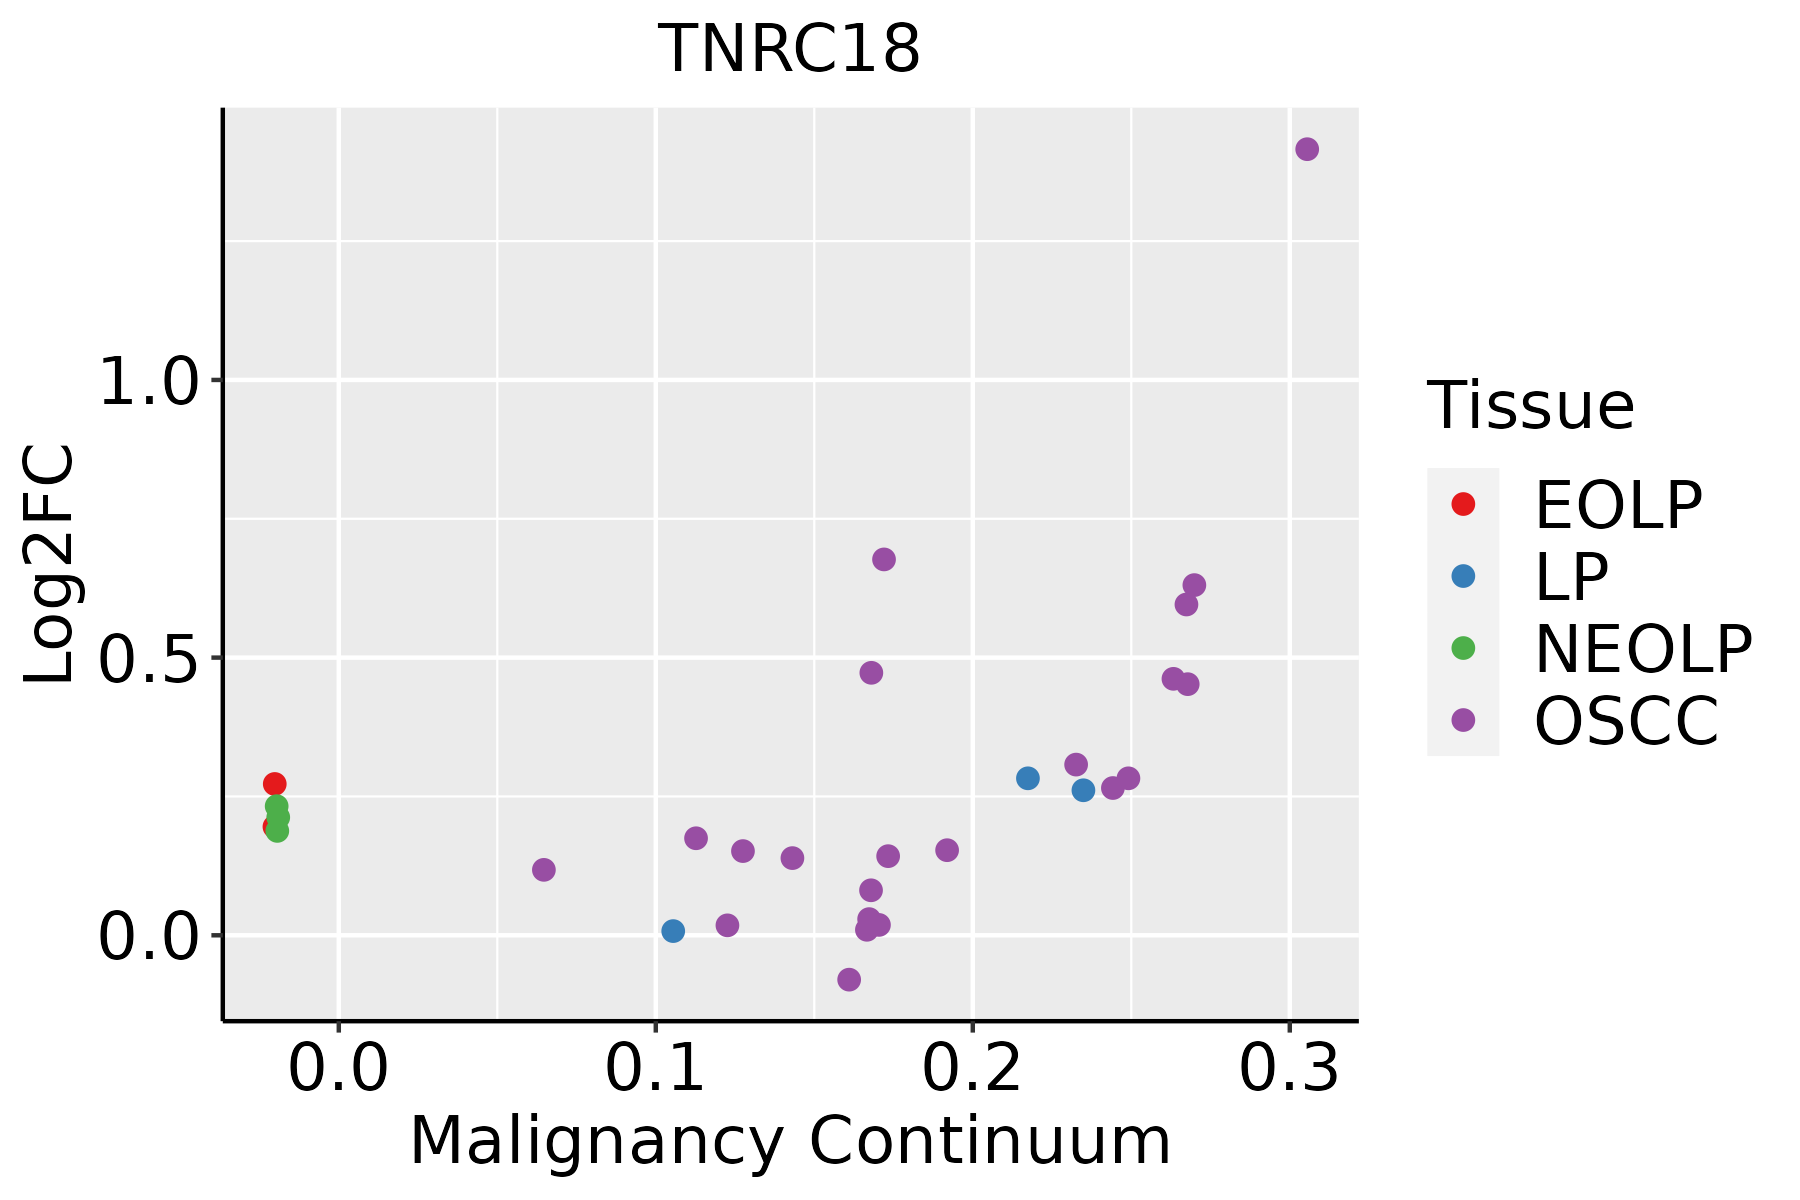 | EOLP: Erosive Oral lichen planus |
| LP: leukoplakia | ||
| NEOLP: Non-erosive oral lichen planus | ||
| OSCC: Oral squamous cell carcinoma | ||
| Thyroid |  | ATC: Anaplastic thyroid cancer |
| HT: Hashimoto's thyroiditis | ||
| PTC: Papillary thyroid cancer |
| ∗log2FC in expression of this searched gene in stem-like cells from each diseased tissue sample relative to stem-like cells in normal samples in each tissue plotted against the malignancy continuum. Samples are colored based on if they are from different disease stage. |
Top |
Malignant transformation related pathway analysis |
| Find out the enriched GO biological processes and KEGG pathways involved in transition from healthy to precancer to cancer |
| Tissue | Disease Stage | Enriched GO biological Processes |
| Colorectum | AD |  |
| Colorectum | SER |  |
| Colorectum | MSS |  |
| Colorectum | MSI-H |  |
| Colorectum | FAP |  |
| ∗Top 15 enriched GO BP terms are showed in the bar plot of each disease state in each tissue. Each row represents a significant GO biological process which is colored according to the -log10(p.adjust). |
| Page: 1 2 3 4 5 6 7 8 9 |
| GO ID | Tissue | Disease Stage | Description | Gene Ratio | Bg Ratio | pvalue | p.adjust | Count |
| Page: 1 |
| Pathway ID | Tissue | Disease Stage | Description | Gene Ratio | Bg Ratio | pvalue | p.adjust | qvalue | Count |
| Page: 1 |
Top |
Cell-cell communication analysis |
| Identification of potential cell-cell interactions between two cell types and their ligand-receptor pairs for different disease states |
| Ligand | Receptor | LRpair | Pathway | Tissue | Disease Stage |
| Page: 1 |
Top |
Single-cell gene regulatory network inference analysis |
| Find out the significant the regulons (TFs) and the target genes of each regulon across cell types for different disease states |
| TF | Cell Type | Tissue | Disease Stage | Target Gene | RSS | Regulon Activity |
| ∗The dot plots of a searched regulon are shown for all cell subpopulations in each disease state of each tissue based on the regulon specific score inferred using pySCENIC and by calculating the average expression. |
| Page: 1 |
Top |
Somatic mutation of malignant transformation related genes |
| Annotation of somatic variants for genes involved in malignant transformation |
| Hugo Symbol | Variant Class | Variant Classification | dbSNP RS | HGVSc | HGVSp | HGVSp Short | SWISSPROT | BIOTYPE | SIFT | PolyPhen | Tumor Sample Barcode | Tissue | Histology | Sex | Age | Stage | Therapy Types | Drugs | Outcome |
| TNRC18 | SNV | Missense_Mutation | novel | c.666N>C | p.Lys222Asn | p.K222N | O15417 | protein_coding | deleterious(0) | possibly_damaging(0.888) | TCGA-5L-AAT1-01 | Breast | breast invasive carcinoma | Female | <65 | III/IV | Hormone Therapy | letrozol | SD |
| TNRC18 | SNV | Missense_Mutation | c.4952N>C | p.Ser1651Thr | p.S1651T | O15417 | protein_coding | tolerated(0.2) | benign(0.001) | TCGA-A2-A0YM-01 | Breast | breast invasive carcinoma | Female | >=65 | I/II | Unknown | Unknown | SD | |
| TNRC18 | SNV | Missense_Mutation | c.4736N>T | p.Ser1579Phe | p.S1579F | O15417 | protein_coding | tolerated(0.14) | benign(0.024) | TCGA-AC-A23H-01 | Breast | breast invasive carcinoma | Female | >=65 | I/II | Unknown | Unknown | PD | |
| TNRC18 | SNV | Missense_Mutation | rs570365021 | c.4457N>A | p.Arg1486Gln | p.R1486Q | O15417 | protein_coding | tolerated(0.14) | benign(0.429) | TCGA-AC-A3W6-01 | Breast | breast invasive carcinoma | Female | >=65 | III/IV | Unknown | Unknown | SD |
| TNRC18 | SNV | Missense_Mutation | novel | c.374C>A | p.Pro125Gln | p.P125Q | O15417 | protein_coding | deleterious(0) | probably_damaging(0.963) | TCGA-AC-A8OQ-01 | Breast | breast invasive carcinoma | Female | >=65 | I/II | Unknown | Unknown | SD |
| TNRC18 | SNV | Missense_Mutation | rs561713828 | c.6250N>A | p.Ala2084Thr | p.A2084T | O15417 | protein_coding | tolerated(0.69) | benign(0) | TCGA-AQ-A54N-01 | Breast | breast invasive carcinoma | Female | <65 | I/II | Unknown | Unknown | SD |
| TNRC18 | SNV | Missense_Mutation | c.4189G>C | p.Glu1397Gln | p.E1397Q | O15417 | protein_coding | deleterious(0) | probably_damaging(0.996) | TCGA-BH-A18J-01 | Breast | breast invasive carcinoma | Female | <65 | III/IV | Unknown | Unknown | PD | |
| TNRC18 | SNV | Missense_Mutation | rs748222615 | c.4993T>G | p.Tyr1665Asp | p.Y1665D | O15417 | protein_coding | deleterious(0) | possibly_damaging(0.642) | TCGA-D8-A142-01 | Breast | breast invasive carcinoma | Female | >=65 | I/II | Chemotherapy | cyclophosphamid | SD |
| TNRC18 | SNV | Missense_Mutation | c.8634N>A | p.Asp2878Glu | p.D2878E | O15417 | protein_coding | tolerated(0.06) | possibly_damaging(0.545) | TCGA-D8-A1Y0-01 | Breast | breast invasive carcinoma | Female | >=65 | III/IV | Chemotherapy | cyclophosphamide+methotrexatum+fluorouracillum | SD | |
| TNRC18 | SNV | Missense_Mutation | c.8824N>A | p.Glu2942Lys | p.E2942K | O15417 | protein_coding | deleterious(0.01) | probably_damaging(0.999) | TCGA-GM-A2DO-01 | Breast | breast invasive carcinoma | Female | <65 | I/II | Hormone Therapy | tamoxiphen | CR |
| Page: 1 2 3 4 5 6 7 8 9 10 11 12 13 14 15 16 17 18 19 20 |
Top |
Related drugs of malignant transformation related genes |
| Identification of chemicals and drugs interact with genes involved in malignant transfromation |
| (DGIdb 4.0) |
| Entrez ID | Symbol | Category | Interaction Types | Drug Claim Name | Drug Name | PMIDs |
| Page: 1 |

Copyright 2023-Present -The University of Texas Health Science Center at Houston |