| Tissue | Expression Dynamics | Abbreviation |
| Endometrium | 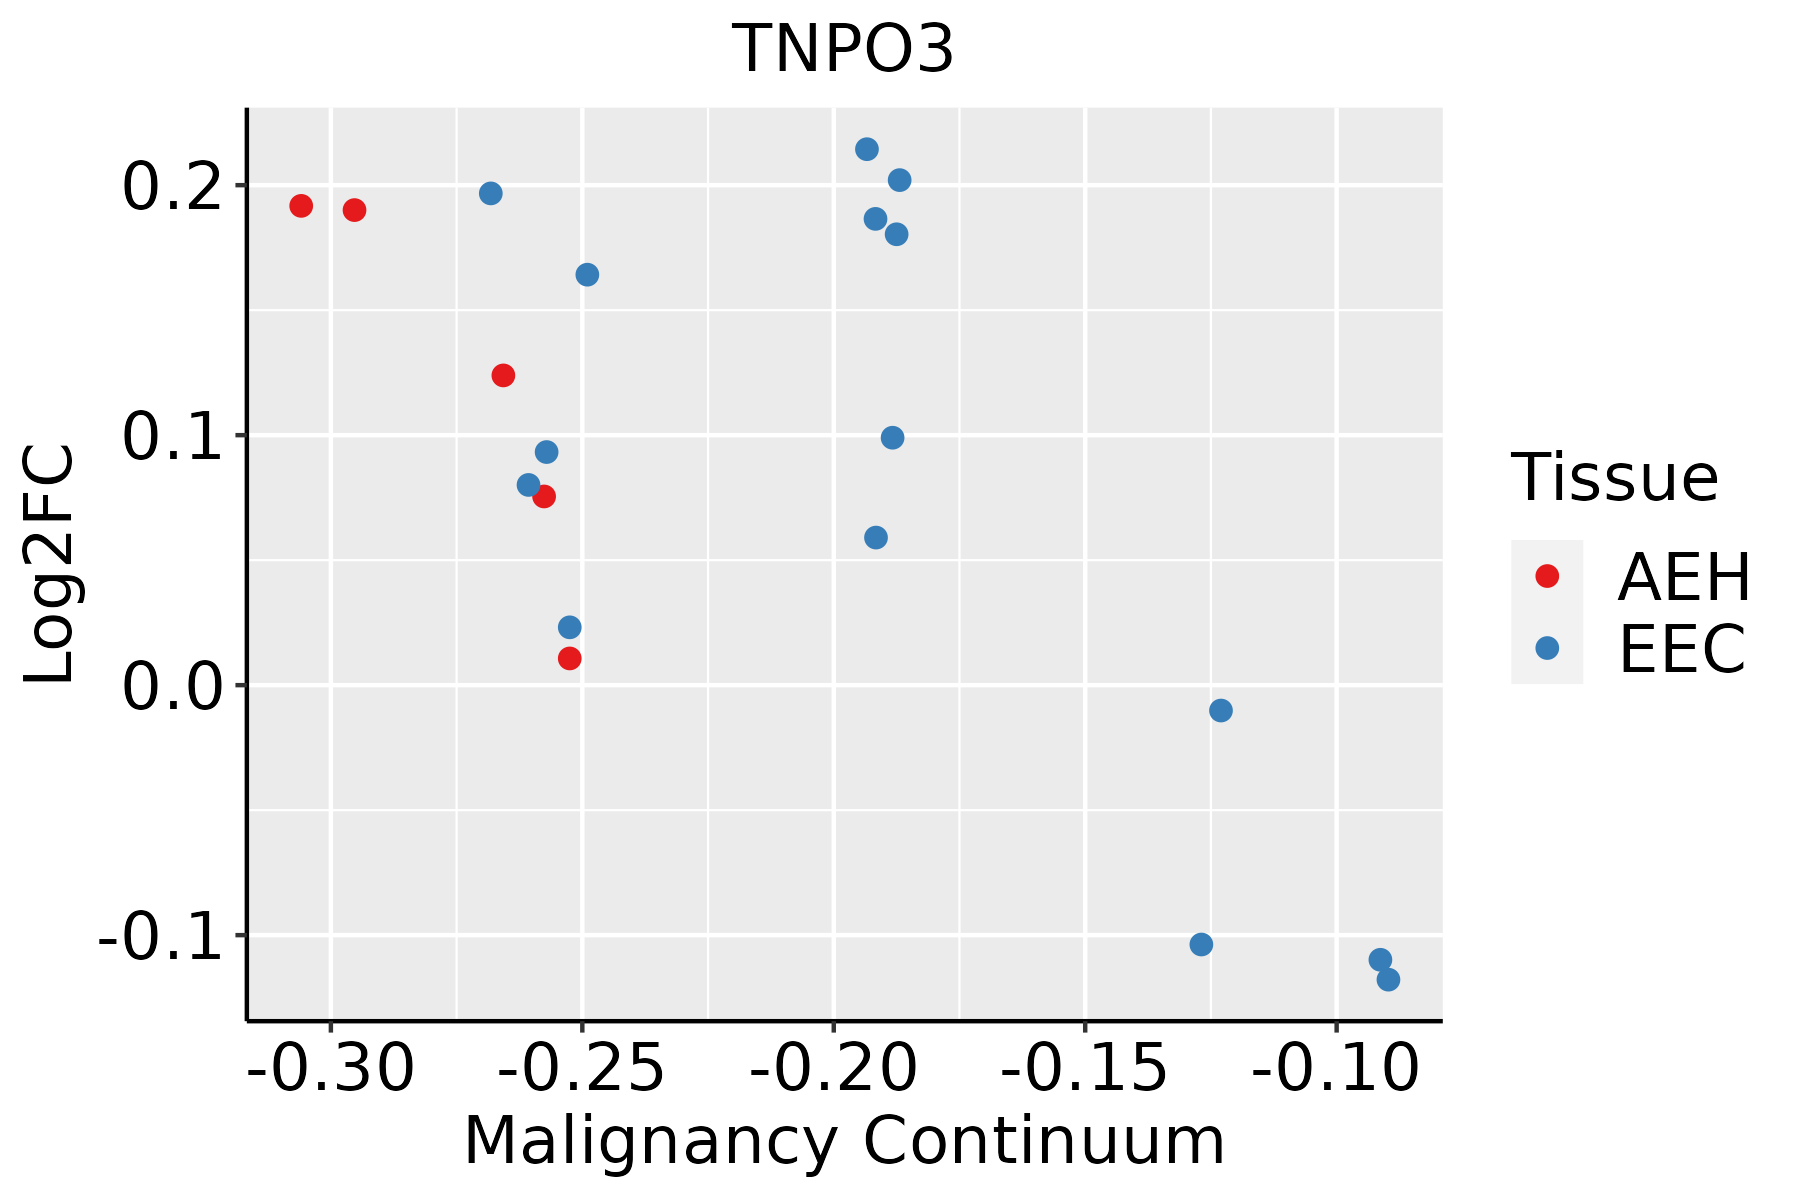 | AEH: Atypical endometrial hyperplasia |
| EEC: Endometrioid Cancer |
| Esophagus |  | ESCC: Esophageal squamous cell carcinoma |
| HGIN: High-grade intraepithelial neoplasias |
| LGIN: Low-grade intraepithelial neoplasias |
| Liver |  | HCC: Hepatocellular carcinoma |
| NAFLD: Non-alcoholic fatty liver disease |
| Lung | 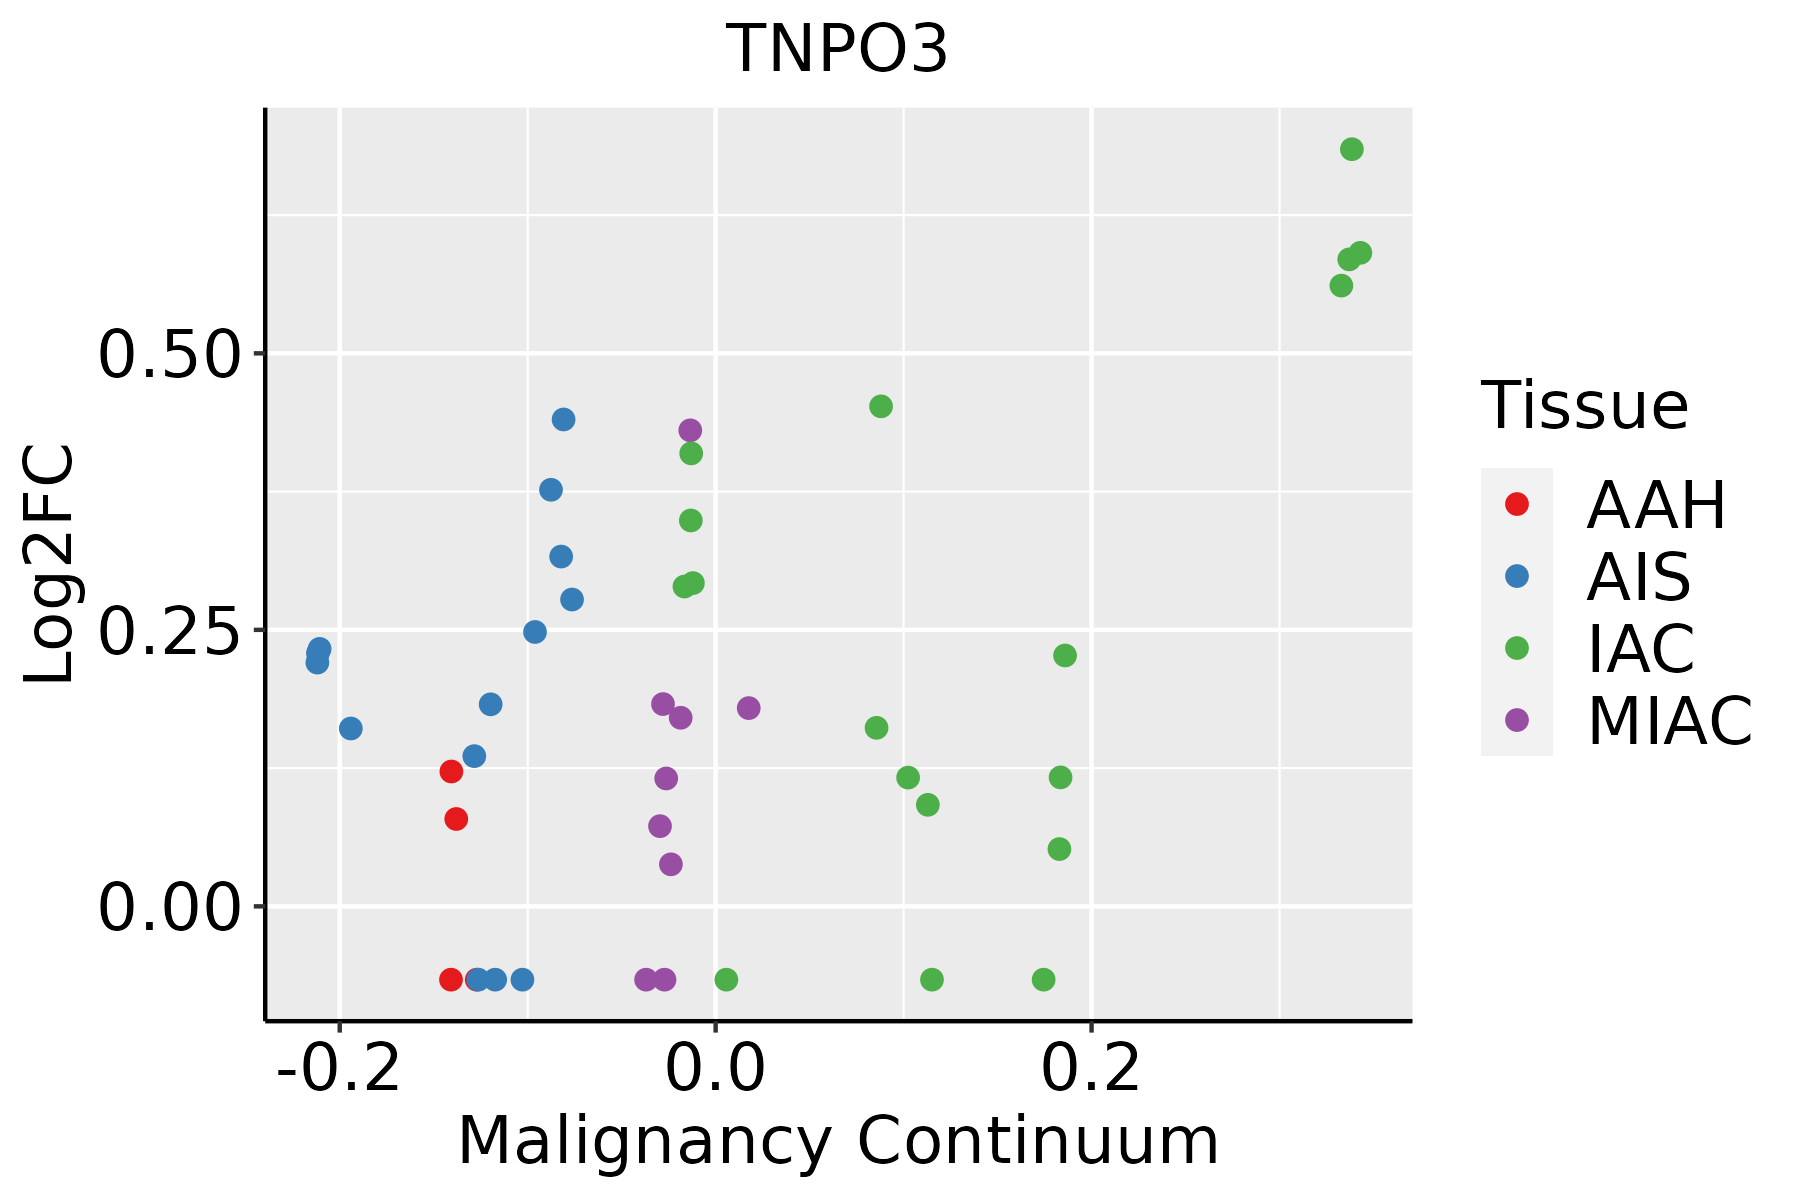 | AAH: Atypical adenomatous hyperplasia |
| AIS: Adenocarcinoma in situ |
| IAC: Invasive lung adenocarcinoma |
| MIA: Minimally invasive adenocarcinoma |
| Oral Cavity | 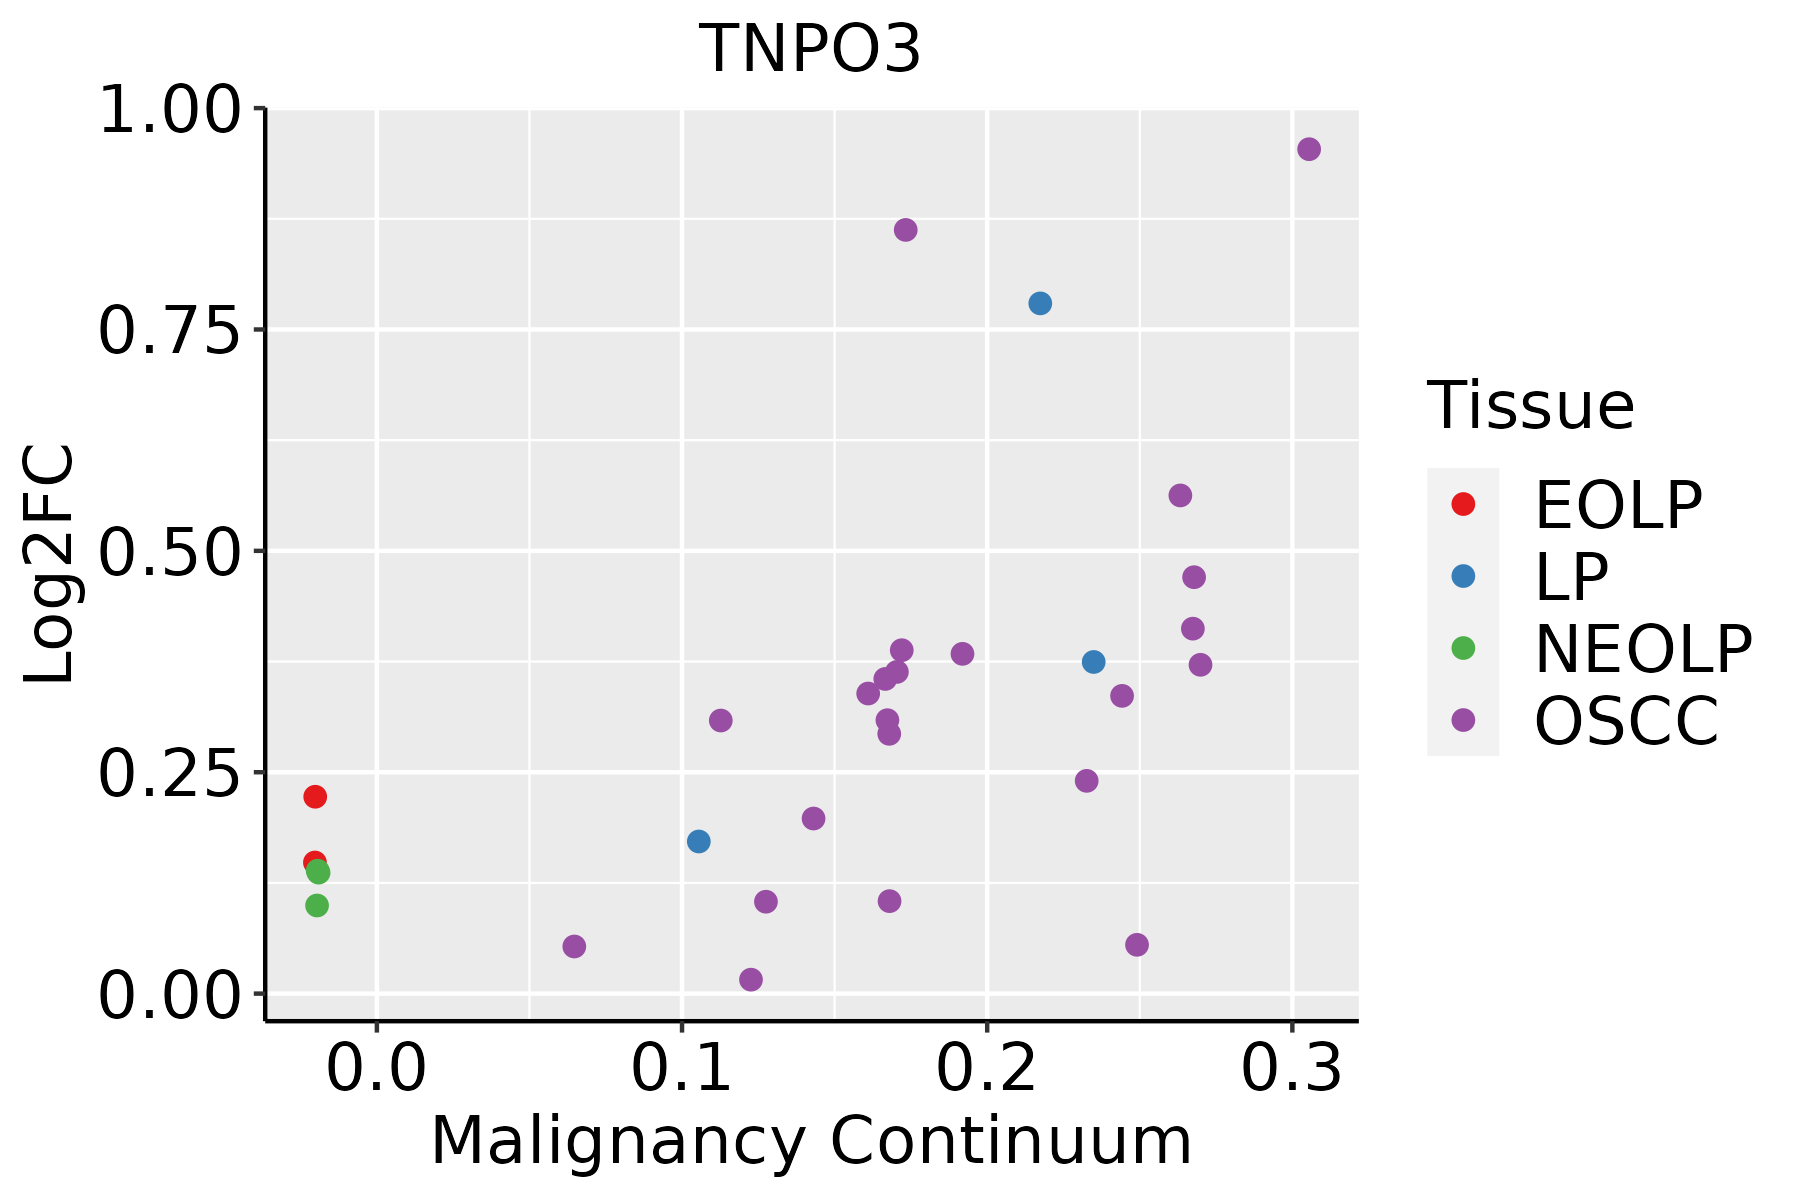 | EOLP: Erosive Oral lichen planus |
| LP: leukoplakia |
| NEOLP: Non-erosive oral lichen planus |
| OSCC: Oral squamous cell carcinoma |
| Thyroid |  | ATC: Anaplastic thyroid cancer |
| HT: Hashimoto's thyroiditis |
| PTC: Papillary thyroid cancer |
| GO ID | Tissue | Disease Stage | Description | Gene Ratio | Bg Ratio | pvalue | p.adjust | Count |
| GO:007259415 | Endometrium | EEC | establishment of protein localization to organelle | 94/2168 | 422/18723 | 2.22e-10 | 2.51e-08 | 94 |
| GO:003450413 | Endometrium | EEC | protein localization to nucleus | 60/2168 | 290/18723 | 5.09e-06 | 1.26e-04 | 60 |
| GO:000691314 | Endometrium | EEC | nucleocytoplasmic transport | 59/2168 | 301/18723 | 3.31e-05 | 5.65e-04 | 59 |
| GO:005116914 | Endometrium | EEC | nuclear transport | 59/2168 | 301/18723 | 3.31e-05 | 5.65e-04 | 59 |
| GO:001703813 | Endometrium | EEC | protein import | 40/2168 | 206/18723 | 6.94e-04 | 6.66e-03 | 40 |
| GO:0072594110 | Esophagus | ESCC | establishment of protein localization to organelle | 311/8552 | 422/18723 | 3.02e-32 | 2.13e-29 | 311 |
| GO:0006913110 | Esophagus | ESCC | nucleocytoplasmic transport | 230/8552 | 301/18723 | 6.04e-28 | 2.02e-25 | 230 |
| GO:0051169110 | Esophagus | ESCC | nuclear transport | 230/8552 | 301/18723 | 6.04e-28 | 2.02e-25 | 230 |
| GO:003450418 | Esophagus | ESCC | protein localization to nucleus | 211/8552 | 290/18723 | 4.06e-21 | 6.60e-19 | 211 |
| GO:001703818 | Esophagus | ESCC | protein import | 149/8552 | 206/18723 | 5.90e-15 | 3.31e-13 | 149 |
| GO:005117014 | Esophagus | ESCC | import into nucleus | 111/8552 | 159/18723 | 5.69e-10 | 1.44e-08 | 111 |
| GO:000660613 | Esophagus | ESCC | protein import into nucleus | 108/8552 | 155/18723 | 1.16e-09 | 2.77e-08 | 108 |
| GO:00069137 | Liver | NAFLD | nucleocytoplasmic transport | 51/1882 | 301/18723 | 1.39e-04 | 2.62e-03 | 51 |
| GO:00511697 | Liver | NAFLD | nuclear transport | 51/1882 | 301/18723 | 1.39e-04 | 2.62e-03 | 51 |
| GO:00725947 | Liver | NAFLD | establishment of protein localization to organelle | 62/1882 | 422/18723 | 1.48e-03 | 1.64e-02 | 62 |
| GO:00345046 | Liver | NAFLD | protein localization to nucleus | 45/1882 | 290/18723 | 2.16e-03 | 2.10e-02 | 45 |
| GO:007259422 | Liver | HCC | establishment of protein localization to organelle | 299/7958 | 422/18723 | 1.06e-32 | 6.10e-30 | 299 |
| GO:000691322 | Liver | HCC | nucleocytoplasmic transport | 208/7958 | 301/18723 | 5.51e-21 | 8.12e-19 | 208 |
| GO:005116922 | Liver | HCC | nuclear transport | 208/7958 | 301/18723 | 5.51e-21 | 8.12e-19 | 208 |
| GO:003450421 | Liver | HCC | protein localization to nucleus | 194/7958 | 290/18723 | 2.84e-17 | 2.85e-15 | 194 |
| Pathway ID | Tissue | Disease Stage | Description | Gene Ratio | Bg Ratio | pvalue | p.adjust | qvalue | Count |
| hsa0301321 | Esophagus | ESCC | Nucleocytoplasmic transport | 89/4205 | 108/8465 | 1.20e-12 | 2.37e-11 | 1.21e-11 | 89 |
| hsa032509 | Esophagus | ESCC | Viral life cycle - HIV-1 | 54/4205 | 63/8465 | 2.01e-09 | 2.17e-08 | 1.11e-08 | 54 |
| hsa0301331 | Esophagus | ESCC | Nucleocytoplasmic transport | 89/4205 | 108/8465 | 1.20e-12 | 2.37e-11 | 1.21e-11 | 89 |
| hsa0325014 | Esophagus | ESCC | Viral life cycle - HIV-1 | 54/4205 | 63/8465 | 2.01e-09 | 2.17e-08 | 1.11e-08 | 54 |
| hsa03013 | Liver | HCC | Nucleocytoplasmic transport | 81/4020 | 108/8465 | 4.28e-09 | 6.83e-08 | 3.80e-08 | 81 |
| hsa032502 | Liver | HCC | Viral life cycle - HIV-1 | 46/4020 | 63/8465 | 3.25e-05 | 1.88e-04 | 1.04e-04 | 46 |
| hsa030131 | Liver | HCC | Nucleocytoplasmic transport | 81/4020 | 108/8465 | 4.28e-09 | 6.83e-08 | 3.80e-08 | 81 |
| hsa0325011 | Liver | HCC | Viral life cycle - HIV-1 | 46/4020 | 63/8465 | 3.25e-05 | 1.88e-04 | 1.04e-04 | 46 |
| hsa030136 | Oral cavity | OSCC | Nucleocytoplasmic transport | 82/3704 | 108/8465 | 7.93e-12 | 1.33e-10 | 6.77e-11 | 82 |
| hsa032508 | Oral cavity | OSCC | Viral life cycle - HIV-1 | 45/3704 | 63/8465 | 7.62e-06 | 3.59e-05 | 1.83e-05 | 45 |
| hsa0301311 | Oral cavity | OSCC | Nucleocytoplasmic transport | 82/3704 | 108/8465 | 7.93e-12 | 1.33e-10 | 6.77e-11 | 82 |
| hsa0325013 | Oral cavity | OSCC | Viral life cycle - HIV-1 | 45/3704 | 63/8465 | 7.62e-06 | 3.59e-05 | 1.83e-05 | 45 |
| hsa030132 | Oral cavity | LP | Nucleocytoplasmic transport | 53/2418 | 108/8465 | 4.68e-06 | 4.10e-05 | 2.64e-05 | 53 |
| hsa0325022 | Oral cavity | LP | Viral life cycle - HIV-1 | 32/2418 | 63/8465 | 1.55e-04 | 9.08e-04 | 5.86e-04 | 32 |
| hsa030133 | Oral cavity | LP | Nucleocytoplasmic transport | 53/2418 | 108/8465 | 4.68e-06 | 4.10e-05 | 2.64e-05 | 53 |
| hsa0325031 | Oral cavity | LP | Viral life cycle - HIV-1 | 32/2418 | 63/8465 | 1.55e-04 | 9.08e-04 | 5.86e-04 | 32 |
| hsa030134 | Oral cavity | EOLP | Nucleocytoplasmic transport | 34/1218 | 108/8465 | 4.24e-06 | 2.91e-05 | 1.72e-05 | 34 |
| hsa0325041 | Oral cavity | EOLP | Viral life cycle - HIV-1 | 16/1218 | 63/8465 | 1.46e-02 | 3.77e-02 | 2.22e-02 | 16 |
| hsa030135 | Oral cavity | EOLP | Nucleocytoplasmic transport | 34/1218 | 108/8465 | 4.24e-06 | 2.91e-05 | 1.72e-05 | 34 |
| hsa032505 | Oral cavity | EOLP | Viral life cycle - HIV-1 | 16/1218 | 63/8465 | 1.46e-02 | 3.77e-02 | 2.22e-02 | 16 |
| Hugo Symbol | Variant Class | Variant Classification | dbSNP RS | HGVSc | HGVSp | HGVSp Short | SWISSPROT | BIOTYPE | SIFT | PolyPhen | Tumor Sample Barcode | Tissue | Histology | Sex | Age | Stage | Therapy Types | Drugs | Outcome |
| TNPO3 | SNV | Missense_Mutation | | c.839N>G | p.Tyr280Cys | p.Y280C | Q9Y5L0 | protein_coding | deleterious(0) | probably_damaging(0.962) | TCGA-AN-A0AK-01 | Breast | breast invasive carcinoma | Female | >=65 | I/II | Unknown | Unknown | SD |
| TNPO3 | SNV | Missense_Mutation | | c.254C>G | p.Ser85Cys | p.S85C | Q9Y5L0 | protein_coding | deleterious(0) | possibly_damaging(0.779) | TCGA-AR-A24U-01 | Breast | breast invasive carcinoma | Female | <65 | I/II | Chemotherapy | doxorubicin | SD |
| TNPO3 | SNV | Missense_Mutation | rs370293580 | c.1616N>G | p.Asn539Ser | p.N539S | Q9Y5L0 | protein_coding | tolerated(1) | benign(0.005) | TCGA-B6-A0I1-01 | Breast | breast invasive carcinoma | Female | >=65 | I/II | Unknown | Unknown | PD |
| TNPO3 | SNV | Missense_Mutation | | c.266N>T | p.Ser89Leu | p.S89L | Q9Y5L0 | protein_coding | deleterious(0) | probably_damaging(0.988) | TCGA-BH-A0AW-01 | Breast | breast invasive carcinoma | Female | <65 | I/II | Chemotherapy | carboplatin | SD |
| TNPO3 | SNV | Missense_Mutation | | c.647N>A | p.Ser216Asn | p.S216N | Q9Y5L0 | protein_coding | tolerated(0.52) | benign(0.021) | TCGA-BH-A18G-01 | Breast | breast invasive carcinoma | Female | >=65 | I/II | Unknown | Unknown | SD |
| TNPO3 | SNV | Missense_Mutation | novel | c.769N>C | p.Glu257Gln | p.E257Q | Q9Y5L0 | protein_coding | tolerated(0.07) | probably_damaging(0.959) | TCGA-XX-A89A-01 | Breast | breast invasive carcinoma | Female | >=65 | I/II | Unknown | Unknown | SD |
| TNPO3 | insertion | Frame_Shift_Ins | novel | c.481_482insGT | p.Ile161SerfsTer11 | p.I161Sfs*11 | Q9Y5L0 | protein_coding | | | TCGA-AR-A0U2-01 | Breast | breast invasive carcinoma | Female | <65 | III/IV | Hormone Therapy | tamoxiphen | PD |
| TNPO3 | insertion | Frame_Shift_Ins | rs761308428 | c.2541_2542insC | p.Tyr848LeufsTer8 | p.Y848Lfs*8 | Q9Y5L0 | protein_coding | | | TCGA-E9-A1NI-01 | Breast | breast invasive carcinoma | Female | <65 | I/II | Chemotherapy | doxorubicin | CR |
| TNPO3 | SNV | Missense_Mutation | | c.2323C>A | p.Pro775Thr | p.P775T | Q9Y5L0 | protein_coding | tolerated(0.12) | benign(0.005) | TCGA-FU-A3EO-01 | Cervix | cervical & endocervical cancer | Female | <65 | I/II | Unknown | Unknown | SD |
| TNPO3 | SNV | Missense_Mutation | | c.859N>A | p.Glu287Lys | p.E287K | Q9Y5L0 | protein_coding | deleterious(0) | possibly_damaging(0.863) | TCGA-JW-A5VL-01 | Cervix | cervical & endocervical cancer | Female | <65 | I/II | Unknown | Unknown | SD |


