
|
|||||
|
 | |
| |
| |
| |
| |
| |
|
Gene: TNPO1 |
Gene summary for TNPO1 |
| Gene information | Species | Human | Gene symbol | TNPO1 | Gene ID | 3842 |
| Gene name | transportin 1 | |
| Gene Alias | IPO2 | |
| Cytomap | 5q13.2 | |
| Gene Type | protein-coding | GO ID | GO:0006606 | UniProtAcc | A0A024RAM0 |
Top |
Malignant transformation analysis |
| Identification of the aberrant gene expression in precancerous and cancerous lesions by comparing the gene expression of stem-like cells in diseased tissues with normal stem cells |
| Entrez ID | Symbol | Replicates | Species | Organ | Tissue | Adj P-value | Log2FC | Malignancy |
| 3842 | TNPO1 | CCI_2 | Human | Cervix | CC | 3.41e-02 | 6.73e-01 | 0.5249 |
| 3842 | TNPO1 | CCI_3 | Human | Cervix | CC | 1.39e-02 | 5.18e-01 | 0.516 |
| 3842 | TNPO1 | LZE2T | Human | Esophagus | ESCC | 6.36e-06 | 6.63e-01 | 0.082 |
| 3842 | TNPO1 | LZE4T | Human | Esophagus | ESCC | 8.20e-13 | 8.11e-01 | 0.0811 |
| 3842 | TNPO1 | LZE5T | Human | Esophagus | ESCC | 1.88e-07 | -1.53e-02 | 0.0514 |
| 3842 | TNPO1 | LZE7T | Human | Esophagus | ESCC | 4.37e-05 | 5.07e-01 | 0.0667 |
| 3842 | TNPO1 | LZE8T | Human | Esophagus | ESCC | 1.21e-15 | 5.00e-02 | 0.067 |
| 3842 | TNPO1 | LZE20T | Human | Esophagus | ESCC | 2.80e-05 | 4.51e-02 | 0.0662 |
| 3842 | TNPO1 | LZE24T | Human | Esophagus | ESCC | 8.97e-16 | 3.36e-01 | 0.0596 |
| 3842 | TNPO1 | LZE21T | Human | Esophagus | ESCC | 3.91e-03 | 2.42e-01 | 0.0655 |
| 3842 | TNPO1 | LZE6T | Human | Esophagus | ESCC | 2.57e-10 | 1.16e-01 | 0.0845 |
| 3842 | TNPO1 | P1T-E | Human | Esophagus | ESCC | 3.53e-12 | 1.97e-01 | 0.0875 |
| 3842 | TNPO1 | P2T-E | Human | Esophagus | ESCC | 6.87e-48 | 8.58e-01 | 0.1177 |
| 3842 | TNPO1 | P4T-E | Human | Esophagus | ESCC | 1.35e-21 | 3.33e-01 | 0.1323 |
| 3842 | TNPO1 | P5T-E | Human | Esophagus | ESCC | 1.92e-16 | 3.27e-02 | 0.1327 |
| 3842 | TNPO1 | P8T-E | Human | Esophagus | ESCC | 1.05e-22 | 2.10e-01 | 0.0889 |
| 3842 | TNPO1 | P9T-E | Human | Esophagus | ESCC | 3.09e-15 | 4.45e-01 | 0.1131 |
| 3842 | TNPO1 | P10T-E | Human | Esophagus | ESCC | 8.58e-22 | 4.39e-01 | 0.116 |
| 3842 | TNPO1 | P11T-E | Human | Esophagus | ESCC | 1.70e-10 | 2.36e-01 | 0.1426 |
| 3842 | TNPO1 | P12T-E | Human | Esophagus | ESCC | 2.20e-21 | 4.63e-01 | 0.1122 |
| Page: 1 2 3 4 5 6 7 |
| Tissue | Expression Dynamics | Abbreviation |
| Cervix | 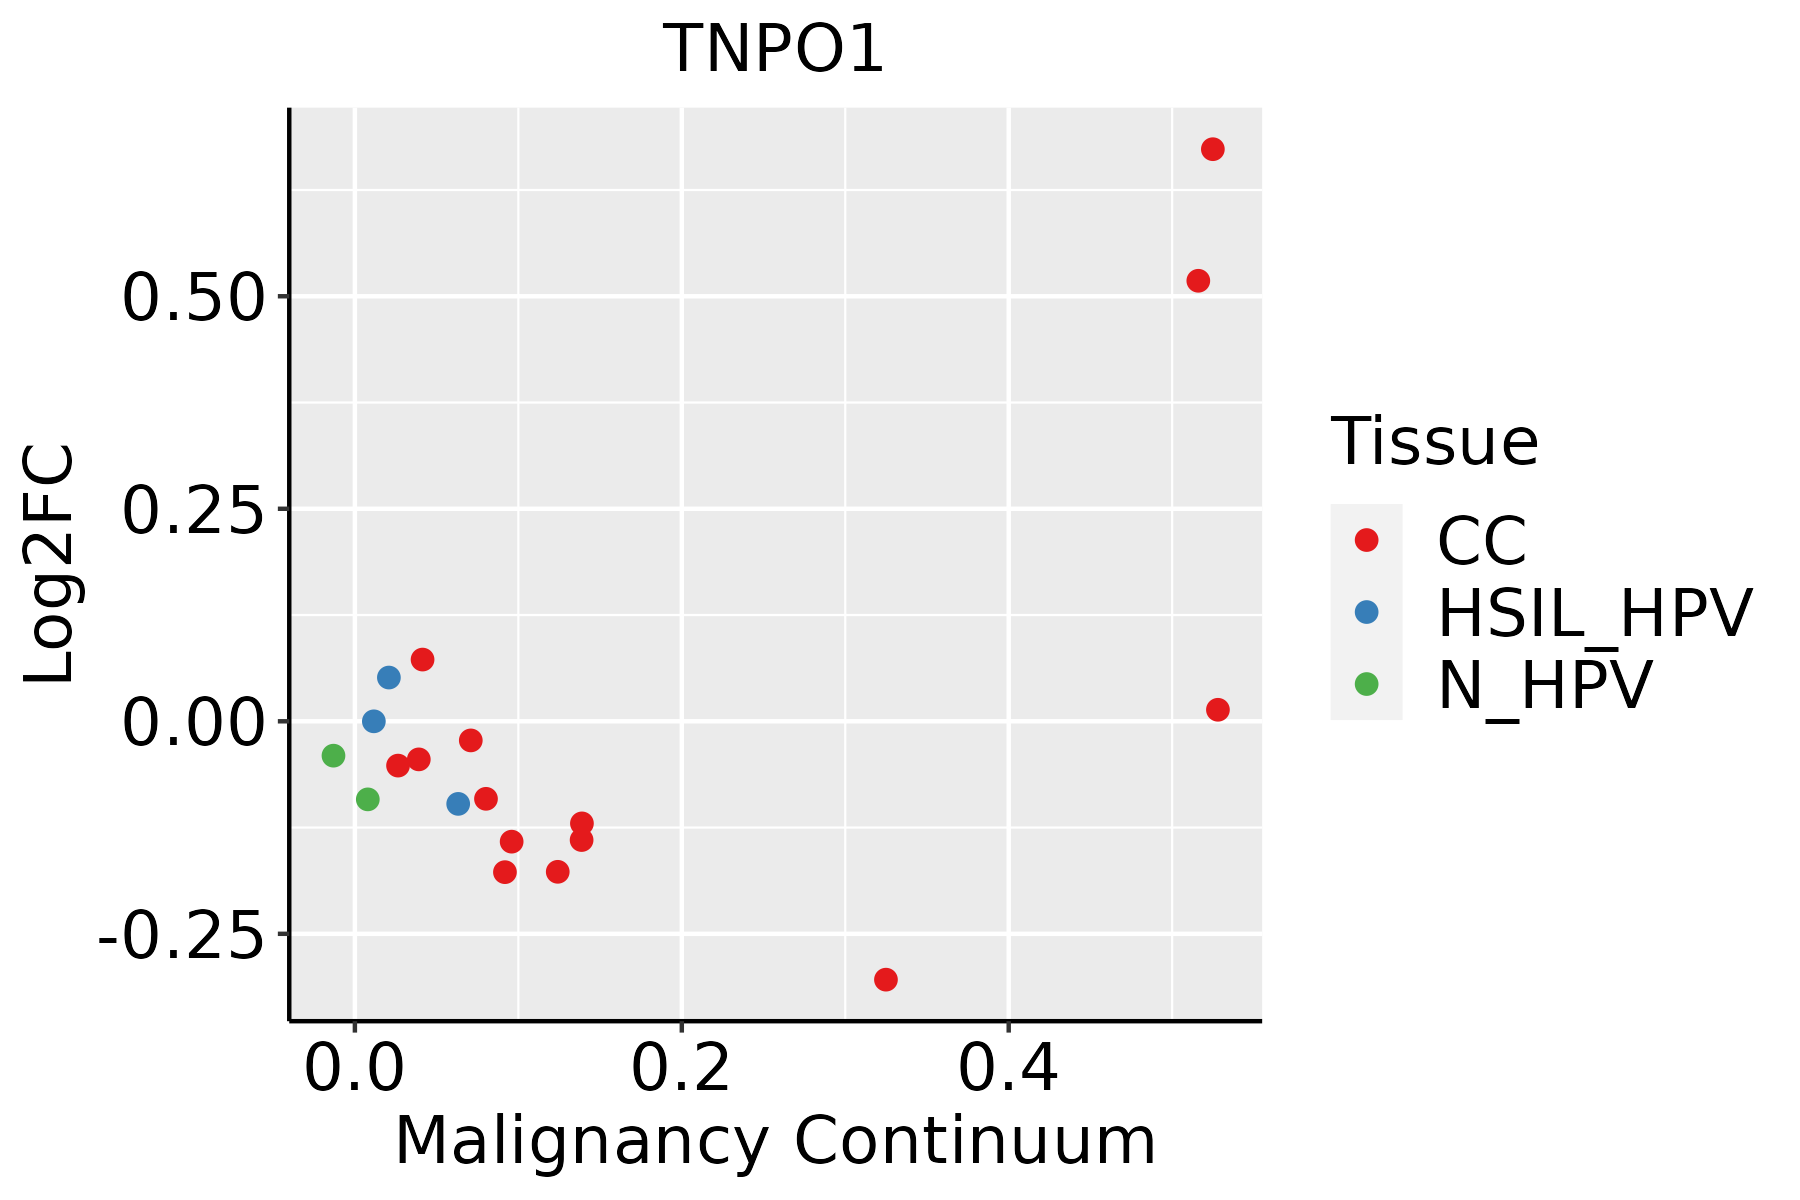 | CC: Cervix cancer |
| HSIL_HPV: HPV-infected high-grade squamous intraepithelial lesions | ||
| N_HPV: HPV-infected normal cervix | ||
| Esophagus |  | ESCC: Esophageal squamous cell carcinoma |
| HGIN: High-grade intraepithelial neoplasias | ||
| LGIN: Low-grade intraepithelial neoplasias | ||
| Liver | 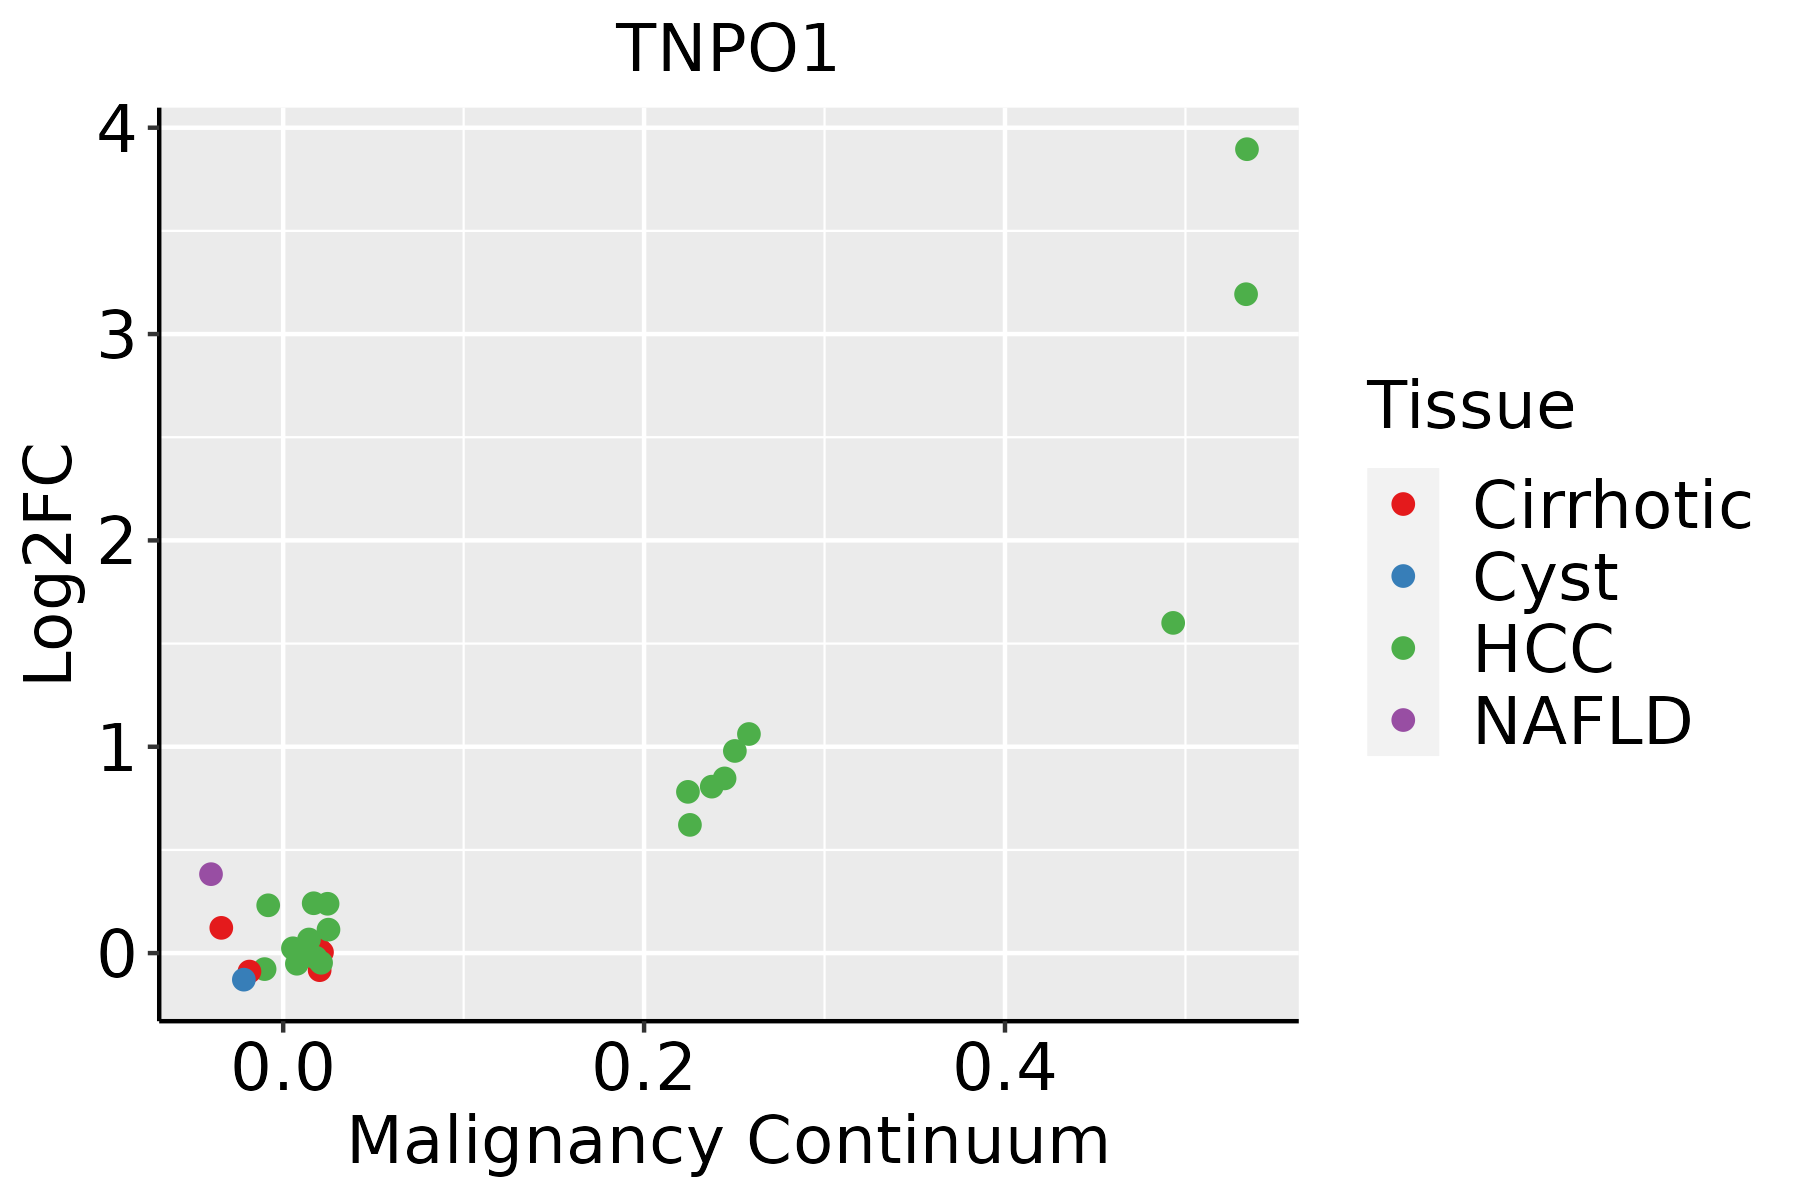 | HCC: Hepatocellular carcinoma |
| NAFLD: Non-alcoholic fatty liver disease | ||
| Oral Cavity | 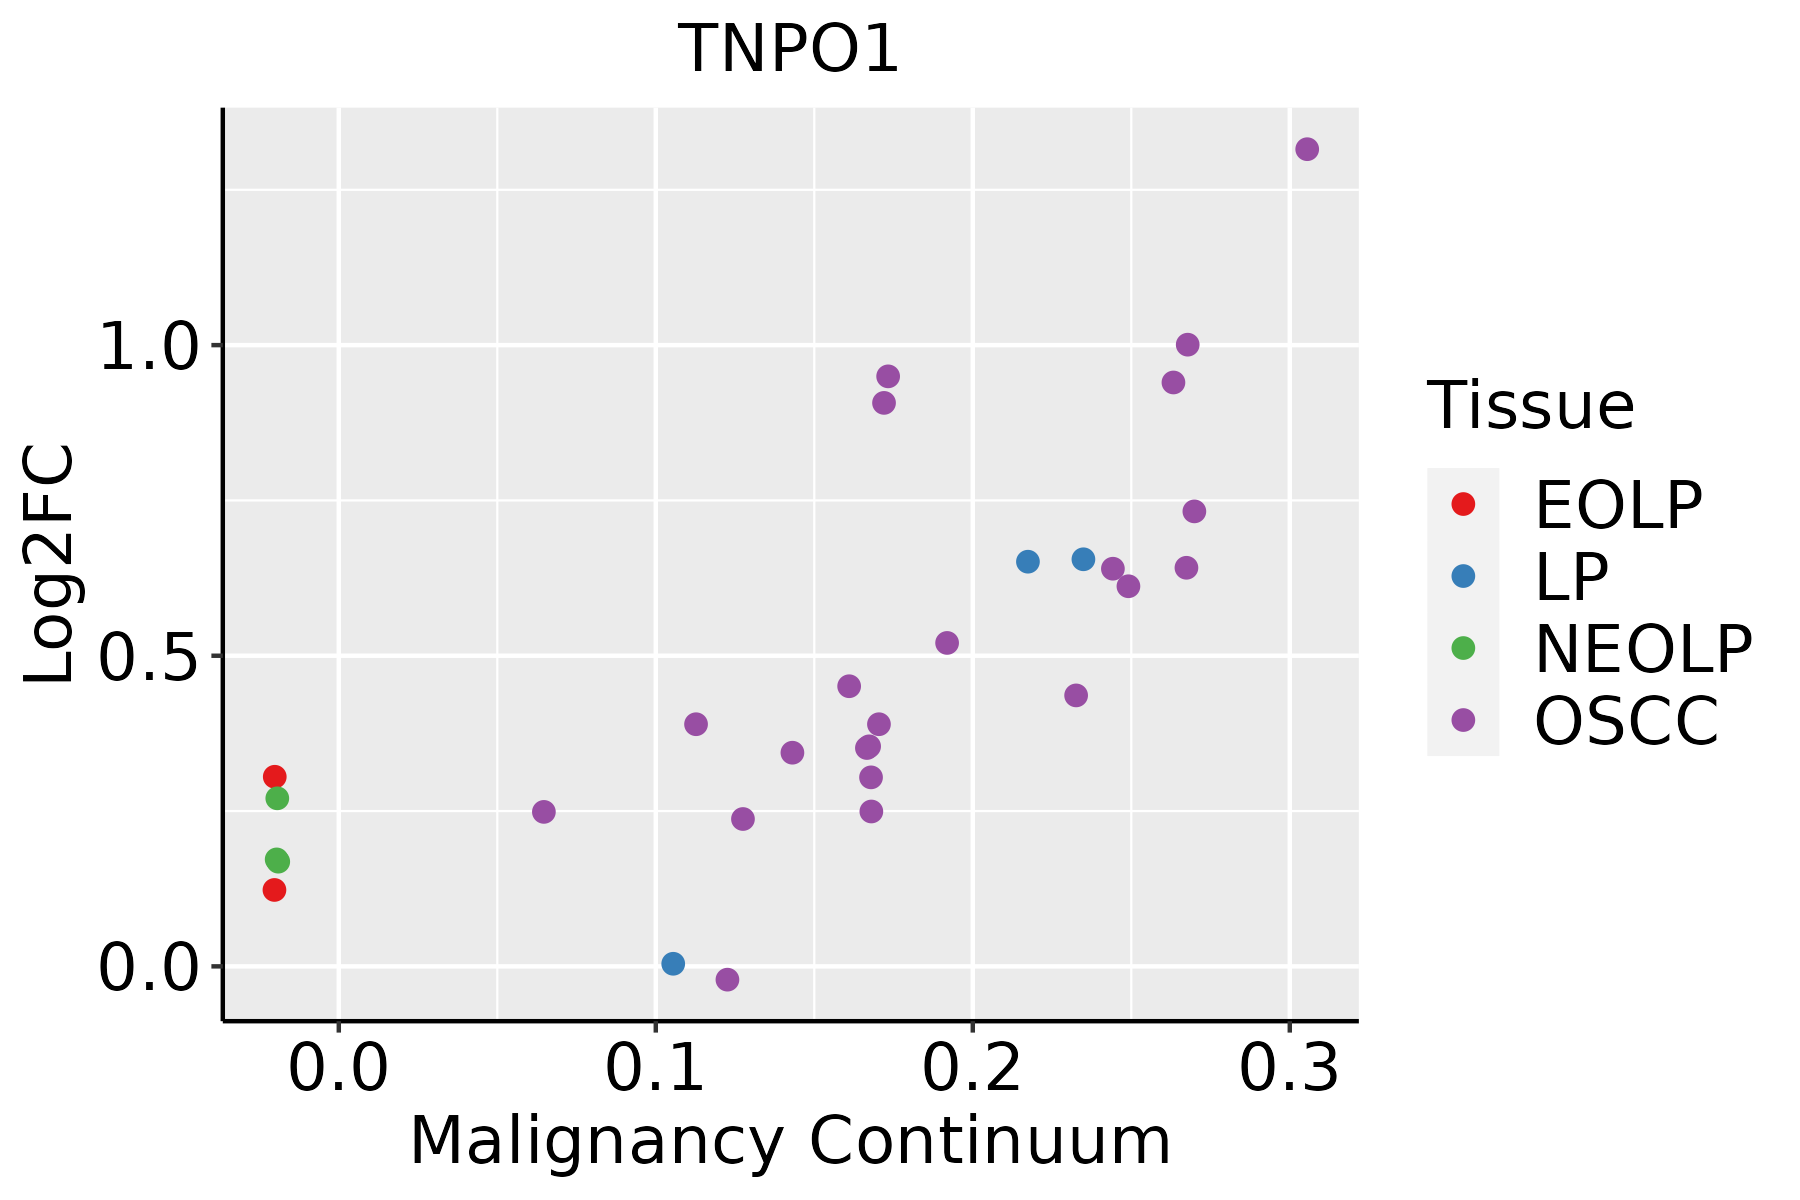 | EOLP: Erosive Oral lichen planus |
| LP: leukoplakia | ||
| NEOLP: Non-erosive oral lichen planus | ||
| OSCC: Oral squamous cell carcinoma | ||
| Prostate |  | BPH: Benign Prostatic Hyperplasia |
| Skin | 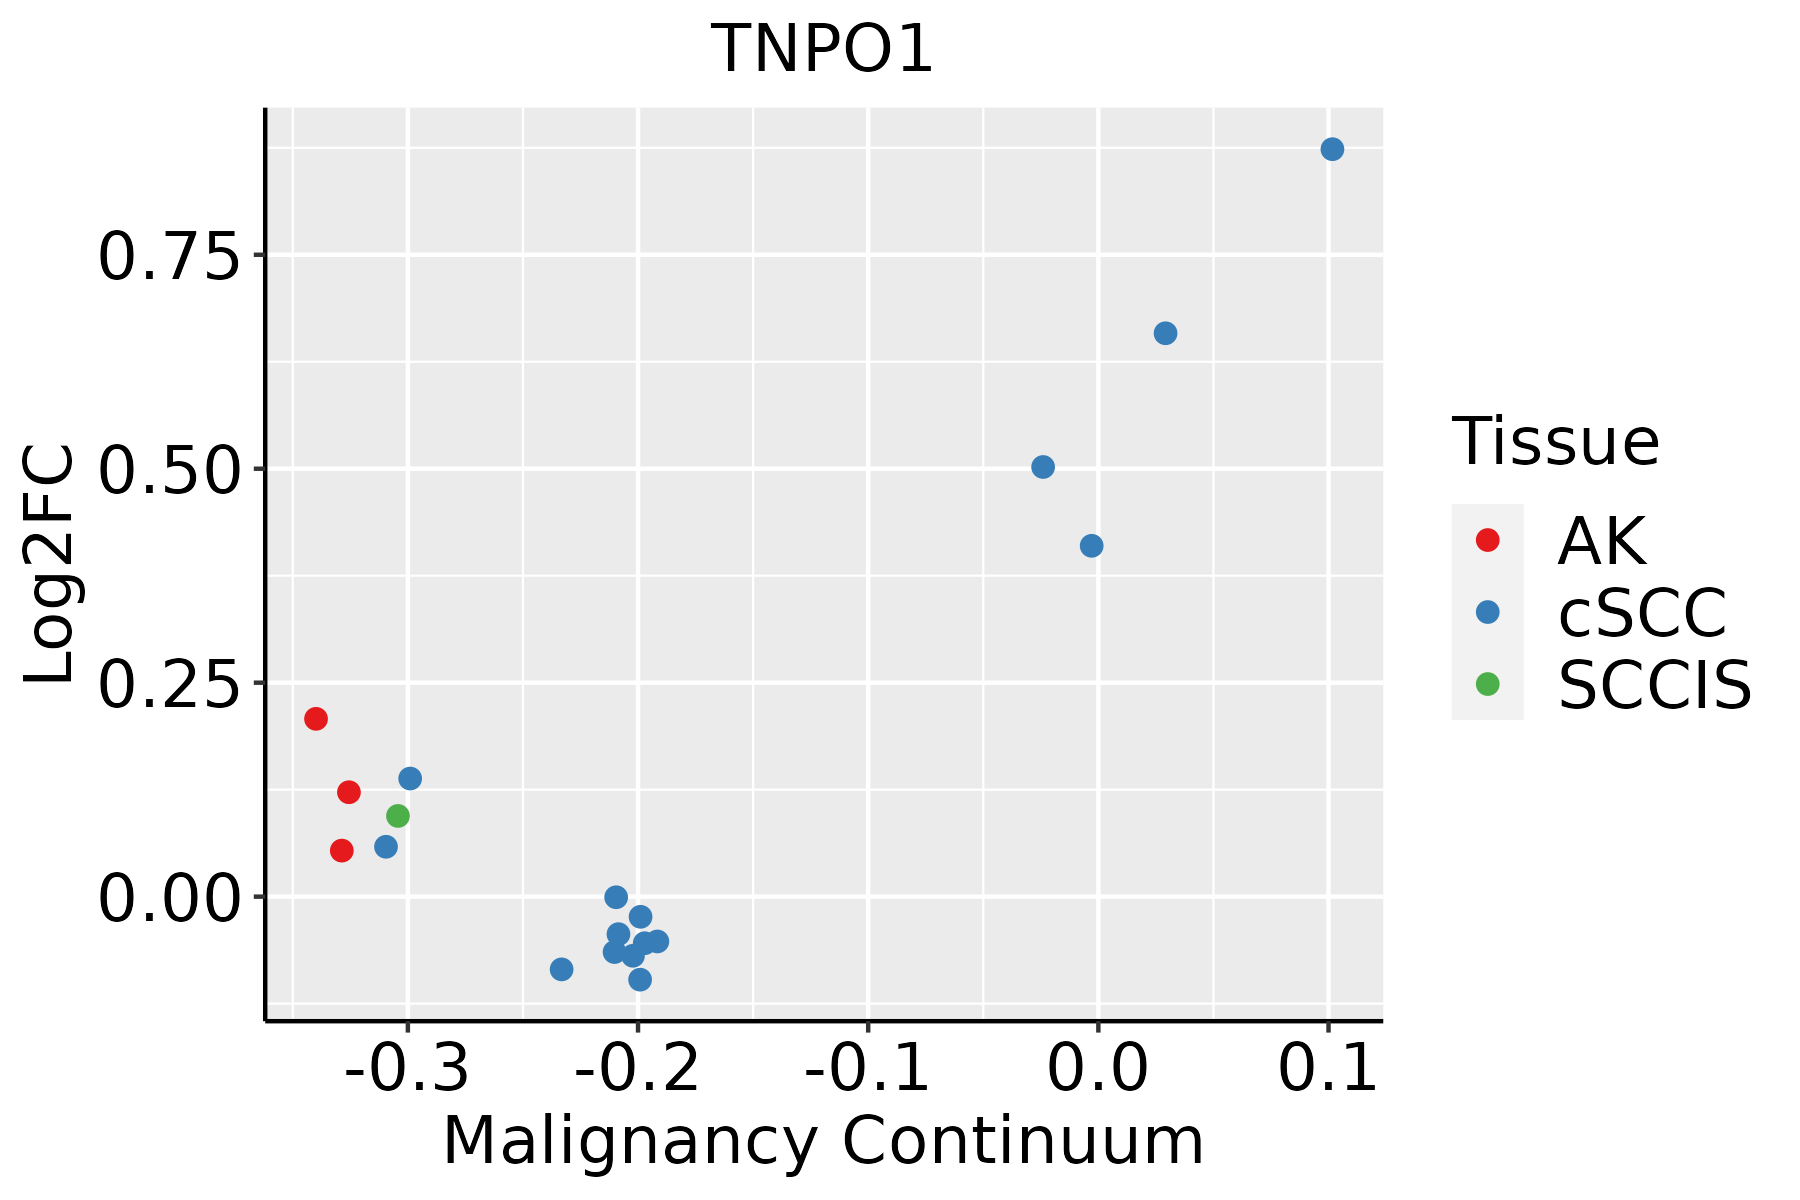 | AK: Actinic keratosis |
| cSCC: Cutaneous squamous cell carcinoma | ||
| SCCIS:squamous cell carcinoma in situ | ||
| Thyroid | 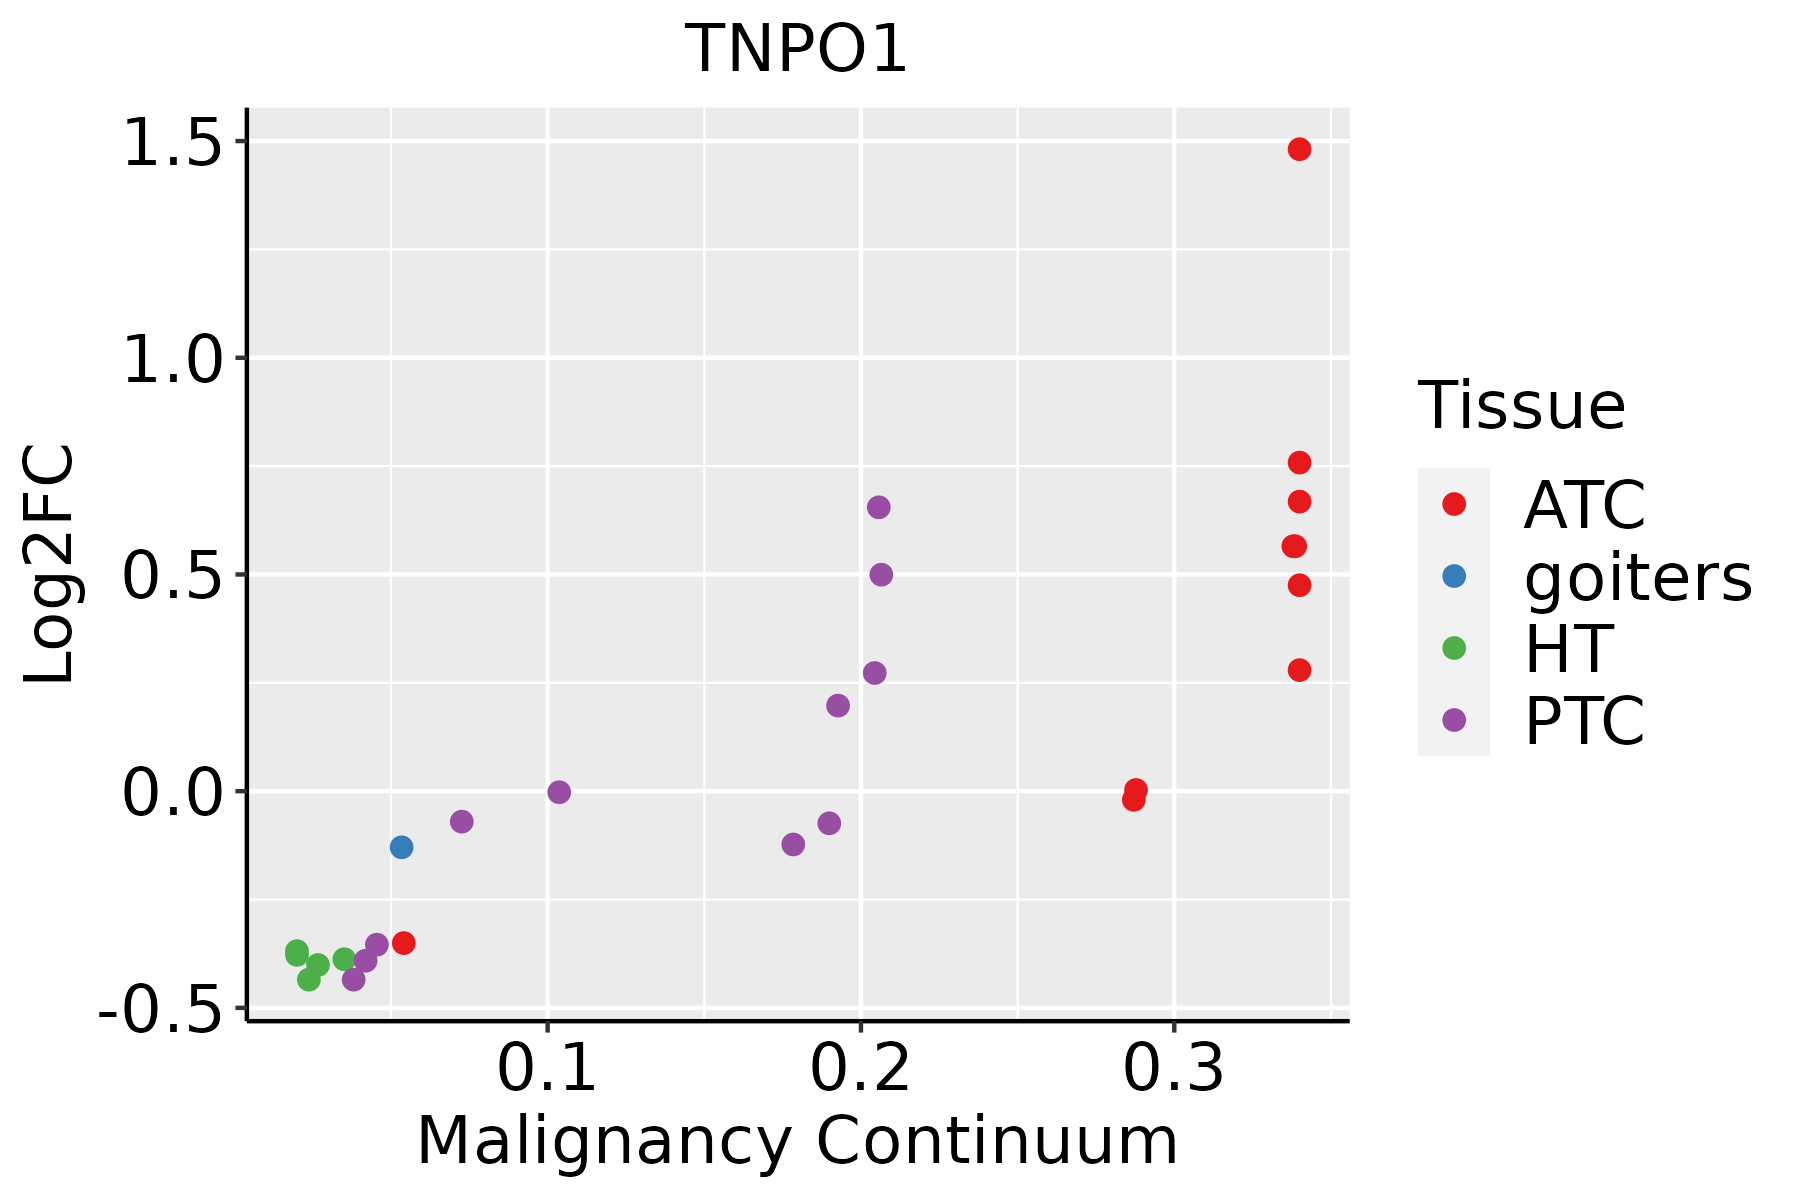 | ATC: Anaplastic thyroid cancer |
| HT: Hashimoto's thyroiditis | ||
| PTC: Papillary thyroid cancer |
| ∗log2FC in expression of this searched gene in stem-like cells from each diseased tissue sample relative to stem-like cells in normal samples in each tissue plotted against the malignancy continuum. Samples are colored based on if they are from different disease stage. |
Top |
Malignant transformation related pathway analysis |
| Find out the enriched GO biological processes and KEGG pathways involved in transition from healthy to precancer to cancer |
| Tissue | Disease Stage | Enriched GO biological Processes |
| Colorectum | AD |  |
| Colorectum | SER |  |
| Colorectum | MSS |  |
| Colorectum | MSI-H |  |
| Colorectum | FAP |  |
| ∗Top 15 enriched GO BP terms are showed in the bar plot of each disease state in each tissue. Each row represents a significant GO biological process which is colored according to the -log10(p.adjust). |
| Page: 1 2 3 4 5 6 7 8 9 |
| GO ID | Tissue | Disease Stage | Description | Gene Ratio | Bg Ratio | pvalue | p.adjust | Count |
| GO:00725949 | Cervix | CC | establishment of protein localization to organelle | 99/2311 | 422/18723 | 1.23e-10 | 2.11e-08 | 99 |
| GO:00069139 | Cervix | CC | nucleocytoplasmic transport | 71/2311 | 301/18723 | 4.04e-08 | 2.54e-06 | 71 |
| GO:00511699 | Cervix | CC | nuclear transport | 71/2311 | 301/18723 | 4.04e-08 | 2.54e-06 | 71 |
| GO:00345048 | Cervix | CC | protein localization to nucleus | 68/2311 | 290/18723 | 9.91e-08 | 5.25e-06 | 68 |
| GO:00170388 | Cervix | CC | protein import | 48/2311 | 206/18723 | 8.62e-06 | 1.98e-04 | 48 |
| GO:00511707 | Cervix | CC | import into nucleus | 38/2311 | 159/18723 | 3.98e-05 | 6.18e-04 | 38 |
| GO:00066067 | Cervix | CC | protein import into nucleus | 37/2311 | 155/18723 | 5.13e-05 | 7.71e-04 | 37 |
| GO:0072594110 | Esophagus | ESCC | establishment of protein localization to organelle | 311/8552 | 422/18723 | 3.02e-32 | 2.13e-29 | 311 |
| GO:0006913110 | Esophagus | ESCC | nucleocytoplasmic transport | 230/8552 | 301/18723 | 6.04e-28 | 2.02e-25 | 230 |
| GO:0051169110 | Esophagus | ESCC | nuclear transport | 230/8552 | 301/18723 | 6.04e-28 | 2.02e-25 | 230 |
| GO:003450418 | Esophagus | ESCC | protein localization to nucleus | 211/8552 | 290/18723 | 4.06e-21 | 6.60e-19 | 211 |
| GO:001703818 | Esophagus | ESCC | protein import | 149/8552 | 206/18723 | 5.90e-15 | 3.31e-13 | 149 |
| GO:005117014 | Esophagus | ESCC | import into nucleus | 111/8552 | 159/18723 | 5.69e-10 | 1.44e-08 | 111 |
| GO:000660613 | Esophagus | ESCC | protein import into nucleus | 108/8552 | 155/18723 | 1.16e-09 | 2.77e-08 | 108 |
| GO:00069137 | Liver | NAFLD | nucleocytoplasmic transport | 51/1882 | 301/18723 | 1.39e-04 | 2.62e-03 | 51 |
| GO:00511697 | Liver | NAFLD | nuclear transport | 51/1882 | 301/18723 | 1.39e-04 | 2.62e-03 | 51 |
| GO:00725947 | Liver | NAFLD | establishment of protein localization to organelle | 62/1882 | 422/18723 | 1.48e-03 | 1.64e-02 | 62 |
| GO:00345046 | Liver | NAFLD | protein localization to nucleus | 45/1882 | 290/18723 | 2.16e-03 | 2.10e-02 | 45 |
| GO:007259422 | Liver | HCC | establishment of protein localization to organelle | 299/7958 | 422/18723 | 1.06e-32 | 6.10e-30 | 299 |
| GO:000691322 | Liver | HCC | nucleocytoplasmic transport | 208/7958 | 301/18723 | 5.51e-21 | 8.12e-19 | 208 |
| Page: 1 2 3 4 5 |
| Pathway ID | Tissue | Disease Stage | Description | Gene Ratio | Bg Ratio | pvalue | p.adjust | qvalue | Count |
| hsa0301321 | Esophagus | ESCC | Nucleocytoplasmic transport | 89/4205 | 108/8465 | 1.20e-12 | 2.37e-11 | 1.21e-11 | 89 |
| hsa0301331 | Esophagus | ESCC | Nucleocytoplasmic transport | 89/4205 | 108/8465 | 1.20e-12 | 2.37e-11 | 1.21e-11 | 89 |
| hsa03013 | Liver | HCC | Nucleocytoplasmic transport | 81/4020 | 108/8465 | 4.28e-09 | 6.83e-08 | 3.80e-08 | 81 |
| hsa030131 | Liver | HCC | Nucleocytoplasmic transport | 81/4020 | 108/8465 | 4.28e-09 | 6.83e-08 | 3.80e-08 | 81 |
| hsa030136 | Oral cavity | OSCC | Nucleocytoplasmic transport | 82/3704 | 108/8465 | 7.93e-12 | 1.33e-10 | 6.77e-11 | 82 |
| hsa0301311 | Oral cavity | OSCC | Nucleocytoplasmic transport | 82/3704 | 108/8465 | 7.93e-12 | 1.33e-10 | 6.77e-11 | 82 |
| hsa030132 | Oral cavity | LP | Nucleocytoplasmic transport | 53/2418 | 108/8465 | 4.68e-06 | 4.10e-05 | 2.64e-05 | 53 |
| hsa030133 | Oral cavity | LP | Nucleocytoplasmic transport | 53/2418 | 108/8465 | 4.68e-06 | 4.10e-05 | 2.64e-05 | 53 |
| hsa030134 | Oral cavity | EOLP | Nucleocytoplasmic transport | 34/1218 | 108/8465 | 4.24e-06 | 2.91e-05 | 1.72e-05 | 34 |
| hsa030135 | Oral cavity | EOLP | Nucleocytoplasmic transport | 34/1218 | 108/8465 | 4.24e-06 | 2.91e-05 | 1.72e-05 | 34 |
| Page: 1 |
Top |
Cell-cell communication analysis |
| Identification of potential cell-cell interactions between two cell types and their ligand-receptor pairs for different disease states |
| Ligand | Receptor | LRpair | Pathway | Tissue | Disease Stage |
| Page: 1 |
Top |
Single-cell gene regulatory network inference analysis |
| Find out the significant the regulons (TFs) and the target genes of each regulon across cell types for different disease states |
| TF | Cell Type | Tissue | Disease Stage | Target Gene | RSS | Regulon Activity |
| ∗The dot plots of a searched regulon are shown for all cell subpopulations in each disease state of each tissue based on the regulon specific score inferred using pySCENIC and by calculating the average expression. |
| Page: 1 |
Top |
Somatic mutation of malignant transformation related genes |
| Annotation of somatic variants for genes involved in malignant transformation |
| Hugo Symbol | Variant Class | Variant Classification | dbSNP RS | HGVSc | HGVSp | HGVSp Short | SWISSPROT | BIOTYPE | SIFT | PolyPhen | Tumor Sample Barcode | Tissue | Histology | Sex | Age | Stage | Therapy Types | Drugs | Outcome |
| TNPO1 | SNV | Missense_Mutation | c.2501N>C | p.Ser834Thr | p.S834T | Q92973 | protein_coding | tolerated(0.1) | benign(0) | TCGA-A8-A085-01 | Breast | breast invasive carcinoma | Male | <65 | I/II | Hormone Therapy | tamoxiphen | SD | |
| TNPO1 | SNV | Missense_Mutation | c.1960N>C | p.Asp654His | p.D654H | Q92973 | protein_coding | deleterious(0) | probably_damaging(0.999) | TCGA-AC-A23H-01 | Breast | breast invasive carcinoma | Female | >=65 | I/II | Unknown | Unknown | PD | |
| TNPO1 | SNV | Missense_Mutation | novel | c.2659N>T | p.Pro887Ser | p.P887S | Q92973 | protein_coding | tolerated(0.87) | benign(0.003) | TCGA-AR-A0U0-01 | Breast | breast invasive carcinoma | Female | >=65 | I/II | Unknown | Unknown | SD |
| TNPO1 | SNV | Missense_Mutation | c.2484N>T | p.Met828Ile | p.M828I | Q92973 | protein_coding | deleterious(0.01) | benign(0.034) | TCGA-FU-A40J-01 | Cervix | cervical & endocervical cancer | Female | <65 | III/IV | Chemotherapy | carboplatin | CR | |
| TNPO1 | SNV | Missense_Mutation | c.895G>C | p.Asp299His | p.D299H | Q92973 | protein_coding | deleterious(0.05) | benign(0.006) | TCGA-IR-A3LA-01 | Cervix | cervical & endocervical cancer | Female | <65 | I/II | Chemotherapy | cisplatin | CR | |
| TNPO1 | SNV | Missense_Mutation | novel | c.1799N>T | p.Ser600Leu | p.S600L | Q92973 | protein_coding | deleterious(0) | possibly_damaging(0.801) | TCGA-PN-A8MA-01 | Cervix | cervical & endocervical cancer | Female | <65 | I/II | Chemotherapy | cisplatin | SD |
| TNPO1 | SNV | Missense_Mutation | novel | c.2563G>C | p.Asp855His | p.D855H | Q92973 | protein_coding | tolerated(0.09) | benign(0.109) | TCGA-VS-A9UH-01 | Cervix | cervical & endocervical cancer | Female | <65 | I/II | Chemotherapy | cisplatin | CR |
| TNPO1 | SNV | Missense_Mutation | c.2671N>T | p.Arg891Cys | p.R891C | Q92973 | protein_coding | deleterious(0) | possibly_damaging(0.907) | TCGA-A6-3809-01 | Colorectum | colon adenocarcinoma | Female | >=65 | I/II | Unknown | Unknown | SD | |
| TNPO1 | SNV | Missense_Mutation | novel | c.1411A>G | p.Ser471Gly | p.S471G | Q92973 | protein_coding | tolerated(0.82) | benign(0.102) | TCGA-A6-6141-01 | Colorectum | colon adenocarcinoma | Male | <65 | I/II | Chemotherapy | 5-fu | SD |
| TNPO1 | SNV | Missense_Mutation | c.1723N>T | p.Pro575Ser | p.P575S | Q92973 | protein_coding | deleterious(0) | possibly_damaging(0.686) | TCGA-AA-3510-01 | Colorectum | colon adenocarcinoma | Male | >=65 | I/II | Unknown | Unknown | SD |
| Page: 1 2 3 4 5 6 7 8 9 10 |
Top |
Related drugs of malignant transformation related genes |
| Identification of chemicals and drugs interact with genes involved in malignant transfromation |
| (DGIdb 4.0) |
| Entrez ID | Symbol | Category | Interaction Types | Drug Claim Name | Drug Name | PMIDs |
| Page: 1 |

Copyright 2023-Present -The University of Texas Health Science Center at Houston |