
|
|||||
|
 | |
| |
| |
| |
| |
| |
|
Gene: TNNT1 |
Gene summary for TNNT1 |
| Gene information | Species | Human | Gene symbol | TNNT1 | Gene ID | 7138 |
| Gene name | troponin T1, slow skeletal type | |
| Gene Alias | ANM | |
| Cytomap | 19q13.42 | |
| Gene Type | protein-coding | GO ID | GO:0003008 | UniProtAcc | P13805 |
Top |
Malignant transformation analysis |
| Identification of the aberrant gene expression in precancerous and cancerous lesions by comparing the gene expression of stem-like cells in diseased tissues with normal stem cells |
| Entrez ID | Symbol | Replicates | Species | Organ | Tissue | Adj P-value | Log2FC | Malignancy |
| 7138 | TNNT1 | GSM4909281 | Human | Breast | IDC | 1.25e-55 | 7.80e-01 | 0.21 |
| 7138 | TNNT1 | GSM4909285 | Human | Breast | IDC | 3.12e-21 | 3.83e-01 | 0.21 |
| 7138 | TNNT1 | GSM4909286 | Human | Breast | IDC | 6.67e-30 | 4.49e-01 | 0.1081 |
| 7138 | TNNT1 | GSM4909291 | Human | Breast | IDC | 9.98e-18 | 4.52e-01 | 0.1753 |
| 7138 | TNNT1 | GSM4909292 | Human | Breast | IDC | 1.29e-04 | 3.94e-01 | 0.1236 |
| 7138 | TNNT1 | GSM4909297 | Human | Breast | IDC | 4.70e-23 | 6.27e-01 | 0.1517 |
| 7138 | TNNT1 | GSM4909298 | Human | Breast | IDC | 7.43e-75 | 9.48e-01 | 0.1551 |
| 7138 | TNNT1 | GSM4909304 | Human | Breast | IDC | 9.86e-53 | 6.71e-01 | 0.1636 |
| 7138 | TNNT1 | GSM4909305 | Human | Breast | IDC | 5.57e-10 | 2.51e-01 | 0.0436 |
| 7138 | TNNT1 | GSM4909306 | Human | Breast | IDC | 3.58e-22 | 4.89e-01 | 0.1564 |
| 7138 | TNNT1 | GSM4909307 | Human | Breast | IDC | 5.45e-14 | 3.44e-01 | 0.1569 |
| 7138 | TNNT1 | GSM4909308 | Human | Breast | IDC | 1.70e-42 | 6.34e-01 | 0.158 |
| 7138 | TNNT1 | GSM4909309 | Human | Breast | IDC | 9.14e-06 | 1.78e-01 | 0.0483 |
| 7138 | TNNT1 | GSM4909315 | Human | Breast | IDC | 5.93e-63 | 1.16e+00 | 0.21 |
| 7138 | TNNT1 | GSM4909316 | Human | Breast | IDC | 1.21e-12 | 5.85e-01 | 0.21 |
| 7138 | TNNT1 | GSM4909317 | Human | Breast | IDC | 1.63e-02 | 8.75e-02 | 0.1355 |
| 7138 | TNNT1 | GSM4909319 | Human | Breast | IDC | 1.81e-16 | 6.17e-01 | 0.1563 |
| 7138 | TNNT1 | GSM4909320 | Human | Breast | IDC | 5.41e-13 | 5.77e-01 | 0.1575 |
| 7138 | TNNT1 | GSM4909321 | Human | Breast | IDC | 2.26e-14 | 4.75e-01 | 0.1559 |
| 7138 | TNNT1 | M5 | Human | Breast | IDC | 1.98e-17 | 7.47e-01 | 0.1598 |
| Page: 1 2 3 4 5 6 |
| Tissue | Expression Dynamics | Abbreviation |
| Breast | 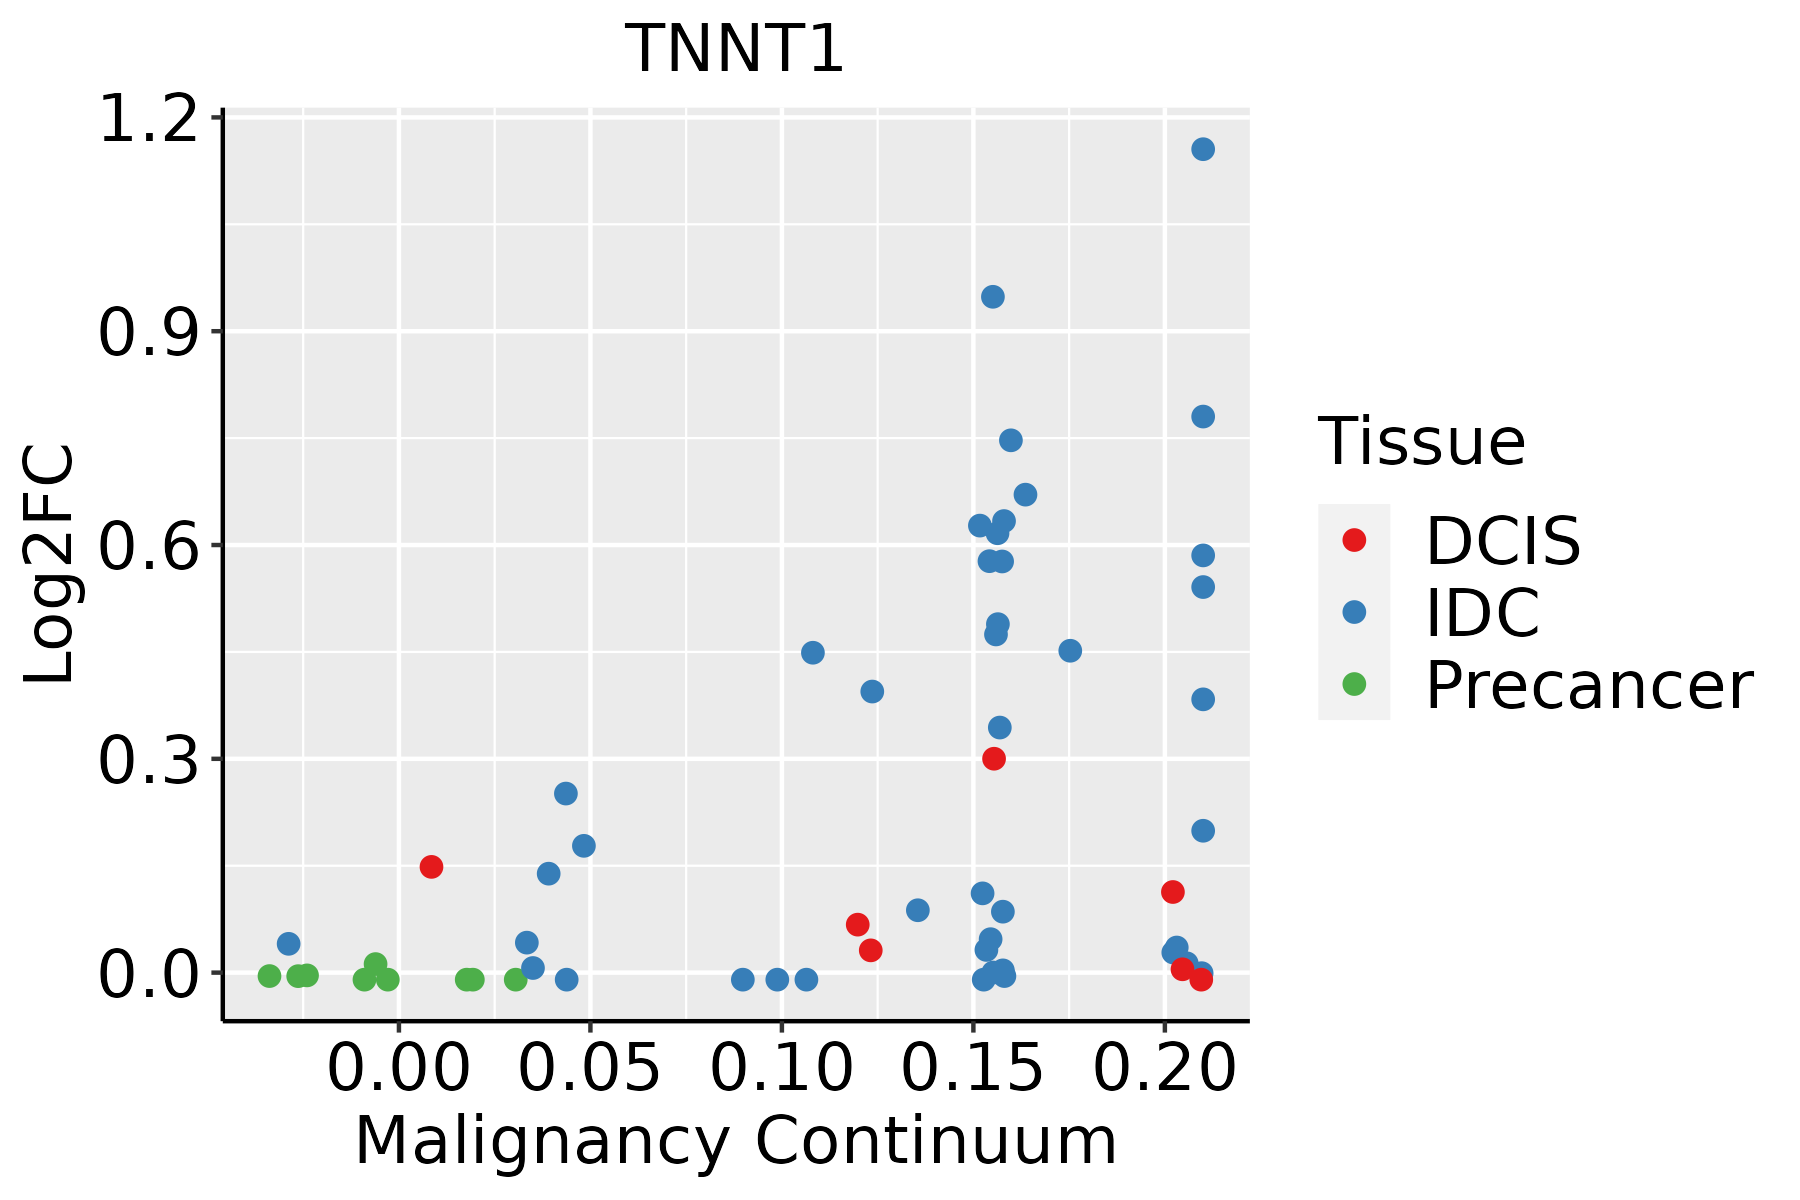 | IDC: Invasive ductal carcinoma |
| DCIS: Ductal carcinoma in situ | ||
| Precancer(BRCA1-mut): Precancerous lesion from BRCA1 mutation carriers | ||
| Cervix | 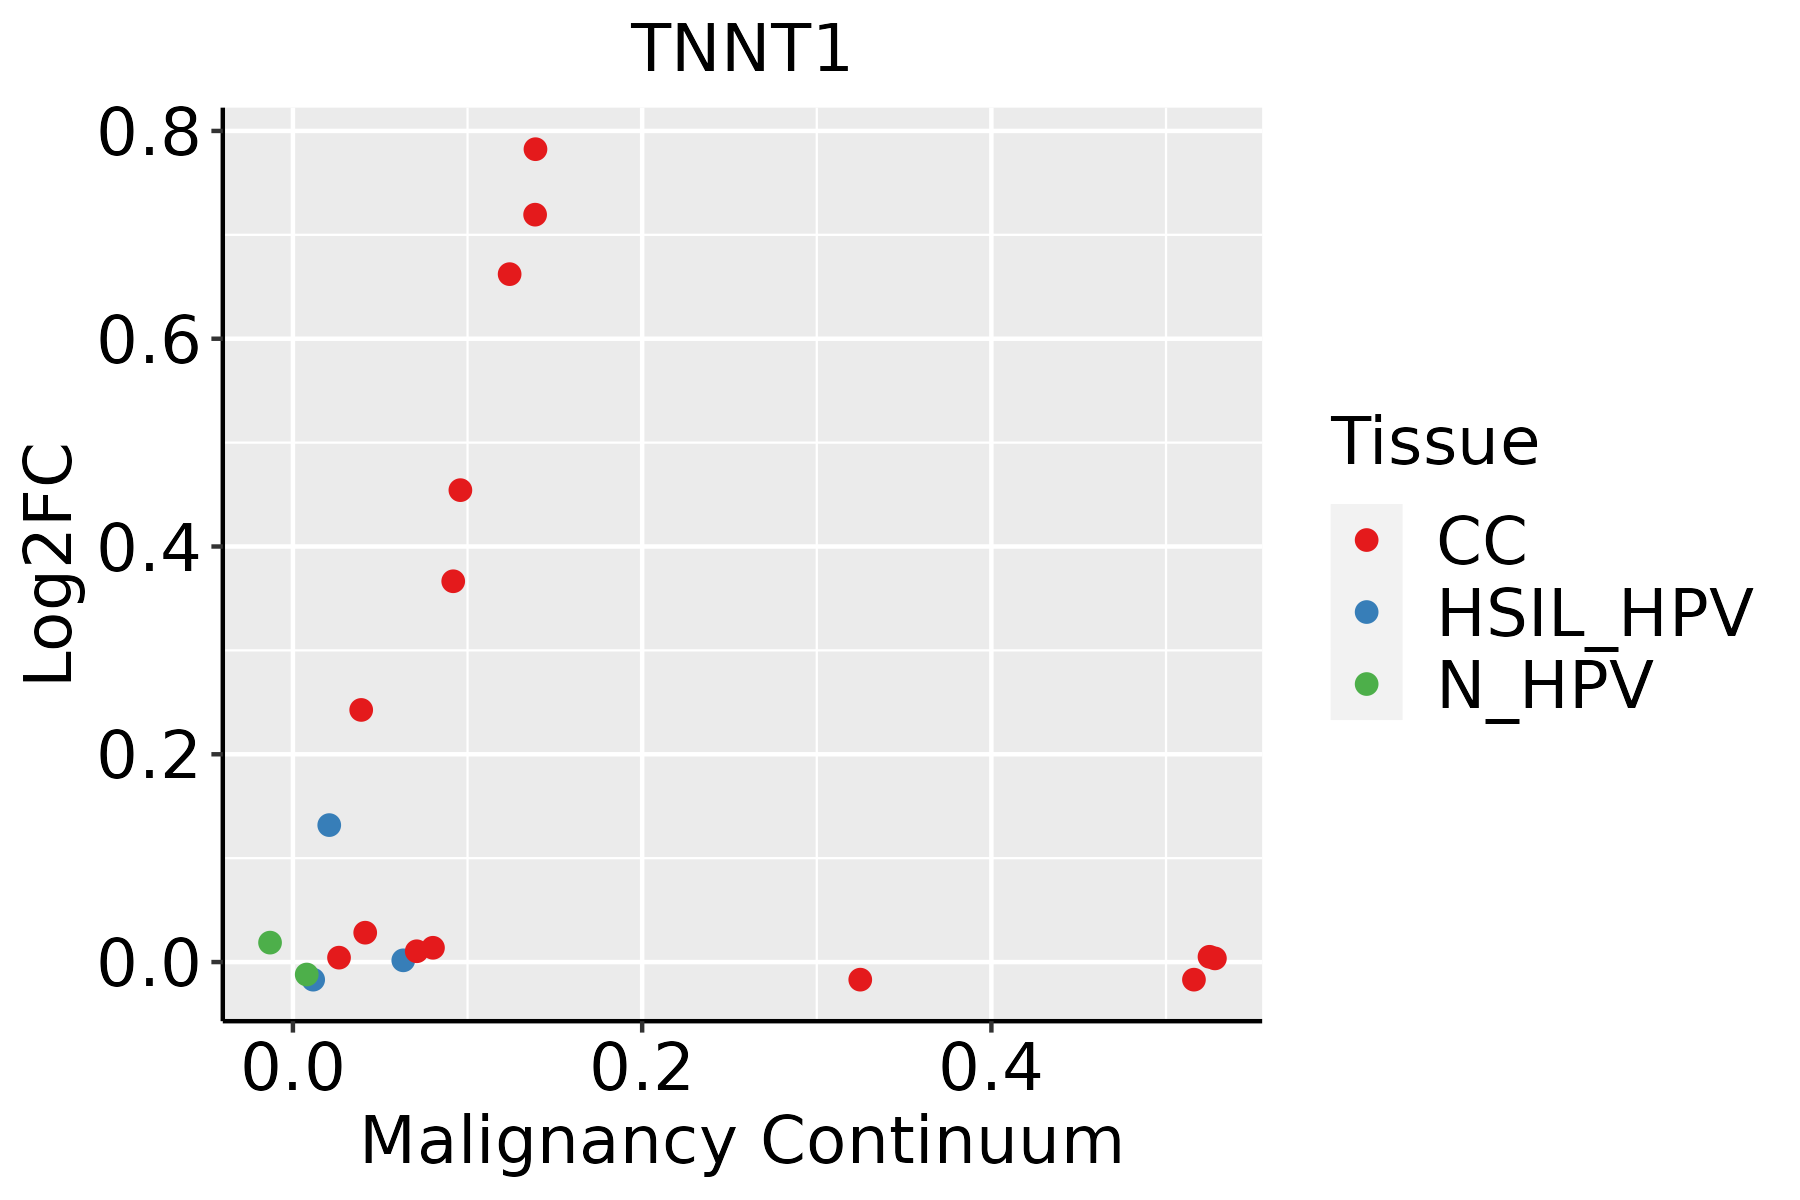 | CC: Cervix cancer |
| HSIL_HPV: HPV-infected high-grade squamous intraepithelial lesions | ||
| N_HPV: HPV-infected normal cervix | ||
| Esophagus |  | ESCC: Esophageal squamous cell carcinoma |
| HGIN: High-grade intraepithelial neoplasias | ||
| LGIN: Low-grade intraepithelial neoplasias | ||
| Liver | 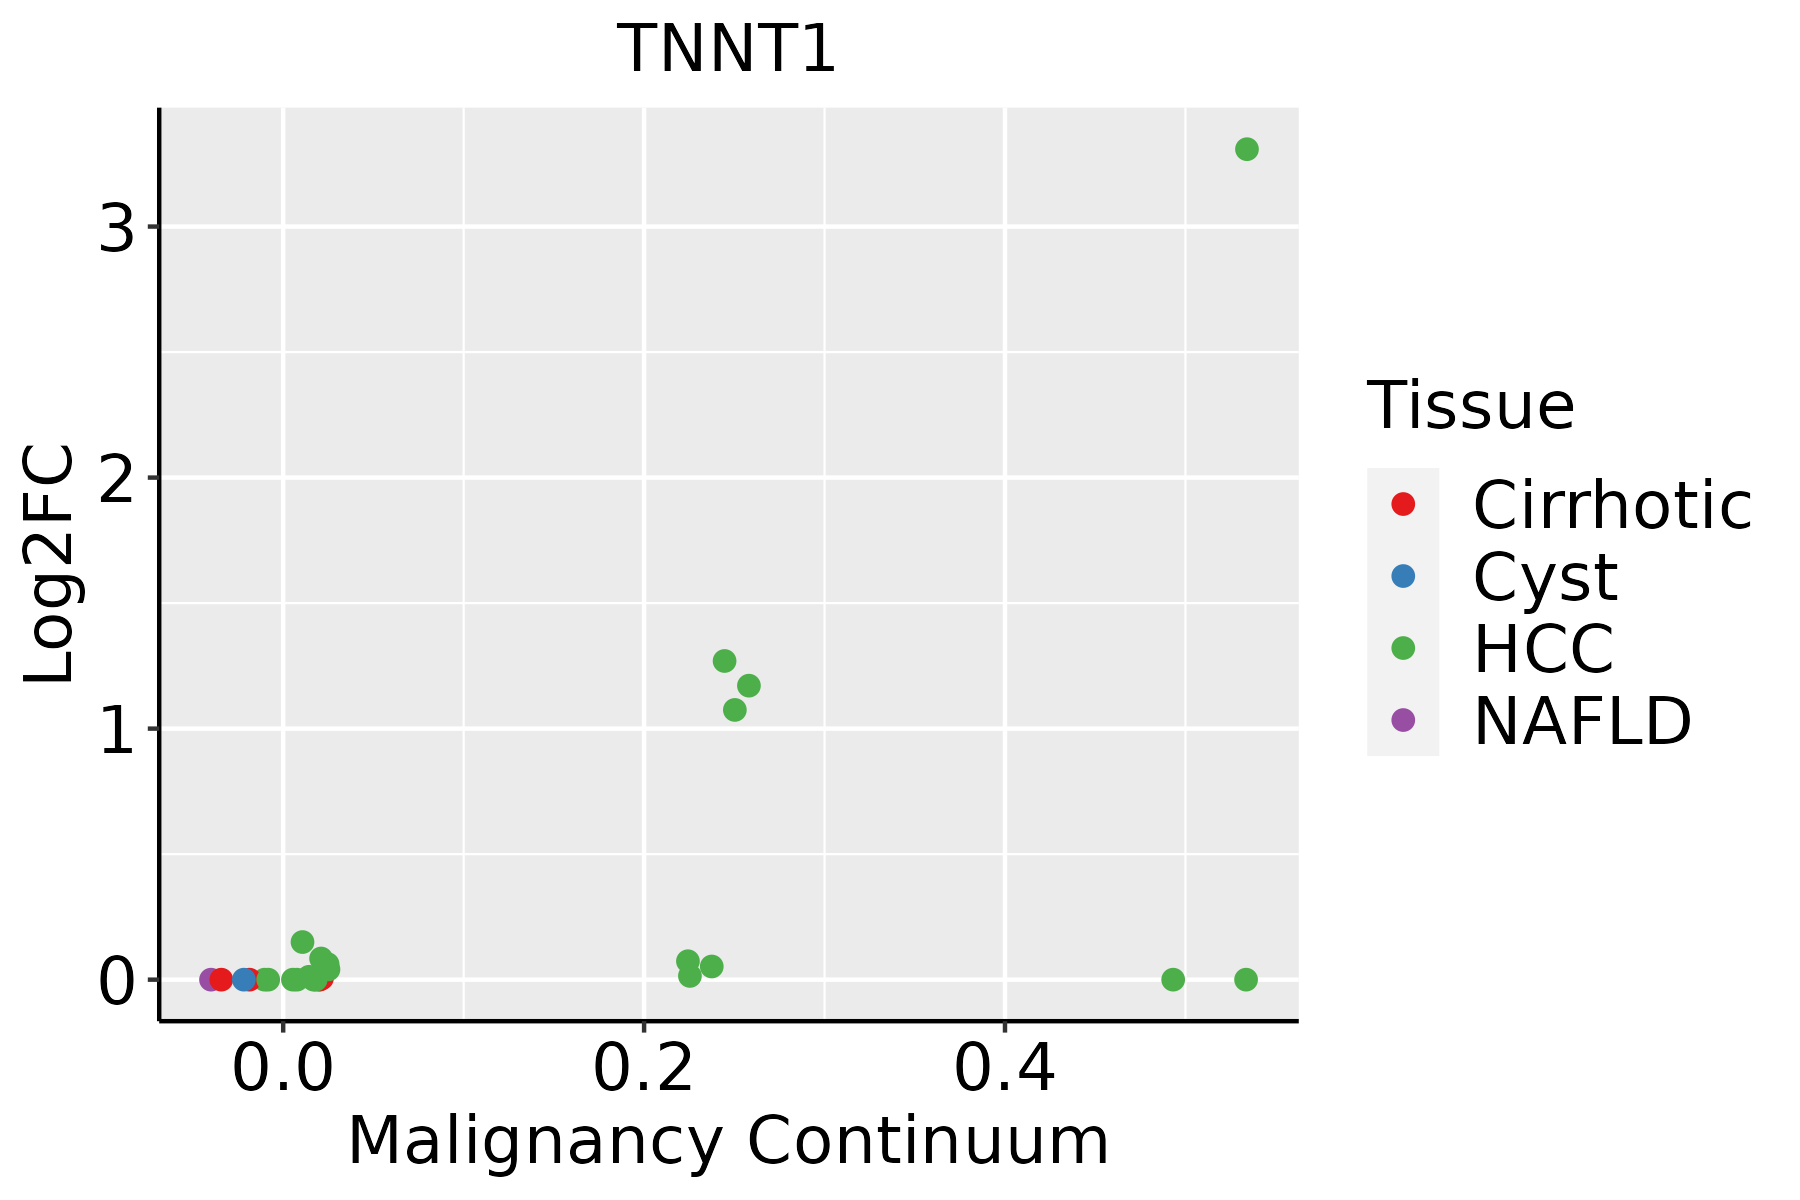 | HCC: Hepatocellular carcinoma |
| NAFLD: Non-alcoholic fatty liver disease | ||
| Oral Cavity |  | EOLP: Erosive Oral lichen planus |
| LP: leukoplakia | ||
| NEOLP: Non-erosive oral lichen planus | ||
| OSCC: Oral squamous cell carcinoma | ||
| Skin | 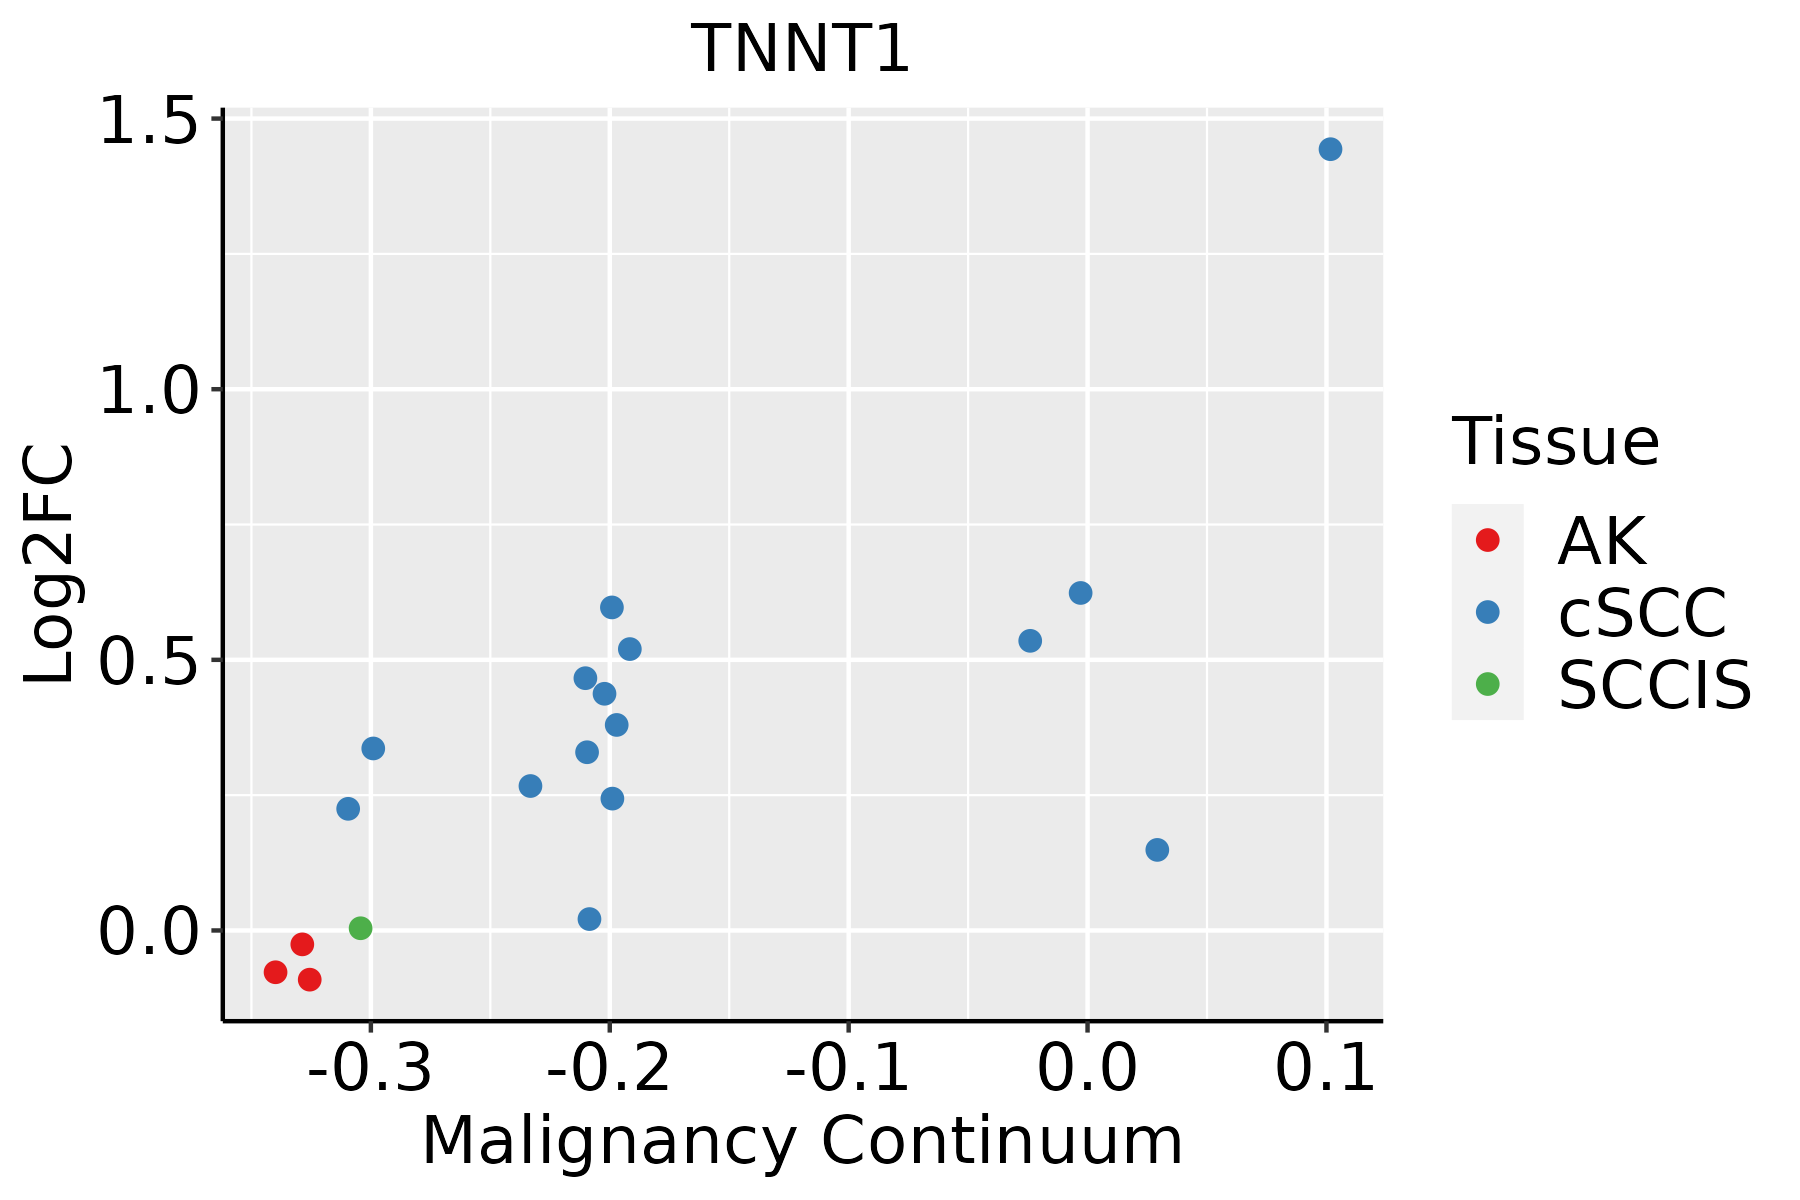 | AK: Actinic keratosis |
| cSCC: Cutaneous squamous cell carcinoma | ||
| SCCIS:squamous cell carcinoma in situ | ||
| Thyroid | 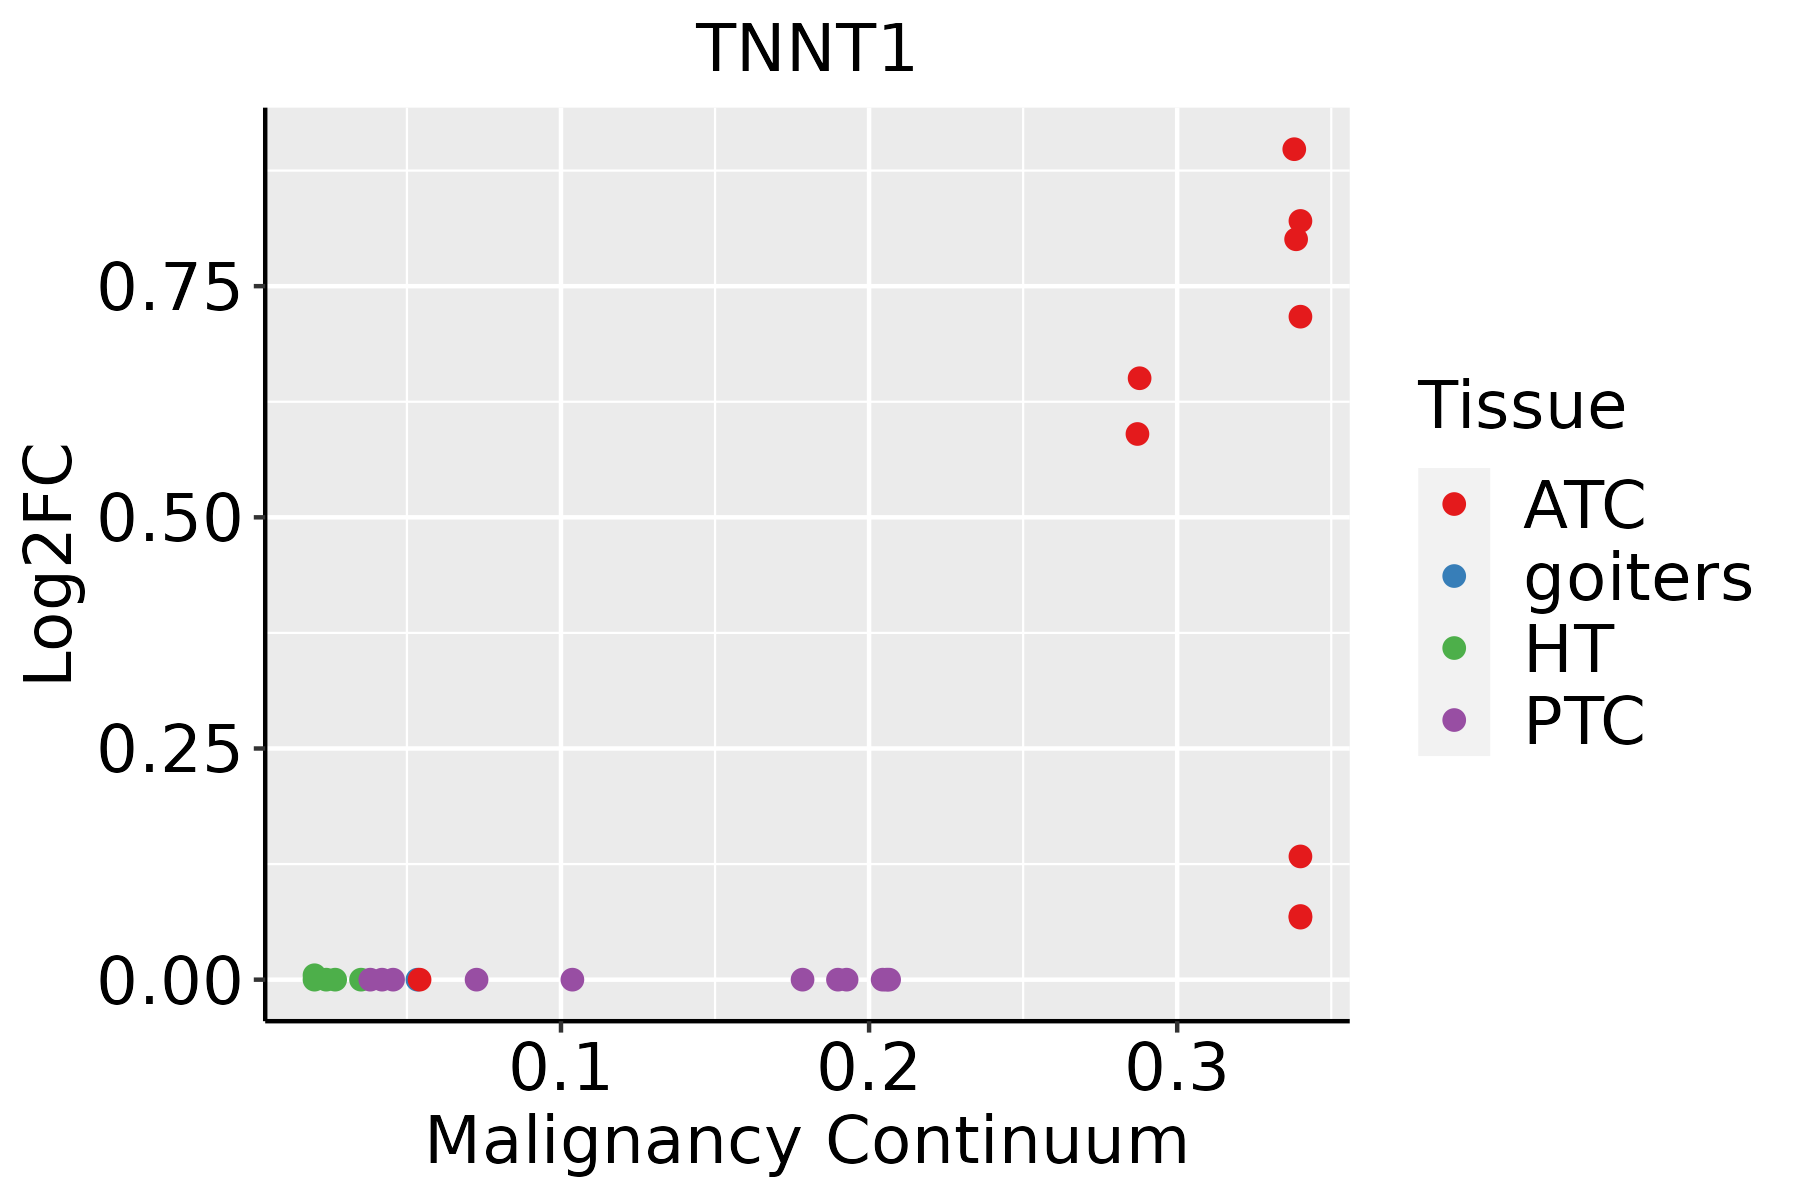 | ATC: Anaplastic thyroid cancer |
| HT: Hashimoto's thyroiditis | ||
| PTC: Papillary thyroid cancer |
| ∗log2FC in expression of this searched gene in stem-like cells from each diseased tissue sample relative to stem-like cells in normal samples in each tissue plotted against the malignancy continuum. Samples are colored based on if they are from different disease stage. |
Top |
Malignant transformation related pathway analysis |
| Find out the enriched GO biological processes and KEGG pathways involved in transition from healthy to precancer to cancer |
| Tissue | Disease Stage | Enriched GO biological Processes |
| Colorectum | AD |  |
| Colorectum | SER |  |
| Colorectum | MSS |  |
| Colorectum | MSI-H |  |
| Colorectum | FAP |  |
| ∗Top 15 enriched GO BP terms are showed in the bar plot of each disease state in each tissue. Each row represents a significant GO biological process which is colored according to the -log10(p.adjust). |
| Page: 1 2 3 4 5 6 7 8 9 |
| GO ID | Tissue | Disease Stage | Description | Gene Ratio | Bg Ratio | pvalue | p.adjust | Count |
| GO:00426923 | Breast | IDC | muscle cell differentiation | 44/1434 | 384/18723 | 4.77e-03 | 3.66e-02 | 44 |
| GO:00030125 | Breast | IDC | muscle system process | 50/1434 | 452/18723 | 5.52e-03 | 4.05e-02 | 50 |
| GO:00511463 | Breast | IDC | striated muscle cell differentiation | 34/1434 | 283/18723 | 6.00e-03 | 4.31e-02 | 34 |
| GO:000301212 | Breast | DCIS | muscle system process | 50/1390 | 452/18723 | 3.02e-03 | 2.57e-02 | 50 |
| GO:004269211 | Breast | DCIS | muscle cell differentiation | 43/1390 | 384/18723 | 4.56e-03 | 3.49e-02 | 43 |
| GO:00310328 | Breast | DCIS | actomyosin structure organization | 25/1390 | 196/18723 | 5.59e-03 | 4.06e-02 | 25 |
| GO:005114611 | Breast | DCIS | striated muscle cell differentiation | 33/1390 | 283/18723 | 6.63e-03 | 4.62e-02 | 33 |
| GO:00310329 | Cervix | CC | actomyosin structure organization | 43/2311 | 196/18723 | 1.11e-04 | 1.40e-03 | 43 |
| GO:00426924 | Cervix | CC | muscle cell differentiation | 69/2311 | 384/18723 | 8.12e-04 | 7.09e-03 | 69 |
| GO:00511464 | Cervix | CC | striated muscle cell differentiation | 50/2311 | 283/18723 | 5.53e-03 | 3.19e-02 | 50 |
| GO:00902578 | Cervix | CC | regulation of muscle system process | 45/2311 | 252/18723 | 6.73e-03 | 3.70e-02 | 45 |
| GO:00435024 | Cervix | CC | regulation of muscle adaptation | 21/2311 | 98/18723 | 7.71e-03 | 4.09e-02 | 21 |
| GO:005114612 | Cervix | HSIL_HPV | striated muscle cell differentiation | 22/737 | 283/18723 | 1.94e-03 | 2.04e-02 | 22 |
| GO:003103219 | Esophagus | ESCC | actomyosin structure organization | 108/8552 | 196/18723 | 4.86e-03 | 1.88e-02 | 108 |
| GO:003103222 | Liver | HCC | actomyosin structure organization | 109/7958 | 196/18723 | 1.39e-04 | 1.13e-03 | 109 |
| GO:00426927 | Oral cavity | OSCC | muscle cell differentiation | 175/7305 | 384/18723 | 4.79e-03 | 1.92e-02 | 175 |
| GO:003103217 | Oral cavity | OSCC | actomyosin structure organization | 93/7305 | 196/18723 | 9.63e-03 | 3.41e-02 | 93 |
| GO:004269214 | Oral cavity | EOLP | muscle cell differentiation | 77/2218 | 384/18723 | 2.18e-06 | 4.91e-05 | 77 |
| GO:00511467 | Oral cavity | EOLP | striated muscle cell differentiation | 57/2218 | 283/18723 | 3.82e-05 | 5.25e-04 | 57 |
| GO:003103218 | Oral cavity | EOLP | actomyosin structure organization | 39/2218 | 196/18723 | 7.64e-04 | 6.12e-03 | 39 |
| Page: 1 2 |
| Pathway ID | Tissue | Disease Stage | Description | Gene Ratio | Bg Ratio | pvalue | p.adjust | qvalue | Count |
| hsa048145 | Oral cavity | NEOLP | Motor proteins | 37/1112 | 193/8465 | 1.06e-02 | 3.54e-02 | 2.22e-02 | 37 |
| hsa0481412 | Oral cavity | NEOLP | Motor proteins | 37/1112 | 193/8465 | 1.06e-02 | 3.54e-02 | 2.22e-02 | 37 |
| Page: 1 |
Top |
Cell-cell communication analysis |
| Identification of potential cell-cell interactions between two cell types and their ligand-receptor pairs for different disease states |
| Ligand | Receptor | LRpair | Pathway | Tissue | Disease Stage |
| Page: 1 |
Top |
Single-cell gene regulatory network inference analysis |
| Find out the significant the regulons (TFs) and the target genes of each regulon across cell types for different disease states |
| TF | Cell Type | Tissue | Disease Stage | Target Gene | RSS | Regulon Activity |
| ∗The dot plots of a searched regulon are shown for all cell subpopulations in each disease state of each tissue based on the regulon specific score inferred using pySCENIC and by calculating the average expression. |
| Page: 1 |
Top |
Somatic mutation of malignant transformation related genes |
| Annotation of somatic variants for genes involved in malignant transformation |
| Hugo Symbol | Variant Class | Variant Classification | dbSNP RS | HGVSc | HGVSp | HGVSp Short | SWISSPROT | BIOTYPE | SIFT | PolyPhen | Tumor Sample Barcode | Tissue | Histology | Sex | Age | Stage | Therapy Types | Drugs | Outcome |
| TNNT1 | SNV | Missense_Mutation | c.406N>A | p.Glu136Lys | p.E136K | P13805 | protein_coding | deleterious(0.01) | possibly_damaging(0.798) | TCGA-BH-A0HF-01 | Breast | breast invasive carcinoma | Female | >=65 | I/II | Hormone Therapy | arimidex | SD | |
| TNNT1 | SNV | Missense_Mutation | rs763320583 | c.348N>A | p.Phe116Leu | p.F116L | P13805 | protein_coding | tolerated(0.09) | benign(0.168) | TCGA-C8-A274-01 | Breast | breast invasive carcinoma | Female | <65 | I/II | Hormone Therapy | tamoxiphen | SD |
| TNNT1 | SNV | Missense_Mutation | c.116N>A | p.Arg39His | p.R39H | P13805 | protein_coding | deleterious(0) | probably_damaging(0.964) | TCGA-WT-AB41-01 | Breast | breast invasive carcinoma | Female | <65 | I/II | Chemotherapy | taxotere | CR | |
| TNNT1 | insertion | Frame_Shift_Ins | novel | c.797_798insTGTT | p.Lys266AsnfsTer38 | p.K266Nfs*38 | P13805 | protein_coding | TCGA-A2-A0EX-01 | Breast | breast invasive carcinoma | Female | <65 | I/II | Hormone Therapy | tamoxiphen | SD | ||
| TNNT1 | SNV | Missense_Mutation | c.370N>T | p.Arg124Cys | p.R124C | P13805 | protein_coding | deleterious(0.02) | probably_damaging(0.999) | TCGA-2W-A8YY-01 | Cervix | cervical & endocervical cancer | Female | <65 | I/II | Chemotherapy | cisplatin | CR | |
| TNNT1 | SNV | Missense_Mutation | c.673G>A | p.Glu225Lys | p.E225K | P13805 | protein_coding | deleterious(0) | probably_damaging(0.991) | TCGA-MA-AA41-01 | Cervix | cervical & endocervical cancer | Female | <65 | I/II | Unknown | Unknown | SD | |
| TNNT1 | SNV | Missense_Mutation | novel | c.41N>G | p.Pro14Arg | p.P14R | P13805 | protein_coding | tolerated_low_confidence(0.51) | benign(0.01) | TCGA-VS-A8EI-01 | Cervix | cervical & endocervical cancer | Female | <65 | I/II | Chemotherapy | cisplatin | CR |
| TNNT1 | SNV | Missense_Mutation | c.131N>A | p.Arg44His | p.R44H | P13805 | protein_coding | deleterious(0.05) | possibly_damaging(0.893) | TCGA-A6-3809-01 | Colorectum | colon adenocarcinoma | Female | >=65 | I/II | Unknown | Unknown | SD | |
| TNNT1 | SNV | Missense_Mutation | c.723N>T | p.Met241Ile | p.M241I | P13805 | protein_coding | tolerated(0.43) | benign(0.079) | TCGA-AA-3710-01 | Colorectum | colon adenocarcinoma | Female | >=65 | I/II | Unknown | Unknown | SD | |
| TNNT1 | SNV | Missense_Mutation | c.370C>T | p.Arg124Cys | p.R124C | P13805 | protein_coding | deleterious(0.02) | probably_damaging(0.999) | TCGA-CA-5255-01 | Colorectum | colon adenocarcinoma | Male | <65 | I/II | Chemotherapy | oxaliplatin | CR |
| Page: 1 2 3 4 5 |
Top |
Related drugs of malignant transformation related genes |
| Identification of chemicals and drugs interact with genes involved in malignant transfromation |
| (DGIdb 4.0) |
| Entrez ID | Symbol | Category | Interaction Types | Drug Claim Name | Drug Name | PMIDs |
| 7138 | TNNT1 | NA | TIRAMSETIV |
| Page: 1 |

Copyright 2023-Present -The University of Texas Health Science Center at Houston |