
|
|||||
|
 | |
| |
| |
| |
| |
| |
|
Gene: TNNI3 |
Gene summary for TNNI3 |
| Gene information | Species | Human | Gene symbol | TNNI3 | Gene ID | 7137 |
| Gene name | troponin I3, cardiac type | |
| Gene Alias | CMD1FF | |
| Cytomap | 19q13.42 | |
| Gene Type | protein-coding | GO ID | GO:0001568 | UniProtAcc | P19429 |
Top |
Malignant transformation analysis |
| Identification of the aberrant gene expression in precancerous and cancerous lesions by comparing the gene expression of stem-like cells in diseased tissues with normal stem cells |
| Entrez ID | Symbol | Replicates | Species | Organ | Tissue | Adj P-value | Log2FC | Malignancy |
| 7137 | TNNI3 | LZE24T | Human | Esophagus | ESCC | 4.03e-04 | 1.44e-01 | 0.0596 |
| 7137 | TNNI3 | LZE6T | Human | Esophagus | ESCC | 3.57e-07 | 3.77e-01 | 0.0845 |
| 7137 | TNNI3 | P2T-E | Human | Esophagus | ESCC | 3.75e-03 | 9.09e-02 | 0.1177 |
| 7137 | TNNI3 | P8T-E | Human | Esophagus | ESCC | 4.44e-08 | 1.77e-01 | 0.0889 |
| 7137 | TNNI3 | P11T-E | Human | Esophagus | ESCC | 7.17e-07 | 3.96e-01 | 0.1426 |
| 7137 | TNNI3 | P15T-E | Human | Esophagus | ESCC | 1.27e-03 | 1.34e-01 | 0.1149 |
| 7137 | TNNI3 | P17T-E | Human | Esophagus | ESCC | 8.80e-03 | 1.84e-01 | 0.1278 |
| 7137 | TNNI3 | P21T-E | Human | Esophagus | ESCC | 3.89e-12 | 2.29e-01 | 0.1617 |
| 7137 | TNNI3 | P26T-E | Human | Esophagus | ESCC | 3.87e-34 | 5.45e-01 | 0.1276 |
| 7137 | TNNI3 | P28T-E | Human | Esophagus | ESCC | 7.98e-13 | 2.79e-01 | 0.1149 |
| 7137 | TNNI3 | P36T-E | Human | Esophagus | ESCC | 1.18e-02 | 2.68e-01 | 0.1187 |
| 7137 | TNNI3 | P37T-E | Human | Esophagus | ESCC | 3.92e-25 | 8.08e-01 | 0.1371 |
| 7137 | TNNI3 | P42T-E | Human | Esophagus | ESCC | 4.16e-02 | 2.04e-01 | 0.1175 |
| 7137 | TNNI3 | P52T-E | Human | Esophagus | ESCC | 1.88e-04 | 1.29e-01 | 0.1555 |
| 7137 | TNNI3 | P57T-E | Human | Esophagus | ESCC | 9.44e-07 | 1.83e-01 | 0.0926 |
| 7137 | TNNI3 | P74T-E | Human | Esophagus | ESCC | 5.32e-05 | 1.64e-01 | 0.1479 |
| 7137 | TNNI3 | P76T-E | Human | Esophagus | ESCC | 9.20e-06 | 1.65e-01 | 0.1207 |
| 7137 | TNNI3 | P80T-E | Human | Esophagus | ESCC | 7.84e-28 | 8.15e-01 | 0.155 |
| 7137 | TNNI3 | P82T-E | Human | Esophagus | ESCC | 1.60e-03 | 3.98e-01 | 0.1072 |
| 7137 | TNNI3 | P83T-E | Human | Esophagus | ESCC | 2.08e-03 | 1.99e-01 | 0.1738 |
| Page: 1 2 |
| Tissue | Expression Dynamics | Abbreviation |
| Esophagus | 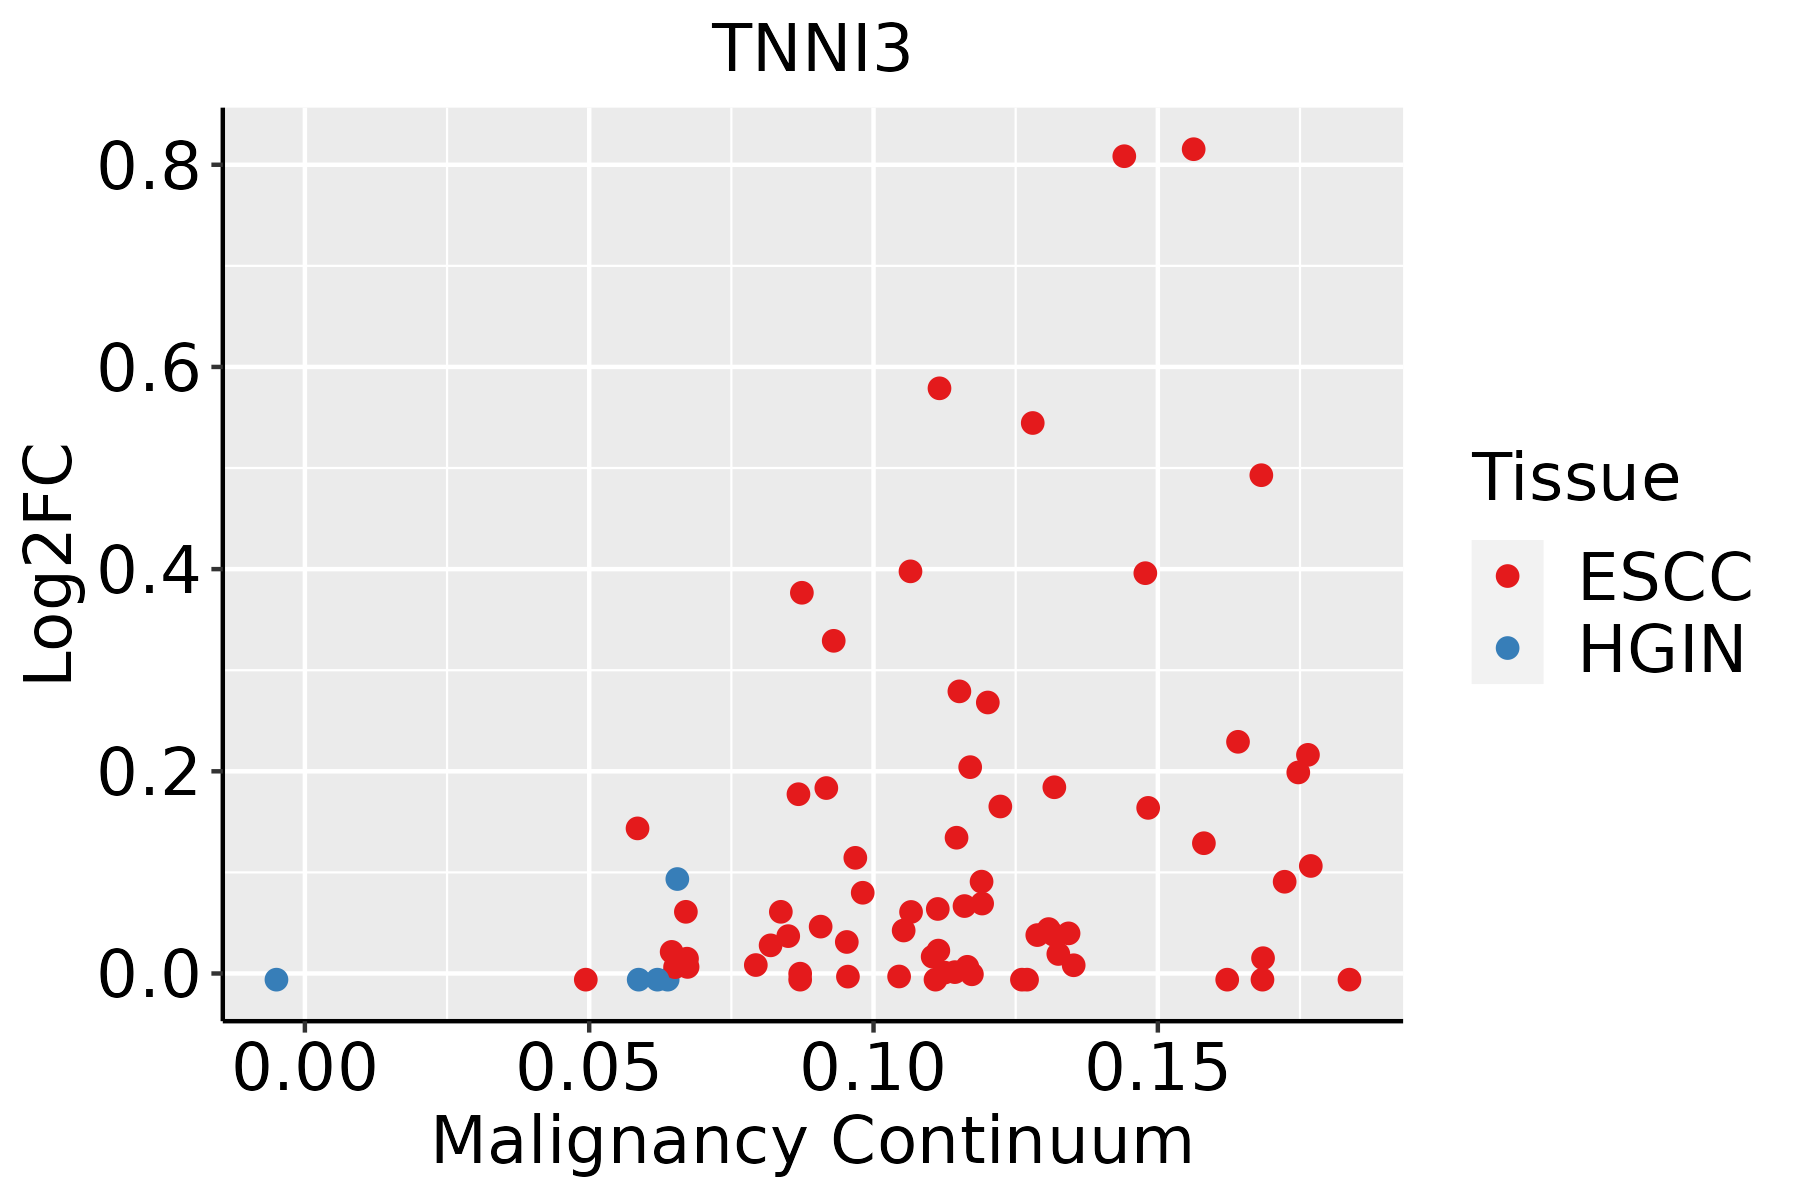 | ESCC: Esophageal squamous cell carcinoma |
| HGIN: High-grade intraepithelial neoplasias | ||
| LGIN: Low-grade intraepithelial neoplasias |
| ∗log2FC in expression of this searched gene in stem-like cells from each diseased tissue sample relative to stem-like cells in normal samples in each tissue plotted against the malignancy continuum. Samples are colored based on if they are from different disease stage. |
Top |
Malignant transformation related pathway analysis |
| Find out the enriched GO biological processes and KEGG pathways involved in transition from healthy to precancer to cancer |
| Tissue | Disease Stage | Enriched GO biological Processes |
| Colorectum | AD |  |
| Colorectum | SER |  |
| Colorectum | MSS |  |
| Colorectum | MSI-H |  |
| Colorectum | FAP |  |
| ∗Top 15 enriched GO BP terms are showed in the bar plot of each disease state in each tissue. Each row represents a significant GO biological process which is colored according to the -log10(p.adjust). |
| Page: 1 2 3 4 5 6 7 8 9 |
| GO ID | Tissue | Disease Stage | Description | Gene Ratio | Bg Ratio | pvalue | p.adjust | Count |
| GO:0051346110 | Esophagus | ESCC | negative regulation of hydrolase activity | 208/8552 | 379/18723 | 1.76e-04 | 1.14e-03 | 208 |
| GO:006053716 | Esophagus | ESCC | muscle tissue development | 211/8552 | 403/18723 | 3.84e-03 | 1.56e-02 | 211 |
| GO:00434627 | Esophagus | ESCC | regulation of ATPase activity | 30/8552 | 46/18723 | 5.91e-03 | 2.18e-02 | 30 |
| GO:001470615 | Esophagus | ESCC | striated muscle tissue development | 197/8552 | 384/18723 | 1.46e-02 | 4.74e-02 | 197 |
| Page: 1 |
| Pathway ID | Tissue | Disease Stage | Description | Gene Ratio | Bg Ratio | pvalue | p.adjust | qvalue | Count |
| hsa05415211 | Esophagus | ESCC | Diabetic cardiomyopathy | 146/4205 | 203/8465 | 5.81e-11 | 7.78e-10 | 3.99e-10 | 146 |
| hsa0541538 | Esophagus | ESCC | Diabetic cardiomyopathy | 146/4205 | 203/8465 | 5.81e-11 | 7.78e-10 | 3.99e-10 | 146 |
| Page: 1 |
Top |
Cell-cell communication analysis |
| Identification of potential cell-cell interactions between two cell types and their ligand-receptor pairs for different disease states |
| Ligand | Receptor | LRpair | Pathway | Tissue | Disease Stage |
| Page: 1 |
Top |
Single-cell gene regulatory network inference analysis |
| Find out the significant the regulons (TFs) and the target genes of each regulon across cell types for different disease states |
| TF | Cell Type | Tissue | Disease Stage | Target Gene | RSS | Regulon Activity |
| ∗The dot plots of a searched regulon are shown for all cell subpopulations in each disease state of each tissue based on the regulon specific score inferred using pySCENIC and by calculating the average expression. |
| Page: 1 |
Top |
Somatic mutation of malignant transformation related genes |
| Annotation of somatic variants for genes involved in malignant transformation |
| Hugo Symbol | Variant Class | Variant Classification | dbSNP RS | HGVSc | HGVSp | HGVSp Short | SWISSPROT | BIOTYPE | SIFT | PolyPhen | Tumor Sample Barcode | Tissue | Histology | Sex | Age | Stage | Therapy Types | Drugs | Outcome |
| TNNI3 | SNV | Missense_Mutation | rs104894727 | c.586N>A | p.Asp196Asn | p.D196N | P19429 | protein_coding | deleterious(0) | possibly_damaging(0.679) | TCGA-AN-A046-01 | Breast | breast invasive carcinoma | Female | >=65 | I/II | Unknown | Unknown | SD |
| TNNI3 | SNV | Missense_Mutation | c.350N>G | p.Lys117Arg | p.K117R | P19429 | protein_coding | tolerated(0.09) | benign(0.03) | TCGA-B6-A0RP-01 | Breast | breast invasive carcinoma | Female | >=65 | I/II | Unknown | Unknown | PD | |
| TNNI3 | SNV | Missense_Mutation | rs727504268 | c.625N>A | p.Glu209Lys | p.E209K | P19429 | protein_coding | deleterious(0) | possibly_damaging(0.899) | TCGA-D8-A1JA-01 | Breast | breast invasive carcinoma | Female | <65 | III/IV | Chemotherapy | adriamycin | PD |
| TNNI3 | SNV | Missense_Mutation | c.56N>C | p.Ile19Thr | p.I19T | P19429 | protein_coding | tolerated(0.22) | benign(0.011) | TCGA-D8-A1XQ-01 | Breast | breast invasive carcinoma | Female | >=65 | I/II | Unknown | Unknown | SD | |
| TNNI3 | SNV | Missense_Mutation | rs730881069 | c.407N>A | p.Arg136Gln | p.R136Q | P19429 | protein_coding | tolerated(0.17) | possibly_damaging(0.775) | TCGA-LL-A7T0-01 | Breast | breast invasive carcinoma | Female | >=65 | I/II | Unknown | Unknown | SD |
| TNNI3 | SNV | Missense_Mutation | rs371000425 | c.308G>A | p.Arg103His | p.R103H | P19429 | protein_coding | deleterious(0.01) | benign(0.318) | TCGA-AA-3672-01 | Colorectum | colon adenocarcinoma | Female | >=65 | III/IV | Unknown | Unknown | SD |
| TNNI3 | SNV | Missense_Mutation | novel | c.82N>A | p.Ala28Thr | p.A28T | P19429 | protein_coding | tolerated(0.26) | possibly_damaging(0.525) | TCGA-AA-3950-01 | Colorectum | colon adenocarcinoma | Female | >=65 | I/II | Unknown | Unknown | SD |
| TNNI3 | SNV | Missense_Mutation | rs104894729 | c.575N>A | p.Arg192His | p.R192H | P19429 | protein_coding | deleterious(0) | probably_damaging(0.994) | TCGA-NH-A5IV-01 | Colorectum | colon adenocarcinoma | Female | >=65 | I/II | Unknown | Unknown | SD |
| TNNI3 | SNV | Missense_Mutation | c.403C>A | p.Leu135Ile | p.L135I | P19429 | protein_coding | tolerated(0.06) | possibly_damaging(0.673) | TCGA-DC-6158-01 | Colorectum | rectum adenocarcinoma | Male | >=65 | I/II | Unknown | Unknown | SD | |
| TNNI3 | SNV | Missense_Mutation | novel | c.606G>T | p.Glu202Asp | p.E202D | P19429 | protein_coding | tolerated(0.23) | probably_damaging(0.967) | TCGA-A5-A0G1-01 | Endometrium | uterine corpus endometrioid carcinoma | Female | >=65 | I/II | Unknown | Unknown | SD |
| Page: 1 2 3 4 |
Top |
Related drugs of malignant transformation related genes |
| Identification of chemicals and drugs interact with genes involved in malignant transfromation |
| (DGIdb 4.0) |
| Entrez ID | Symbol | Category | Interaction Types | Drug Claim Name | Drug Name | PMIDs |
| 7137 | TNNI3 | DRUGGABLE GENOME | PURPUROGALLIN | PURPUROGALLIN | ||
| 7137 | TNNI3 | DRUGGABLE GENOME | PYROGALLOL RED | PYROGALLOL RED | ||
| 7137 | TNNI3 | DRUGGABLE GENOME | NSC-107022 | CHEMBL1601846 |
| Page: 1 |

Copyright 2023-Present -The University of Texas Health Science Center at Houston |